World Journal of Nuclear Science and Technology
Vol.4 No.1(2014), Article ID:42513,7 pages DOI:10.4236/wjnst.2014.41005
Numerical Case Study on the LDIE Degradation Occurred in the Vent Header of a High Pressure Feedwater Heater
1Power Engineering Research Institute, KEPCO-E&C, Yongin, Korea
2Computational Solution in Complex Physics, ELSOLTEC, Yongin, Korea
Email: hkseo@kepco-enc.com
Copyright © 2014 Hyukki Seo et al. This is an open access article distributed under the Creative Commons Attribution License, which permits unrestricted use, distribution, and reproduction in any medium, provided the original work is properly cited. In accordance of the Creative Commons Attribution License all Copyrights © 2014 are reserved for SCIRP and the owner of the intellectual property Hyukki Seo et al. All Copyright © 2014 are guarded by law and by SCIRP as a guardian.
Received October 17, 2013; revised November 23, 2013; accepted December 19, 2013
KEYWORDS
Liquid Droplet Impingement Erosion; Feedwater Heater; Lagrangian Model; Volume of Fluid Model; Eulerian Model; Two-Phase Flow
ABSTRACT
Piping installed in nuclear power plants is affected by various types of degradation mechanisms and may be ruptured due to gradual thinning. The degradation mechanisms such as flow-accelerated corrosion (FAC), cavitation, liquid droplet impingement erosion (LDIE), etc., can lead to costly outages and repairs and possibly affect plant reliability. In August 2008, the header pipe in the high pressure feedwater heater vent system leaked at a Korean nuclear power plant. After cutting the pipe during refueling outage, it was identified that the leak was due to LDIE. This paper presents the numerical analysis results, using various multi-phase models of ANSYS FLUENT for the purpose of identifying the cause of the LDIE. The numerical analysis methods which are most similar to the damage of the pipe are proposed for the comparison of analysis results with each multi-phase model.
1. Introduction
Generally, pipe components made of carbon or low alloy steel placed on secondary system in nuclear power plants have experienced wall-thinning caused by FAC (Flow Accelerated Corrosion) or erosion such as cavitation, flashing, and LDIE (Liquid Droplet Impingement Erosion). FAC is a corrosion phenomenon accelerated by the high temperature, high velocity water and wet steam circumstances. To manage the wall-thinning in nuclear power plants, FAC management programs have developed and applied for plant utilities [1].
In August 2008, the vent header pipe in a high pressure feedwater heater system of the secondary system was leaked and repaired at a Korean nuclear power plant. It is non-safety-related, but it can lead to power decrease in nuclear power plants. After cutting the pipe during refueling outage, it was identified that the leak was due to LDIE. LDIE mainly occurs in pipe flow which is high quality of two-phase fluid. And the degree of erosion is determined by droplet size, impact velocity, impact frequency, density, viscosity, etc. In this study, we performed computational fluid dynamic (CFD) analyses using the FLUENT in order to analyze the LDIE damage and to prevent accidental damage on similar pipelines.
The numerical analyses were performed using the multi-phase analysis models provided by FLUENT such as Lagrangian model, Volume of Fluid model and Eulerian model. After that, LDIE-effecting factors, local velocity, distribution of droplet, impulse, ect., were compared with the leaked pipe. In the analysis of multi-phase models, the numerical analysis model is suggested herein as being the most similar to the damage of the leaked pipe.
2. Characteristic of Design, Operation and Damage
2.1. Characteristic of Design and Operation
Figure 1 shows a schematic diagram of the header pipe in the high pressure feedwater heater vent system. Leakage occurred at the point of the dashed circle in the Figure, wherein two pipelines are connected to each feed-water heater. The fluid flows to the condenser through the 2-inch pipe and the 6-inch header. The feedwater heater vent system operates continuously during the normal operation. An orifice and an emergency bypass line are installed on each pipeline. The fluid flowing in the vent line is two-phased, and all pipe components are made of carbon or low alloy steel [2].
2.2. Characteristic of Damage
Figure 2 shows a damaged header wall on the opposite side of the 2-inch vent pipe. It was damaged as the shape of a ring. In Figure 2, black magnetite was formed on the surface of the damaged header. The bright region around the damaged area is the base metal of pipe. It is conjectured that the damaged area is affected by the droplets passed through the vent pipe. After droplets were collided with the opposite wall, reflecting high velocity droplets evoked the erosion of magnetite.
3. Model Description and Numerical Analysis Methods
3.1. Model Description
To analyze the LDIE damage of the header connected to
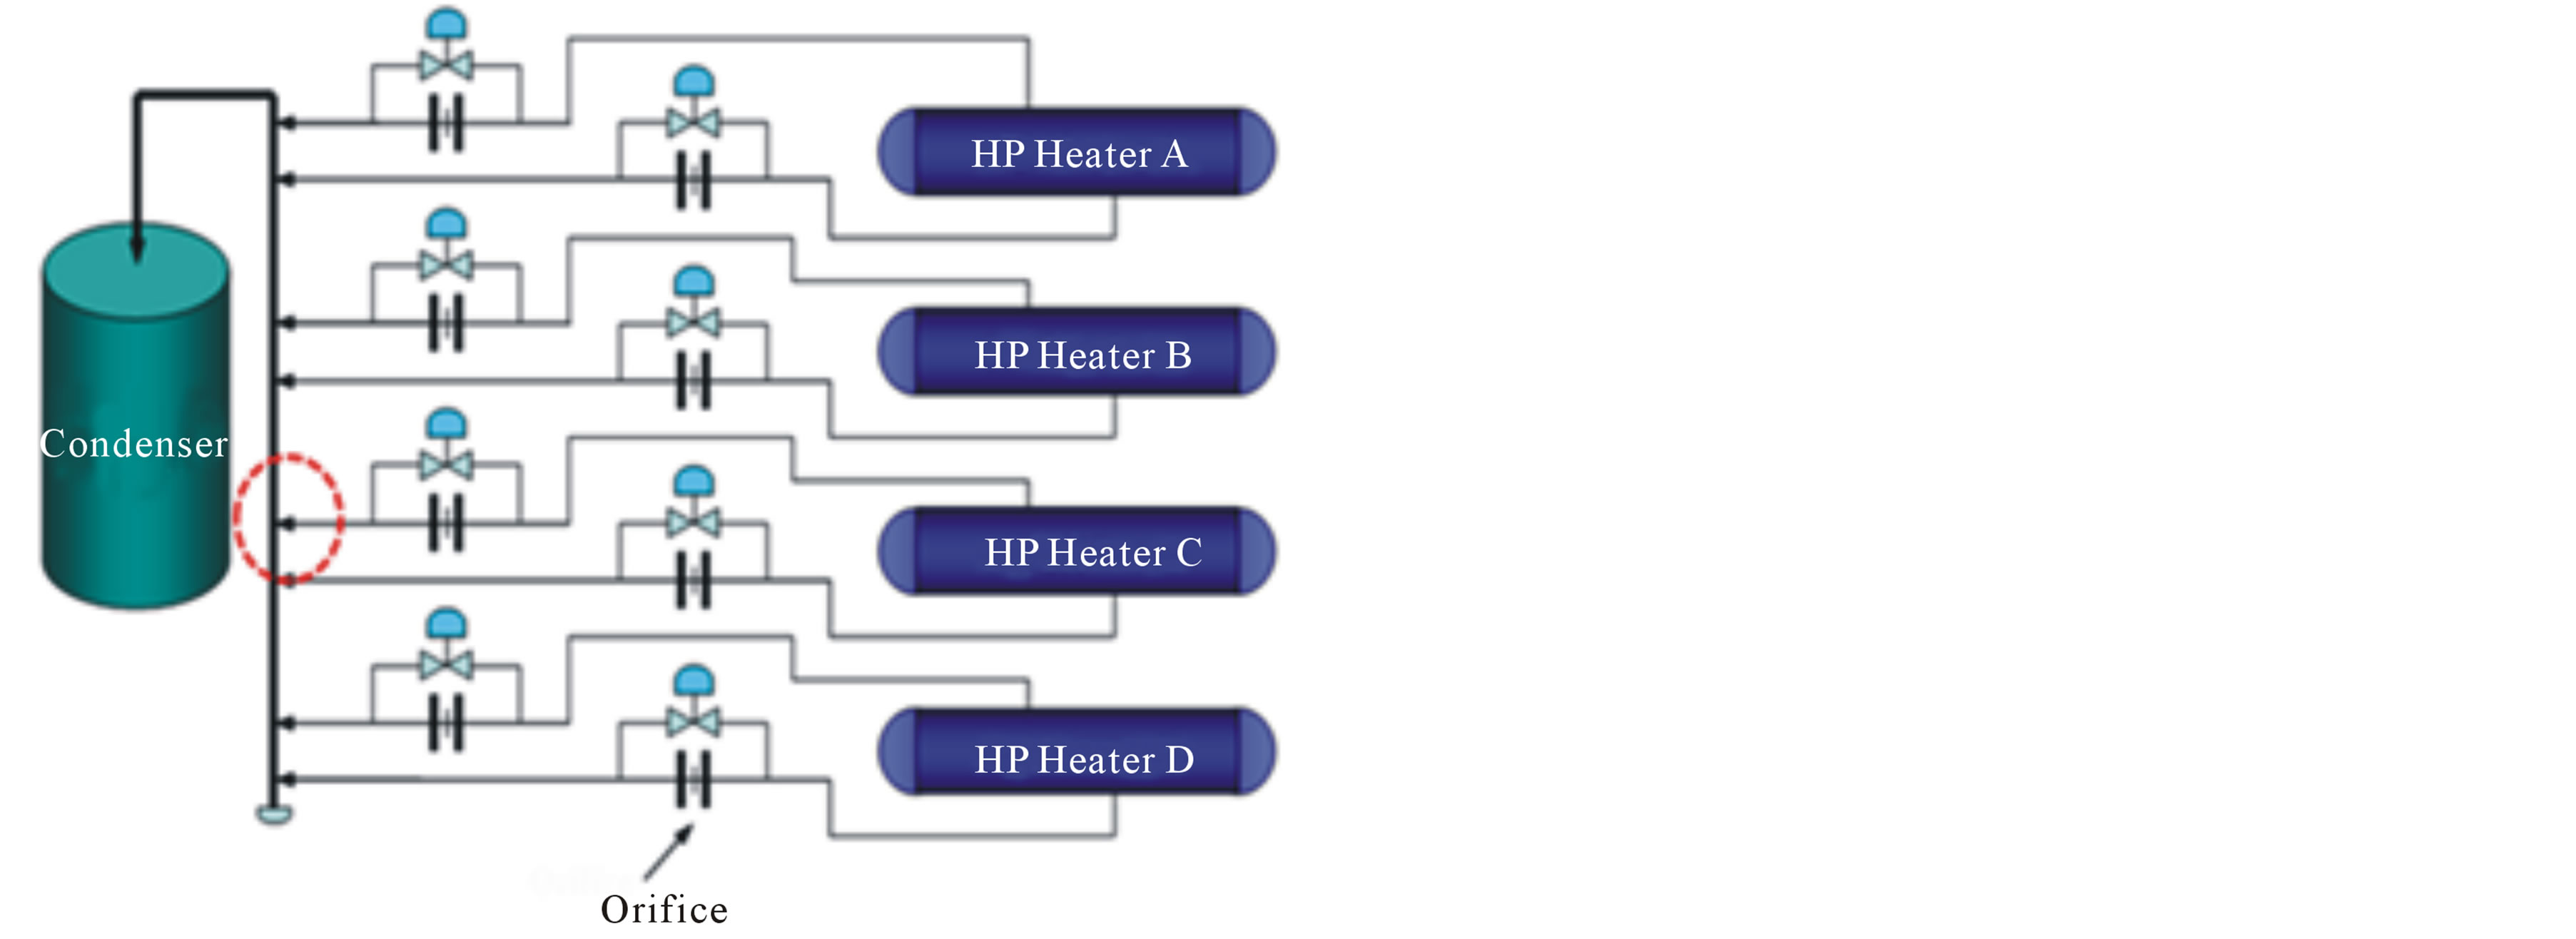
Figure 1. System Schematic Diagram.
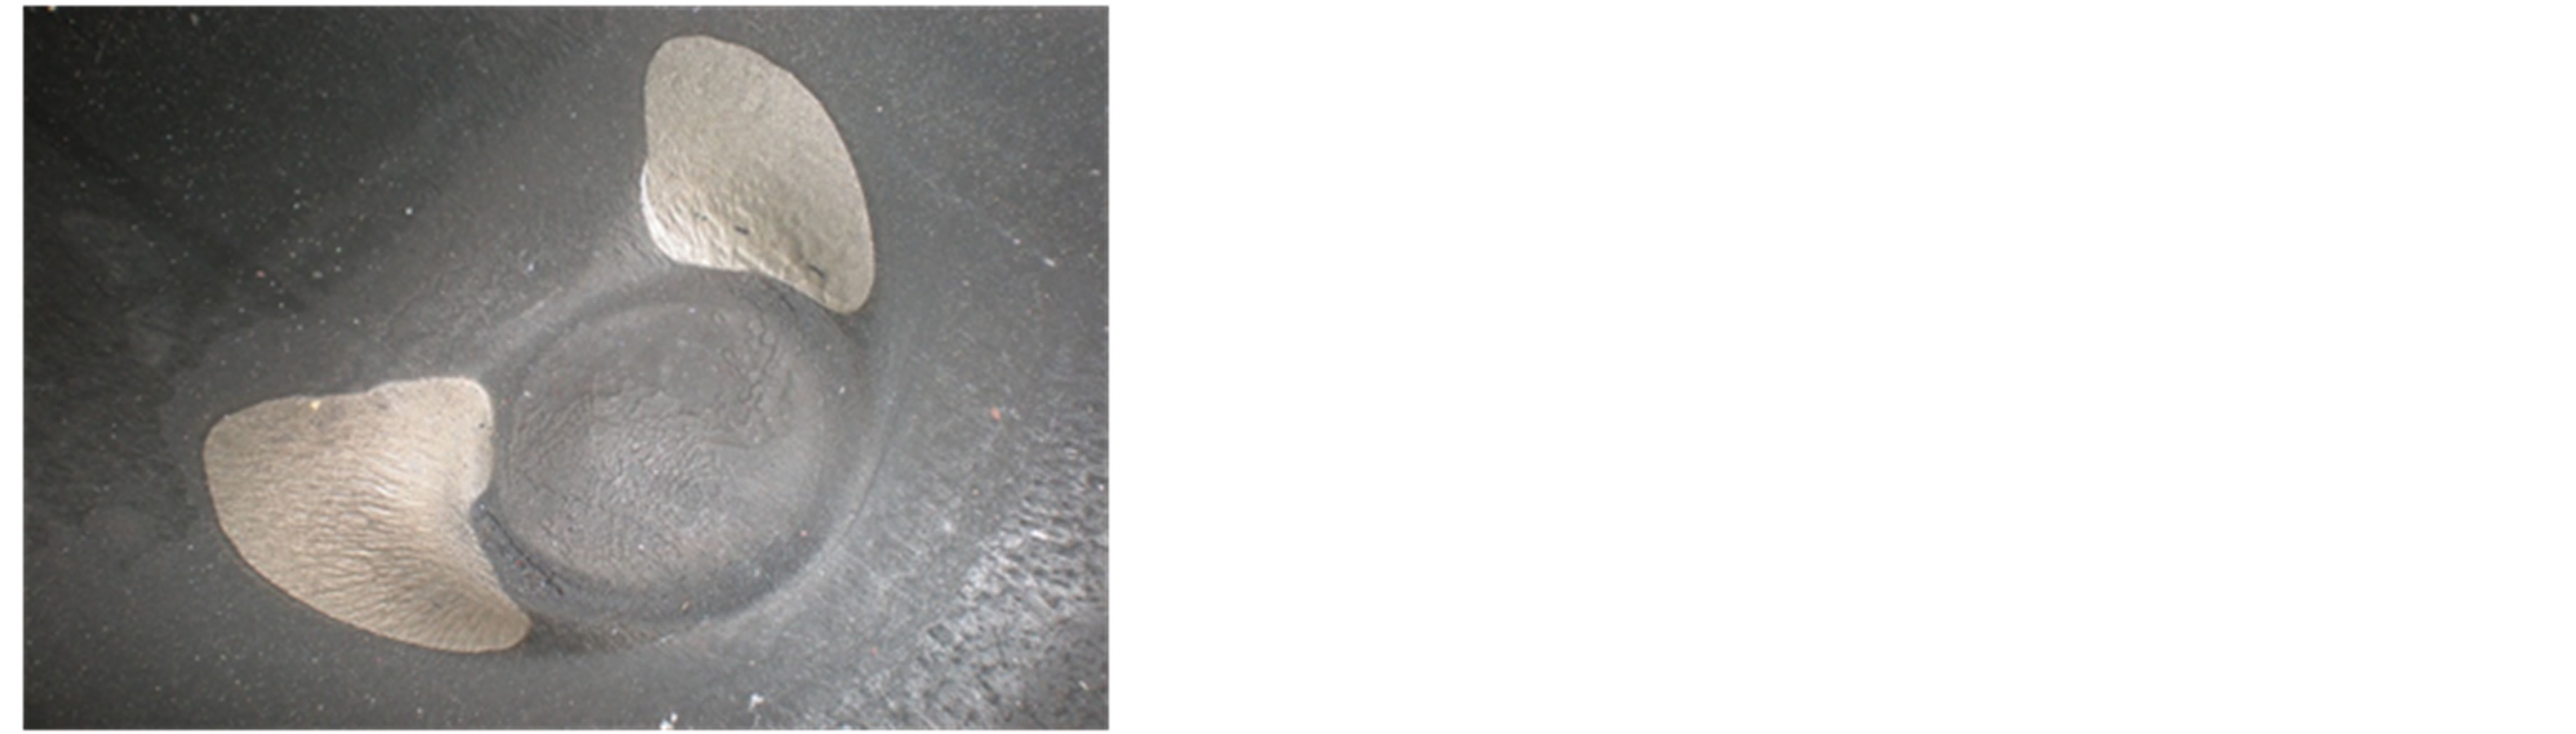
Figure 2. Configuration of degraded surface.
the feedwater heater vent pipeline, numerical analyses was performed by FLUENT. Figure 3 shows the analysis model of the header with eight vent pipelines.
Orifice was excluded from the model because the orifice is away from the header 20D over. The turbulence effect generated by orifice can be excluded. The valves installed in bypass piping excluded from the analysis model because they are closed during the normal operation. The mesh type of fluid inside the pipelines is the mix of the prismatic and tetrahedral grid. The number of meshes differs by a numerical analysis model.
3.2. VOF (Volume of Fluid) Model
The VOF model can make use of two or more immiscible fluids by solving a single set of momentum equations and tracking the volume fraction of each of the fluids throughout the domain. Typical applications of the VOF model include stratified flows, free-surface flows, filling, sloshing, the motion of large bubbles in a liquid, the motion of liquid after a dam break, the prediction of jet breakup, and the steady or transient tracking of any liquid-gas interface. The interface is given as a function, which is defined as the volume fraction of one of the fluids within each cell.
The VOF model can be directly solved in the interface without defined droplets size but each cell must have the value of the volume fraction of between zero and one. So if the size of the droplet is smaller than the size of the cell, it is difficult to expect an accurate analysis result [3,4].
Figure 4 shows the mesh configuration of VOF model. The number of meshes is about 600 million.
3.3. Lagrangian Model
The Lagrangian model performs Lagrangian trajectory calculations for dispersed phases (particles, droplets, or
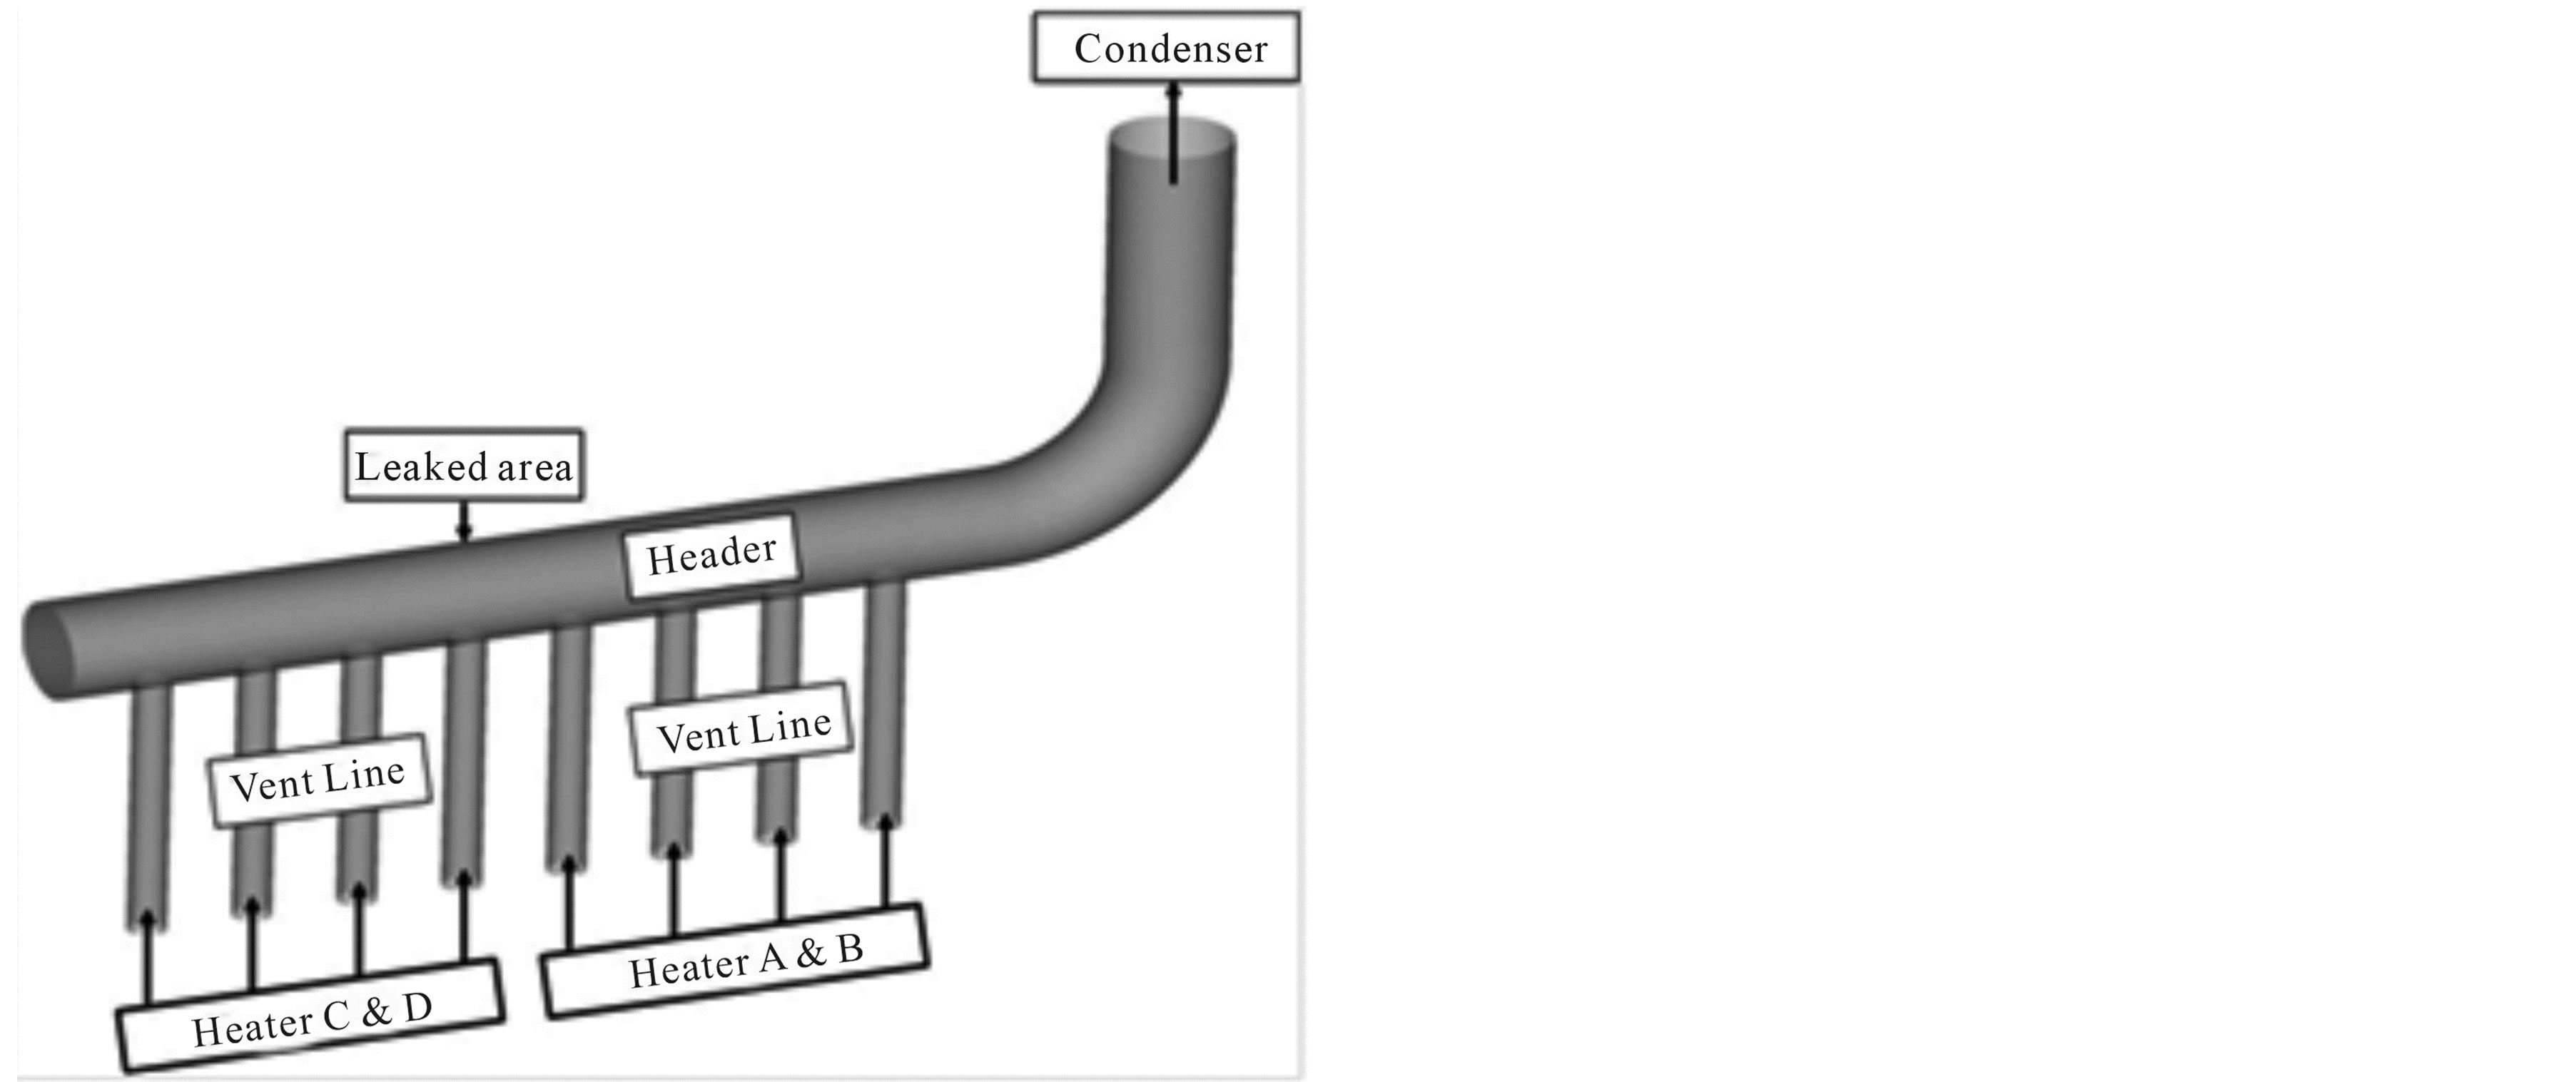
Figure 3. Analysis model for vent line.
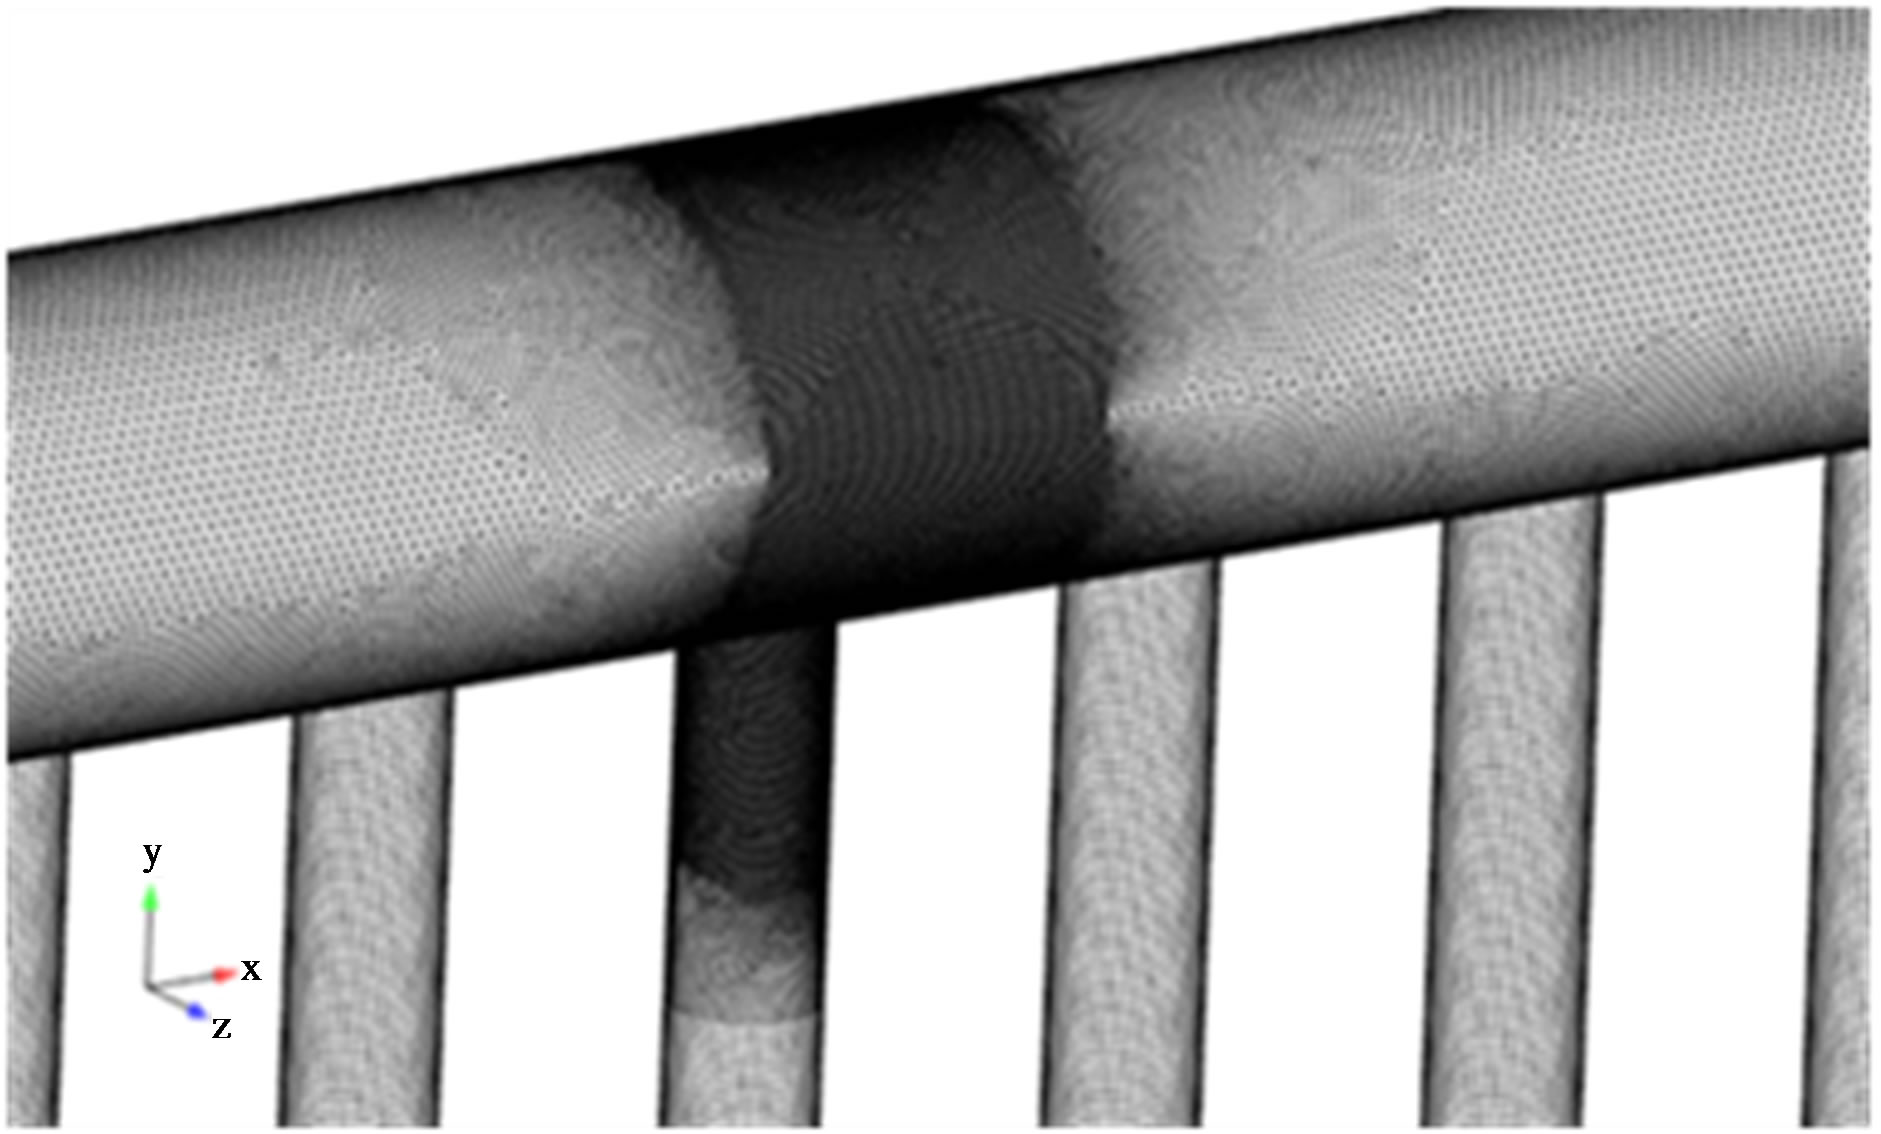
Figure 4. Mesh configuration of VOF model.
bubbles), including coupling with the continuous phase. This model follows the Euler-Lagrange approach. The fluid phase is treated as a continuum by solving the Navier-Stokes equations, while the dispersed phase is solved by tracking a large number of particles, bubbles, or droplets through the calculated flow field. The dispersed phase can exchange momentum, mass, and energy with the fluid phase. This makes the model appropriate for the modeling of spray dryers, coal and liquid fuel combustion, and some particle-laden flows, but inappropriate for the modeling of liquid-liquid mixtures, fluidized beds, or any application where the volume fraction of the second phase cannot be neglected [3,4].
3.4. Eulerian Model
The Eulerian multiphase model allows for the modeling of multiple separate, yet interacting phases. The phases can be liquids, gases, or solids in nearly any combination. It solves a set of momentum and continuity equations for each phase. With the Eulerian multiphase model, the number of secondary phases is limited only by memory requirements and convergence behavior. Any number of secondary phases can be modeled, provided that sufficient memory is available. However, if the size of the droplets is too large, interphase exchange coefficient is increased. As a result, there may be a problem of convergence [3,4].
Figure 5 shows the mesh configuration of Lagrangian model and Eulerian model. The number of meshes is around 110 million.
3.5. Boundary Conditions
To calculate fluid flow in the pipe, continuity and momentum equations were used, and turbulence was incorporated in the code calculations through the use of standard k-ε model.
Figure 6 shows the location of droplets generation in the case of VOF model. Droplets were generated from the wall of the vent pipe near the header, and the size of the droplets was not defined in advance. In the cases of
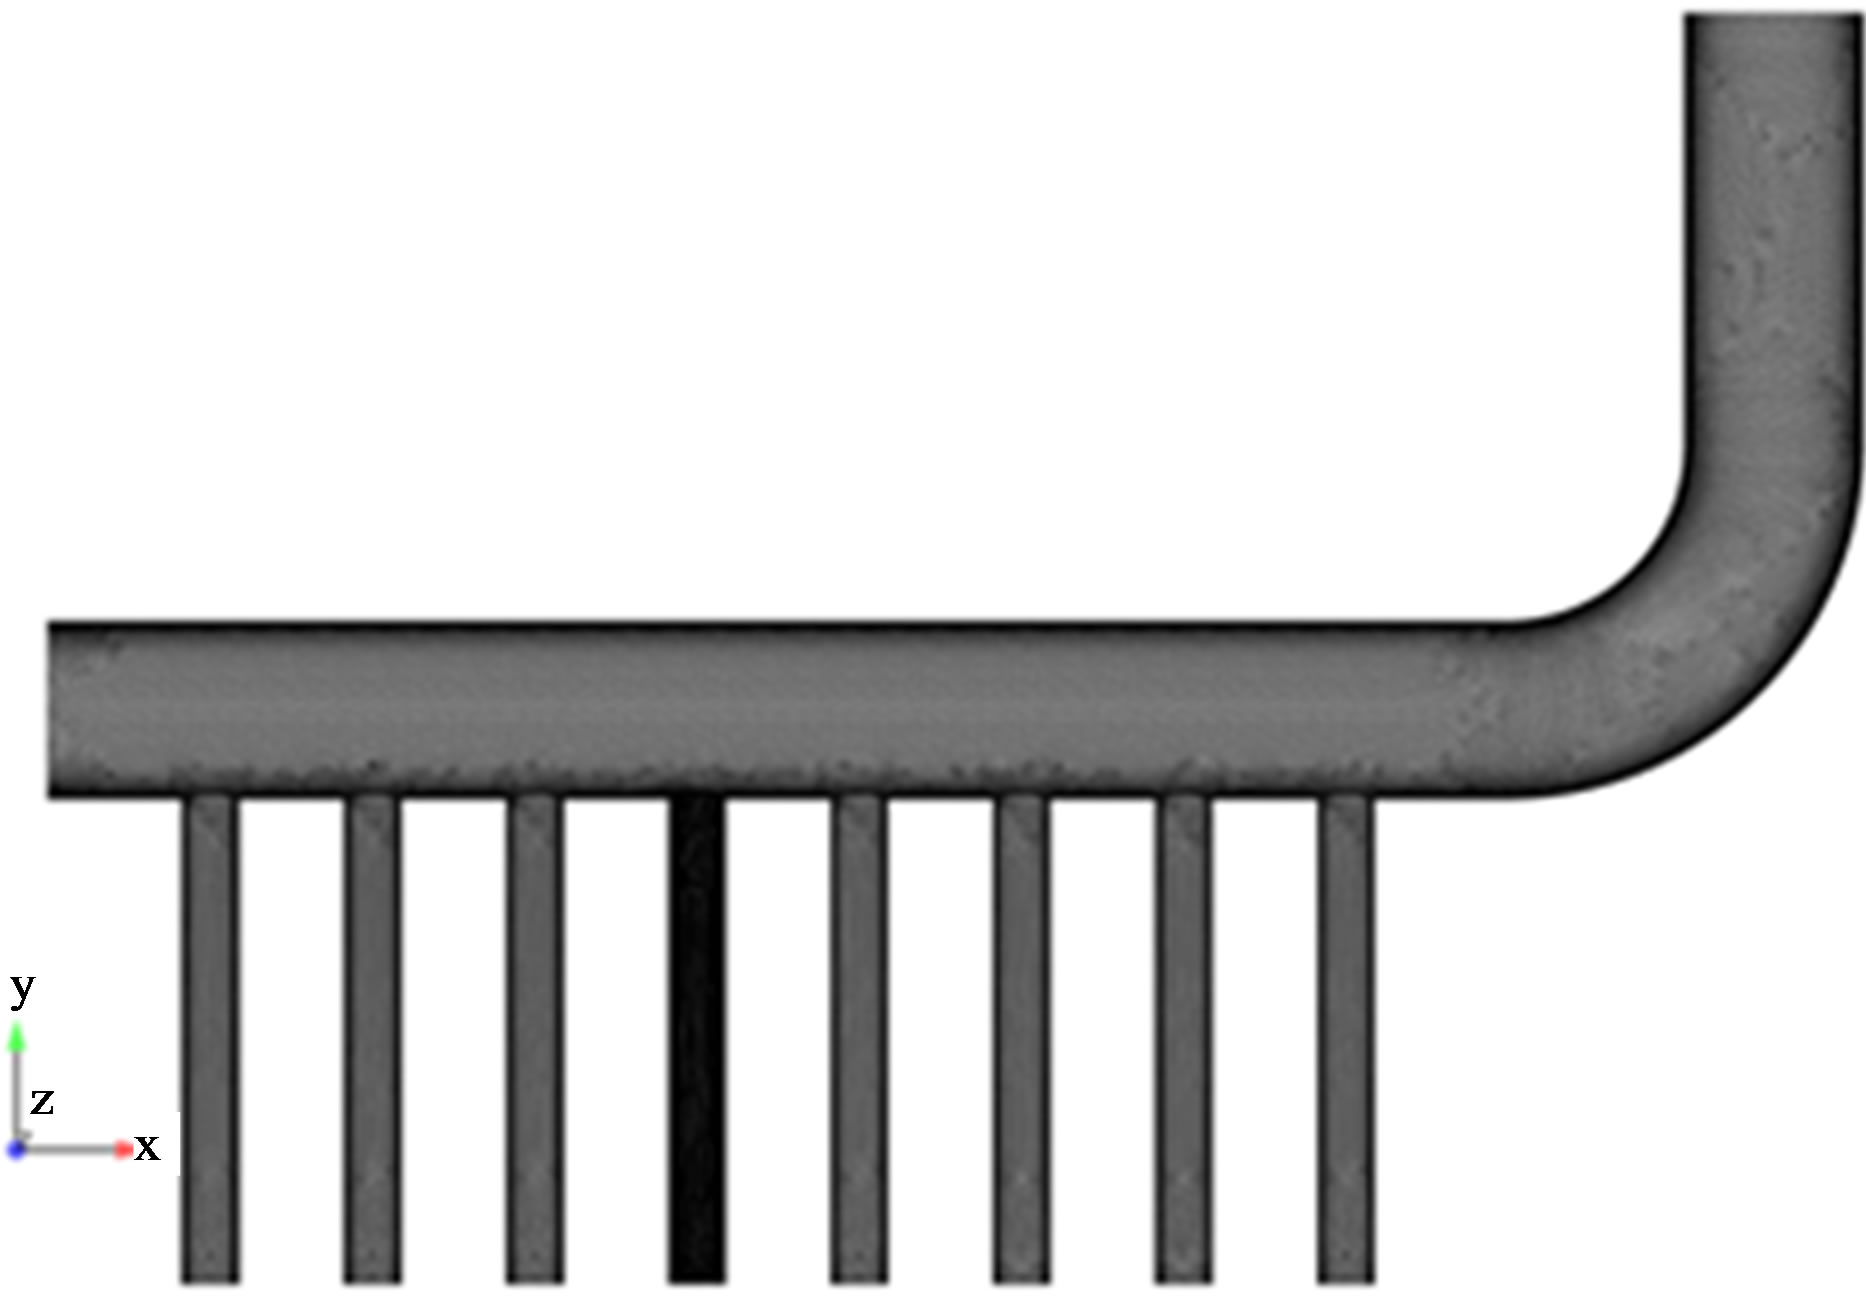
Figure 5. Mesh configuration of Lagrangian and Eulerian models.
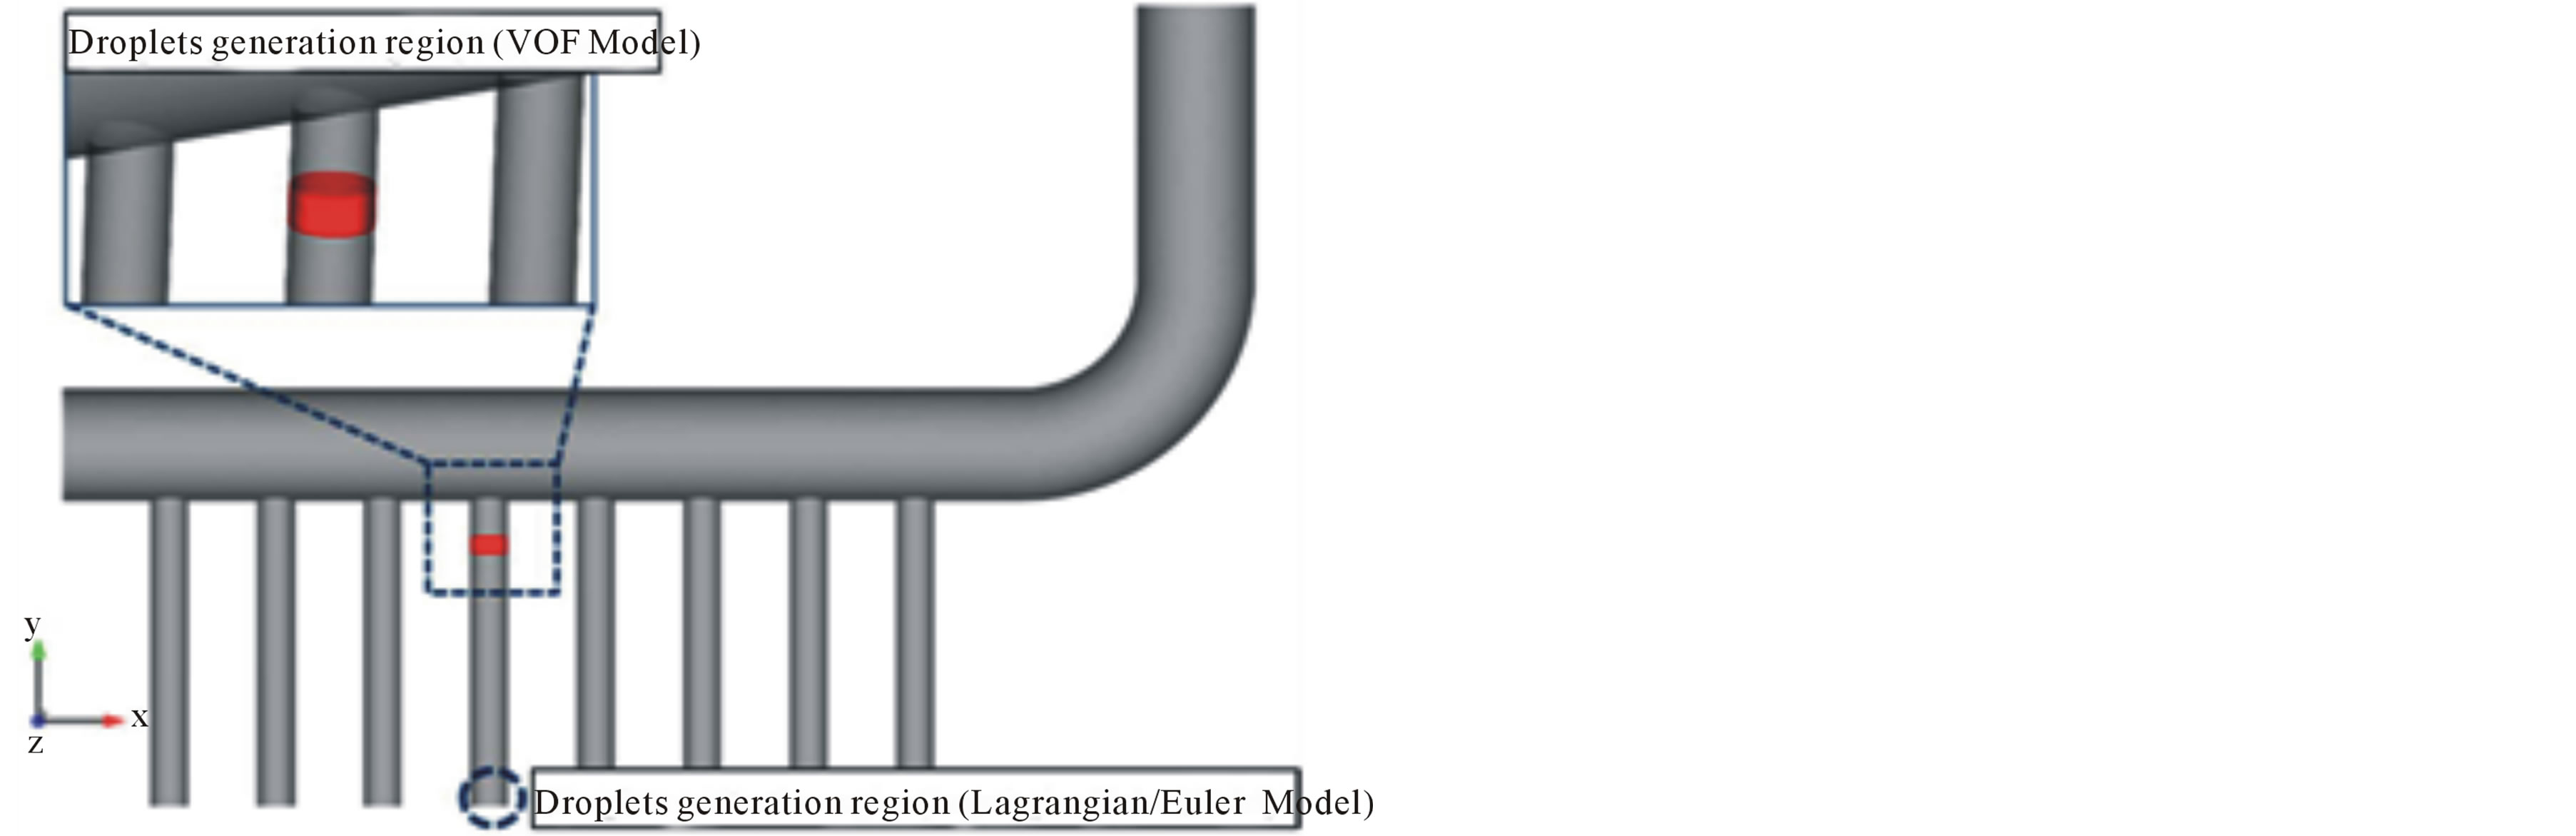
Figure 6. Location of liquid droplet generation.
Lagrangian model and Eulerian model, the droplets of uniformly distributed were generated from the inlet of the vent pipe and the sizes of the droplets were 10 μm, 100 μm, 200 μm, 300 μm, and analyses were performed for each size[5].
Boundary conditions for the analysis were taken from the heat balance diagram for the secondary side of a nuclear power plant and the NFA (Network Flow Analysis) result from CHECWORKS program. The boundary conditions for the analyses are given in Table 1.
4. Analytical Results
4.1. VOF (Volume of Fluid) Model
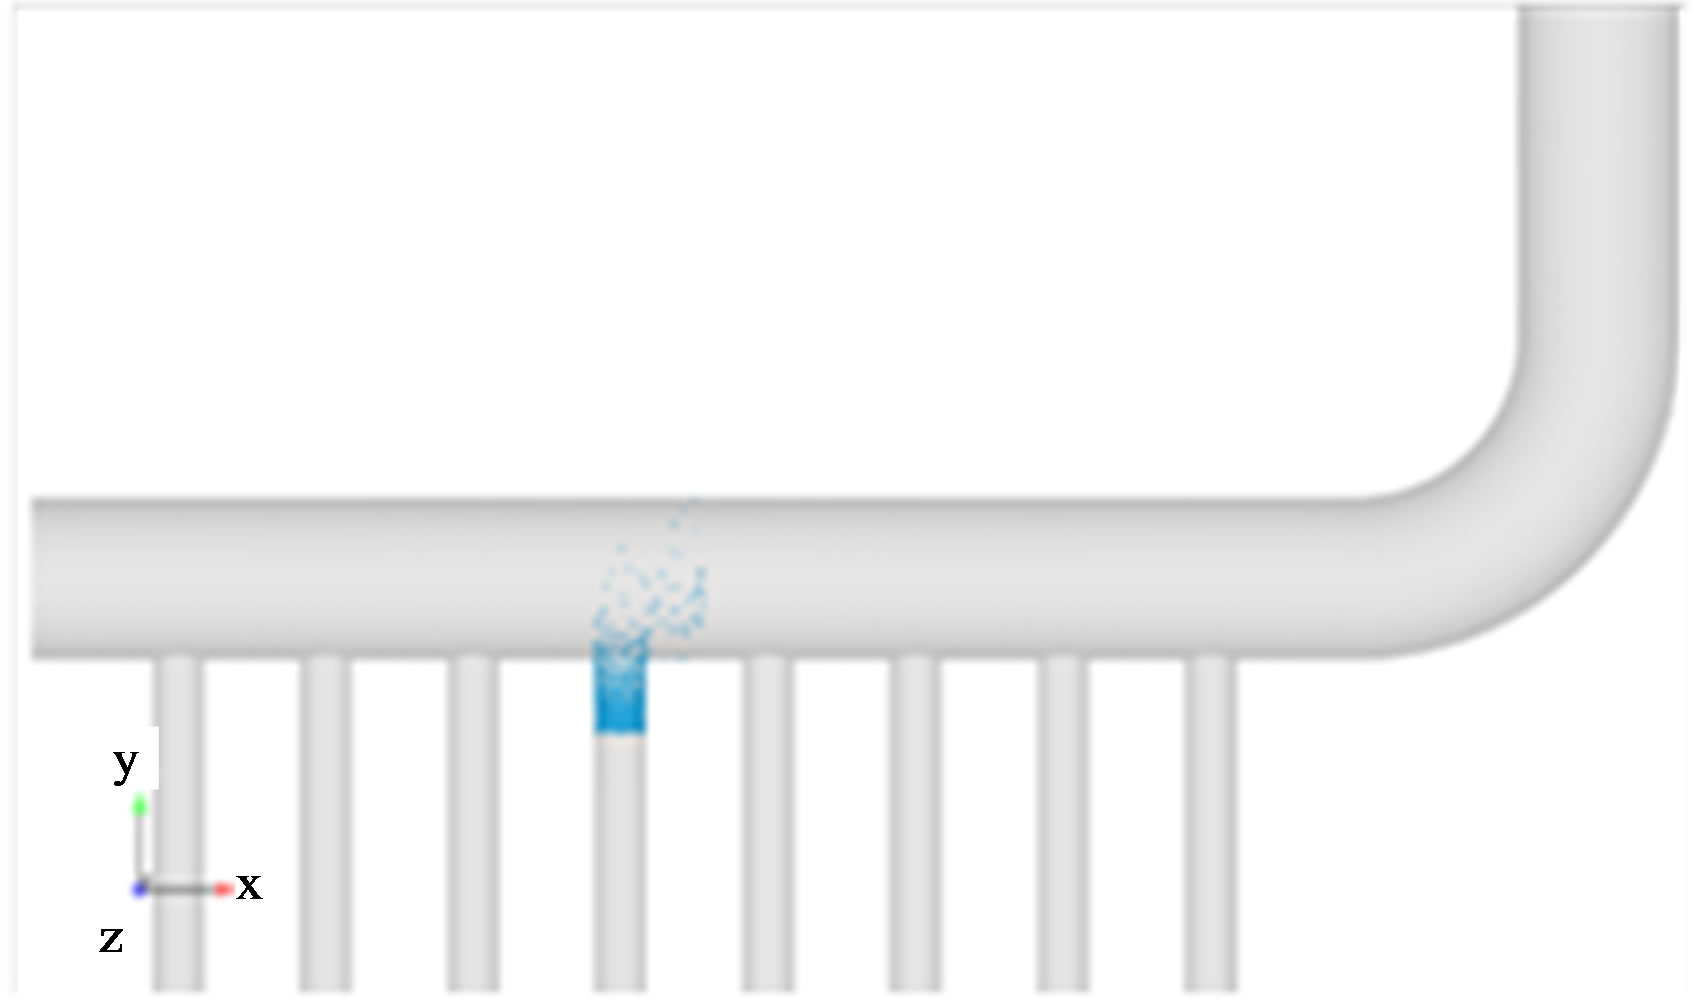
Droplets generated in the form of film on the wall of the vent pipe connected to the feedwater heater are separated from the end of the pipe connected to the header. Separated droplets from the vent pipe flow into the header along the steam flow. Some of the droplets move to the right, downstream along the steam flow and the others hit the wall of the header across the flow of steam. This phenomenon can be found in Figure 7. To explain the wall-thinning effect caused by liquid droplet impingement erosion as shown in Figure 2, so many meshes are needed. However, if computational grids are increased, the analysis time increases exponentially. The analysis based on the VOF model was completed at the level of simulating the dispersion and collision of droplets generated in the vent pipe wall.
4.2. Lagrangian Model
The movement of droplets was analyzed using a Lagrangian model for replicating the symptoms of pipe wallthinning more in details.
The droplets flow through the vent pipe and collide with the wall on the opposite side of the header. The sizes of droplets were assumed as 10 μm, 100 μm, 200 μm, and 300 μm to perform numerical analyses. By performing numerical analyses on the assumption that the droplets have various sizes, it is possible to infer the droplet sizes of wall-thinning occurrence in the piping of power plants.
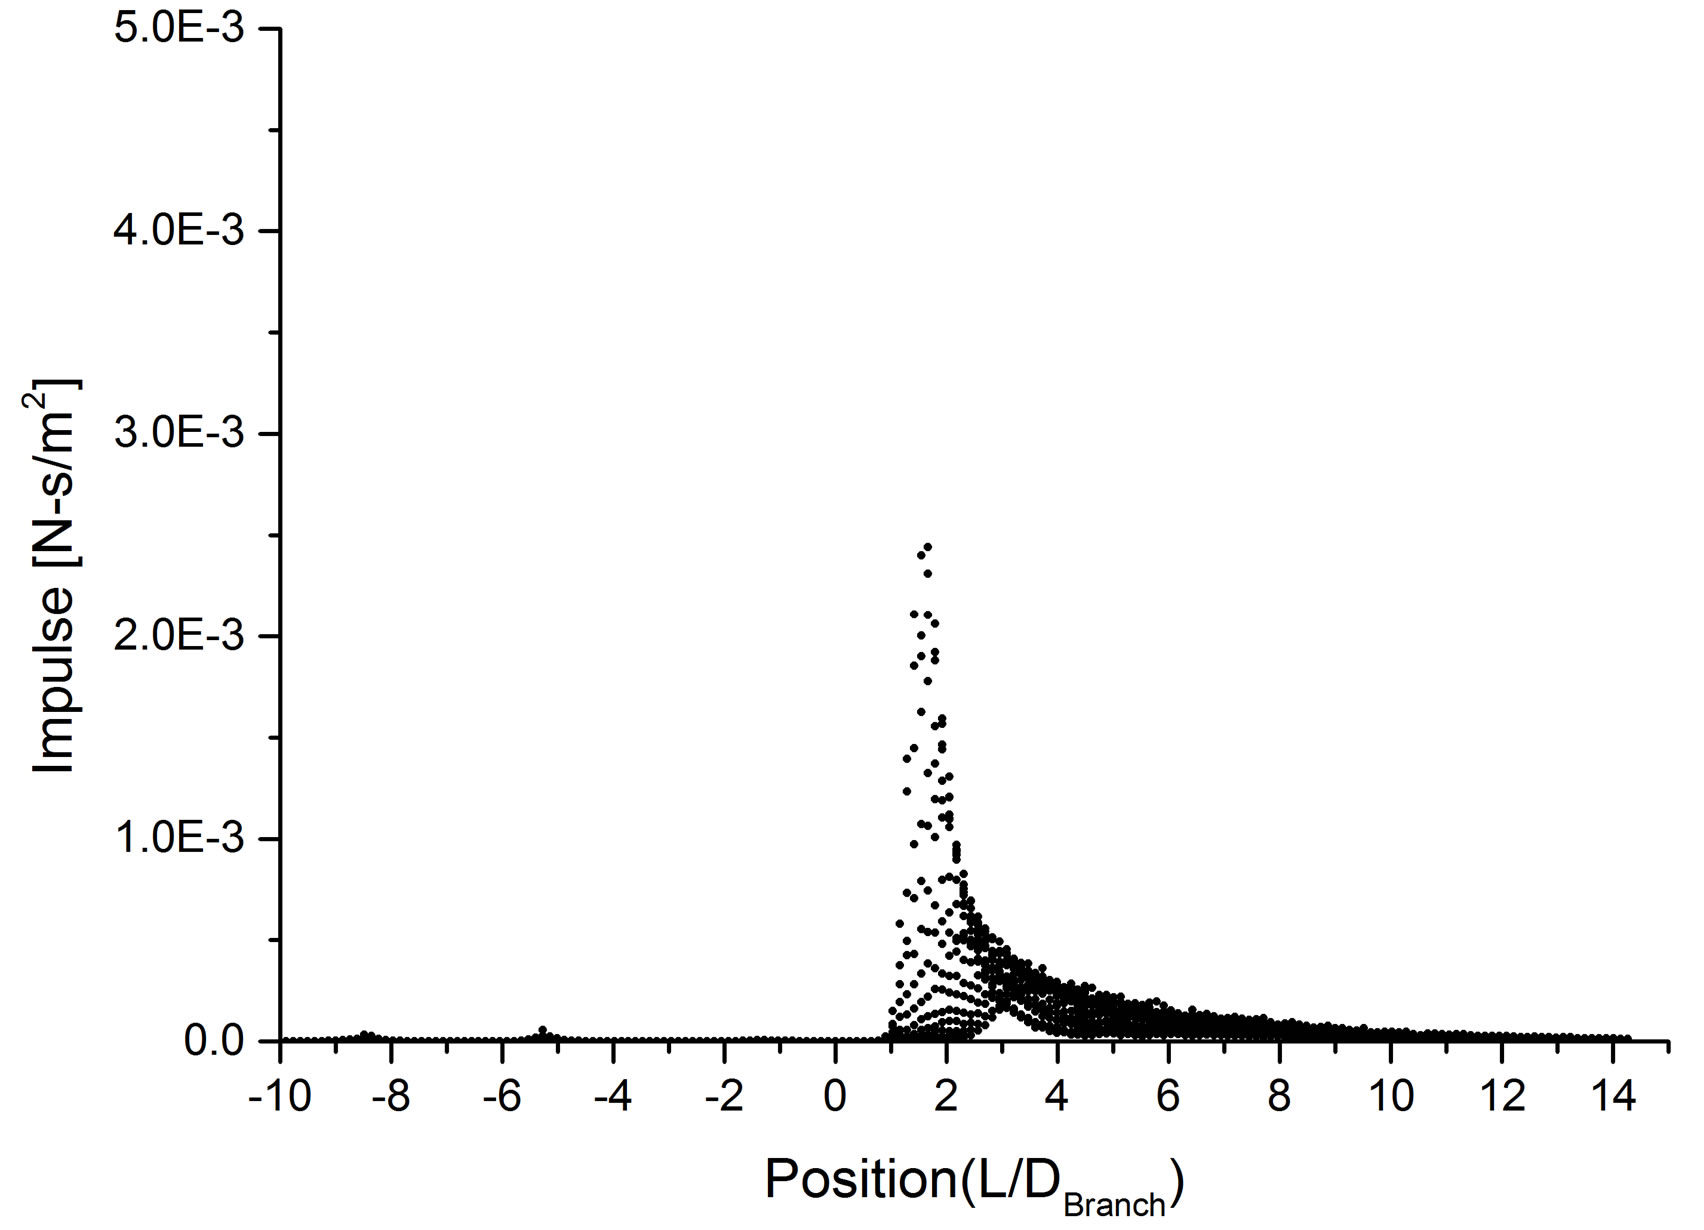
Figure 8 shows the numerical analysis results based on the Lagrangian model. Each figure shows the impulses per unit area on the opposite wall of the vent pipe. The x-axis represents the longitudinal direction of the header,
 (a)
(a)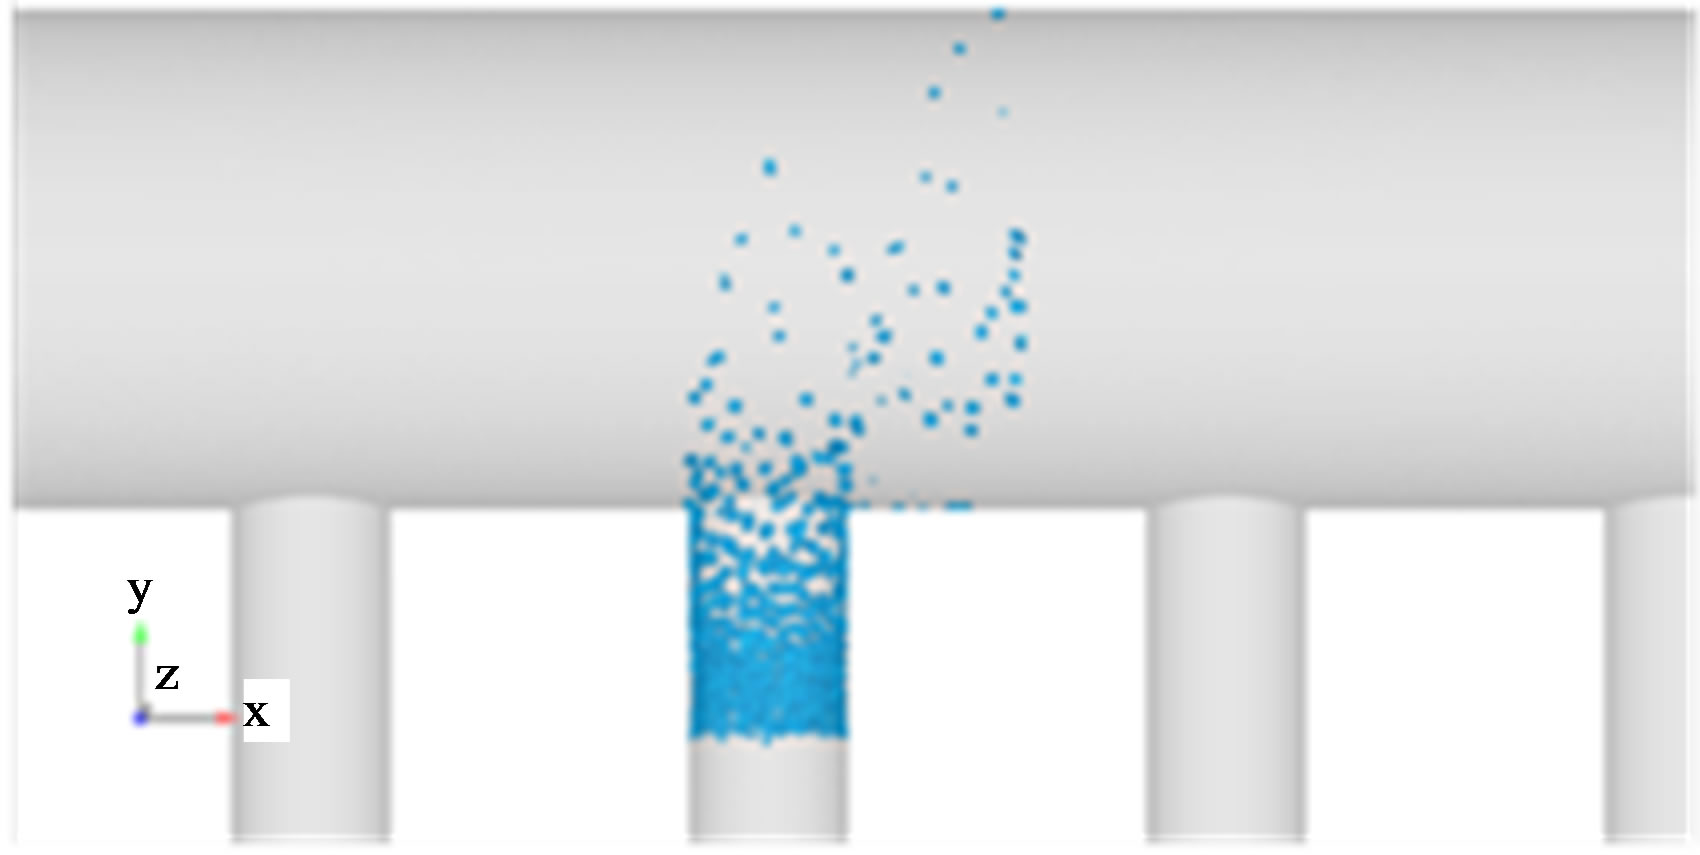 (b)
(b)
Figure 7. Analysis result of VOF model.
 (a)
(a) (b)
(b) (c)
(c) (d)
(d)
Figure 8. Analysis results of Lagrangian model, (a) Distribution for impulse on the pipe wall (10 μm); (b) Distribution for impulse on the pipe wall (100 μm); (c) Distribution for impulse on the pipe wall (200 μm); (d) Distribution for impulse on the pipe wall (300 μm).
while y-axis indicates the radial direction. In the figures, pipe leak occurred around zero point of x and y axis.
In the case of the 10 μm size droplet, it can be confirmed that the magnitude of impulse is small and the tendency to concentrate on a specific region is weak as shown in Figure 8(a).
Figure 8(b) shows the analysis result in the case of the 100 μm size of droplet. In this case, the tendencies of high impulse and concentrating on a specific region were higher than those of 10 μm, but there were some differences in the damage pattern of the leaked pipe.
Figures 8(c) and (d) show the analysis results in the case of the 200 μm and 300 μm size droplets. In these cases, it can be seen that impulses concentrated on a specific region were higher than those of 10 μm and 100 μm as shown in the figures.
Figure 9 shows the velocity distribution of vapor in the central section of the pipe. The velocity distribution of vapor shows a similar trend as shown in Figure 9. In the case of the small size droplets, some of the droplets hit the wall of the header across the flow of vapor and the others flowed downstream along the vapor flow on the end of the vent pipe.
Therefore, it is expected that if the size of the droplet is small, the impact region of the droplets is not centralized on the opposite side wall of the vent pipe but dispersed in a large region.
From the analysis result based on the Lagrangian model, increased size of droplets can increase the possibility of wall-thinning on the opposite side of the vent pipe. Because the inertial force of droplets increases as the droplets size increases.
4.3. Eulerian Model
The analysis was performed using the Eulerian model in order to compare the results based on the numerical analysis methods for LDIE. The sizes of droplets, in common with Lagrangian model, were assumed as 10 μm, 100 μm, 200 μm, and 300 μm. The results of the analysis using the Eulerian model can be reviewed with the analysis results of the Lagrangian model.
Figure 10 shows numerical analysis results of the Eulerian model. Each figure means the impulse per unit area acting on the opposite wall of the vent pipe. The x-axis represents the longitudinal direction of the header. In the figures, leak occurred around zero point of x axis.
Figures 10(a) and (b) show the analysis results in the cases of the 10 μm and 100 μm sizes of droplets. In these cases, it can be confirmed that the magnitude of impulse was small and the droplets were concentrated on the right side of zero point. These phenomena were due to the effect by the inertial force of steam flow in the header rather than that of small droplet flow in the vent pipe.
Figures 10(c) and (d) show the magnitude of impulse in the cases of the 200 μm and 300 μm sizes droplets. In these cases, it can be seen that impulses concentrated on the leaked wall of the header were higher than the results of 10 μm and 100 μm as shown in the figures. As the droplet sizes increased, it can be seen that the impulse
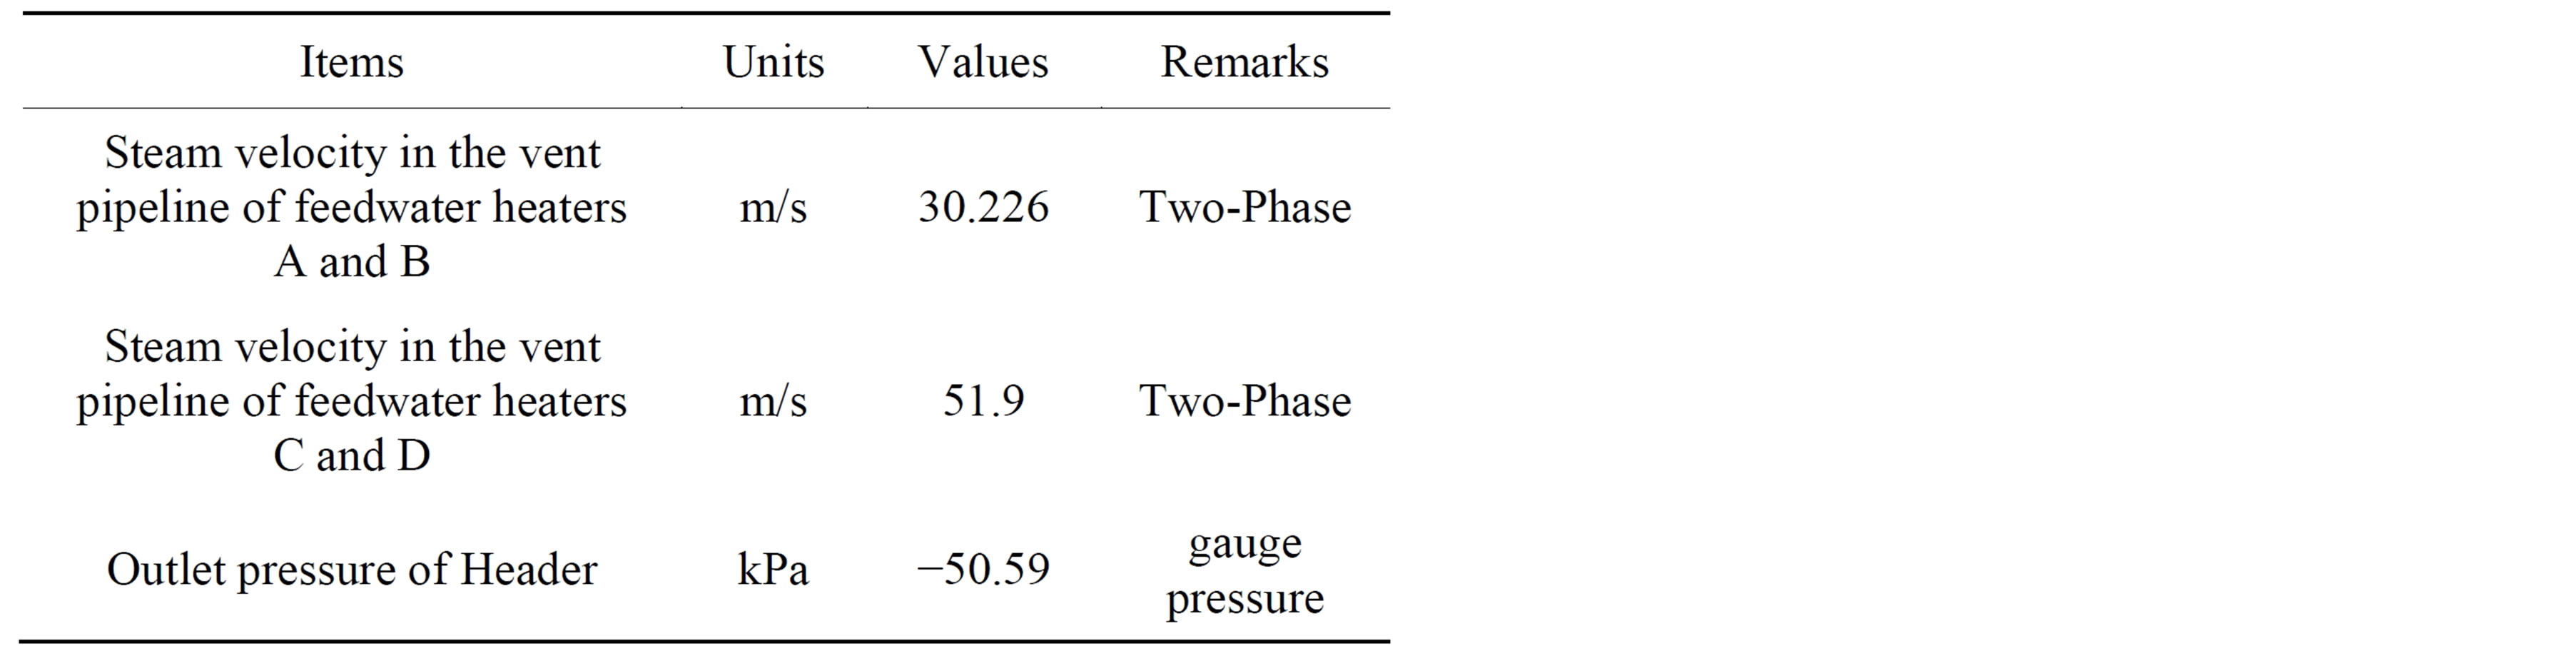
Table 1. Boundary conditions.
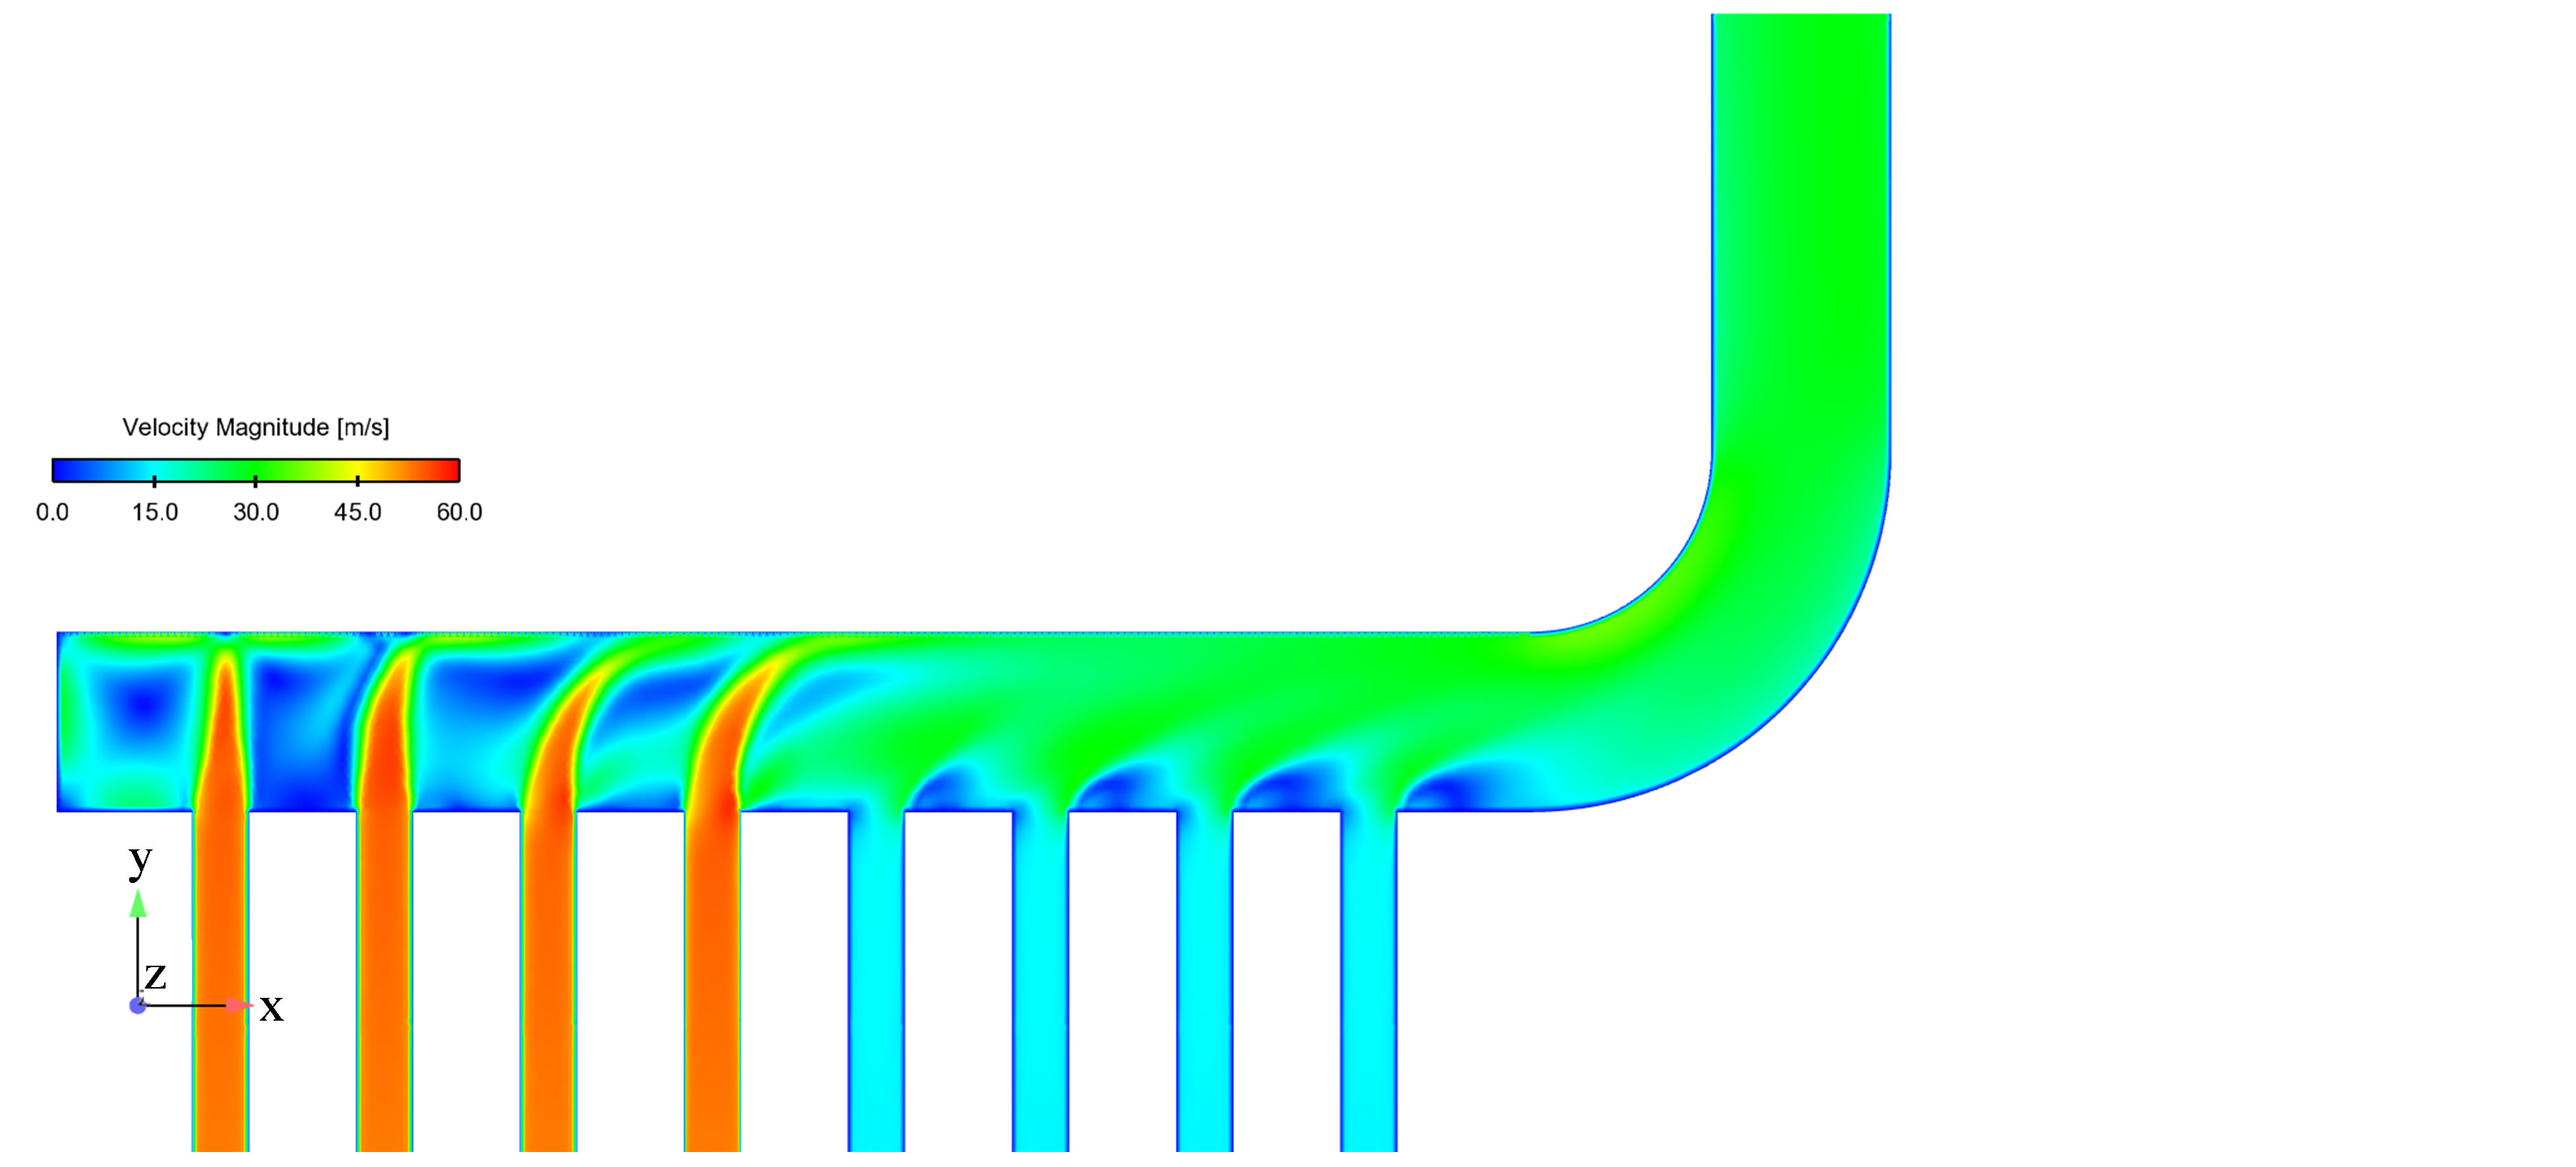
Figure 9. Distribution for steam velocity.
 (a)
(a)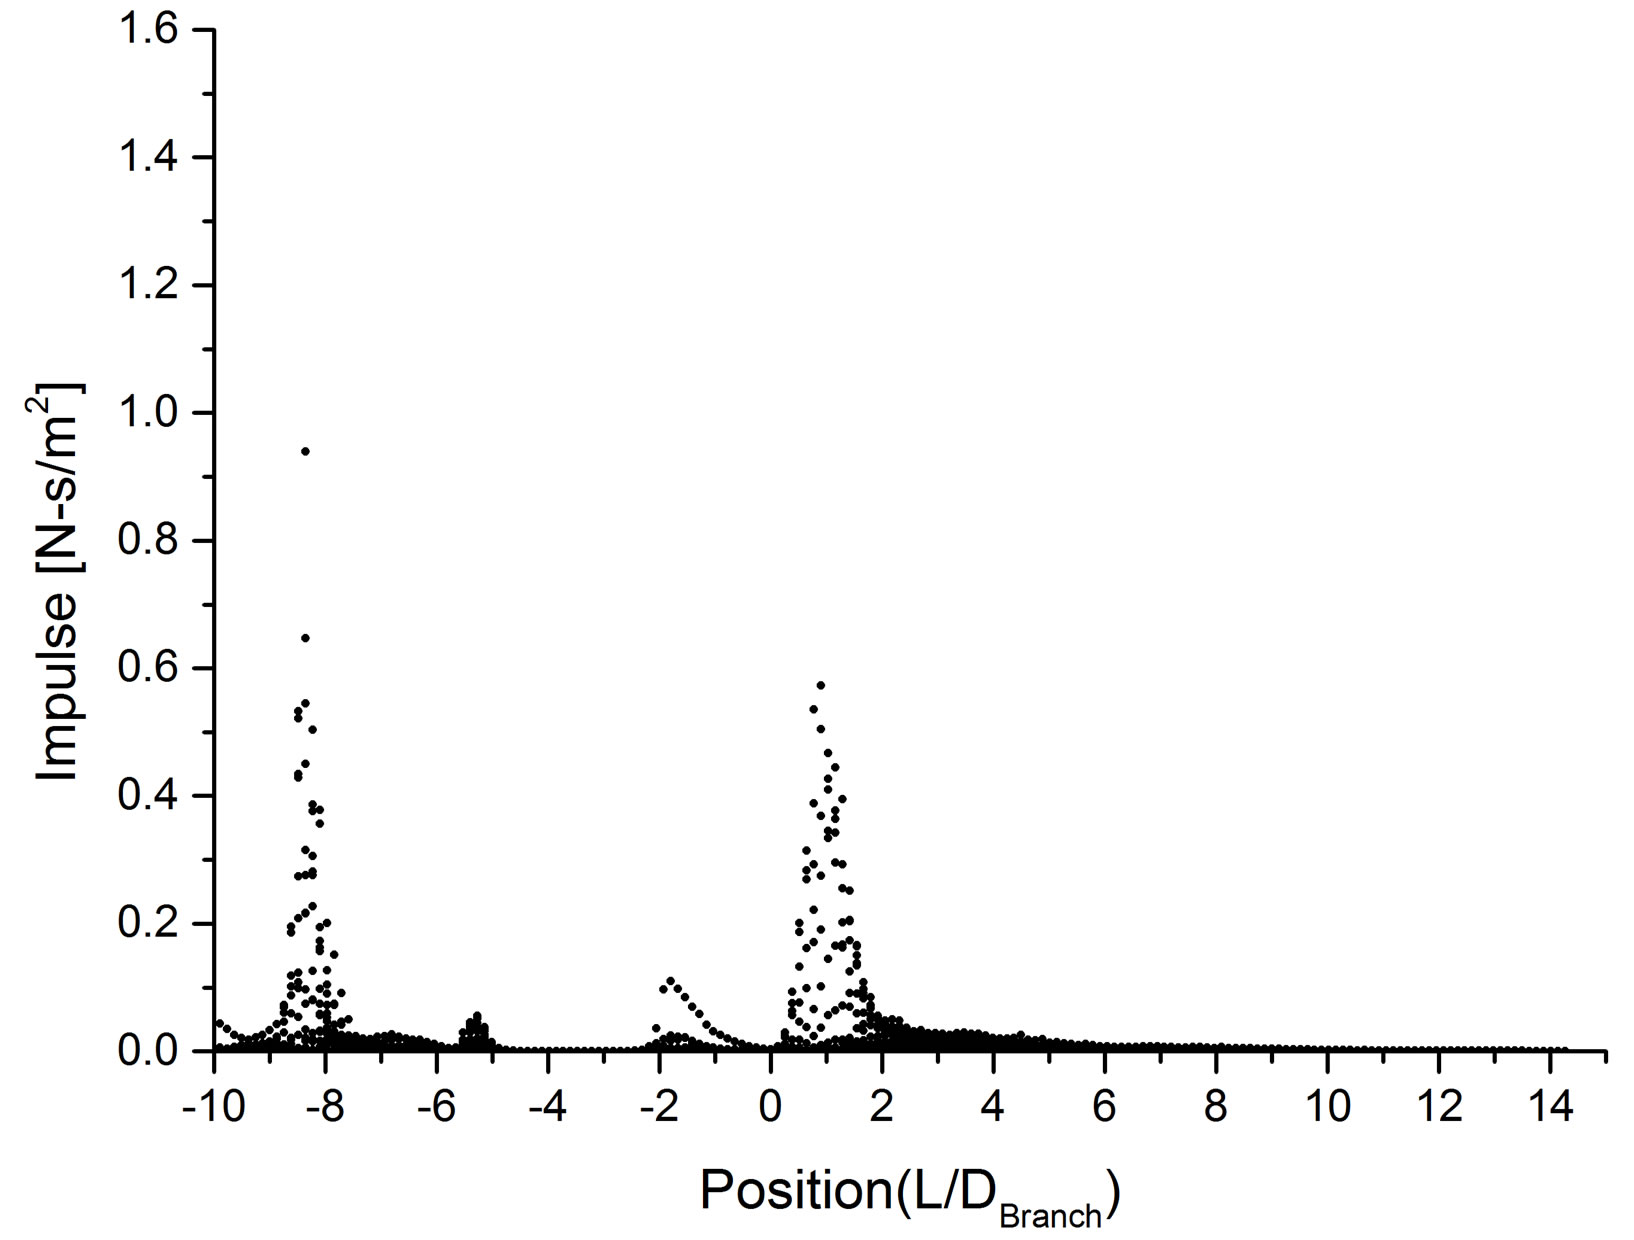 (b)
(b) (c)
(c) (d)
(d)
Figure 10. Analysis result of Eulerian model, (a) Distribution for impulse (10 μm); (b) Distribution for impulse (100 μm); (c) Distribution for impulse (200 μm); (d) Distribution for impulse (300 μm).
occurred on the various regions, and the various regions of header were damaged by fluid inflowing from the other vent pipe. These phenomena can also be identified from the inspection result with naked eye view on the leaked pipe.
5. Conclusions
In August 2008, the header pipe in the high pressure feedwater heater vent system leaked at a Korean nuclear power plant. After cutting the pipe during refueling outage, it was identified that the leak was due to LDIE. In order to identify the cause of the LDIE, the numerical analyses were performed by using multi-phase model for various sizes of droplets.
From the results of numerical analysis, the effect of the generated droplets from the vent pipe and the cause of wall-thinning were identified. As a result, LDIE that occurred in the header was caused by inflowing twophase fluid from the vent pipe of the feedwater heater.
In view of numerical analysis methodology, the VOF model produces analysis results easier for its interpretation. But many grids are required for the detailed analysis. But from the numerical analysis results using the Eulerian model and Lagrangian model, it was identified that the size of the droplets generating erosion in the header is about 200 μm, and it accurately predicts the actual leak region by LDIE. In addition, it was able to confirm that the damage was also progressing to other regions besides the leaked region. Therefore, these reports may be used to predict LDIE on the similar pipelines of other power plants.
REFERENCES
- K. M. Hwang and H. Yun, “Investigation on the Evaluation for Liquid Droplet Impingement Erosion through Prediction Model and Experiment,” Journal of Manufacturing Science and Technology, B (Korean), Vol. 35, 2011, pp. 1105-1110.
- H. K. Seo and K. M. Hwang, “Numerical Analysis Study to Identify the Leak Cause of a Feedwater Heater Vent Pipe in a CANDU Plant,” 7th NCFE, Korea, 2012.
- ANSYS, Inc., “ANSYS FLUENT Theory Guide,” Release 13.0, 2010.
- ANSYS, Inc., “ANSYS FLUENT User’s Guide,” Release 13.0, 2010.
- R. Li, H. Ninokata and M. Mori, “Parametric Investigation on the Effect Factors for Liquid Droplet Impingement Erosion,” Proceeding of AJK Joint Fluids Engineering Conference, AJK2011-03034, Japan, p.7. 2011,