World Journal of Nuclear Science and Technology
Vol.3 No.1(2013), Article ID:27524,5 pages DOI:10.4236/wjnst.2013.31005
Dose Rate Calculation in the Vicinity of the Tunisian Gamma Irradiation
Département de Physique, Faculté des Sciences de Monastir, Université de Monastir, Monastir, Tunisia
Email: *elassaad_fsm@yahoo.fr
Received November 4, 2012; revised December 6, 2012; accepted December 27, 2012
Keywords: Dose Rate; 60Co Gamma Source; GEANT4
ABSTRACT
Dose rates calculations, in PMMA dosimeters, placed in the vicinity of the Tunisian 60Co gamma ray irradiator, have been achieved using a pencil like model. The obtained results are in good agreement with recent experimental data. Moreover, in this work we determine also the conversion factor between the dose rate deposited in a PMMA dosimeter and the one deposited in a reel medium. This factor is used to determine the dose deposited in a real irradiated medium such as foodstuff products.
1. Introduction
Many authors have calculated dose rates for various sources geometries such as a cylindrical source [1] and a linear source [2-4]. These authors calculated the dose rate, at an arbitrary point in a given infinite medium, essentially air. In these calculations, the dose rate is proportional to the photon flux. The proportionality constant is equal to the gamma rate exposure and the energy loss is equal to the photon energy. In the present work, we will not calculate the dose rate in any point on the infinite medium but we calculate the dose rate deposited in a PMMA dosimeter [5] used in the experience and placed in a given direction from the source. However, the obtained results have been compared with recent experimental data. The advantage of this work is the possibility, to obtain a dose rate in each dosimeter position, using a straightforward calculation.
2. Materials and Methods
The irradiator of the Tunisian National Center for Nuclear Sciences and Technologies (CNSTN) is designed for medical devices sterilisation and foodstuff preservation [6]. It is built of eight 60Co pencils, each of 45 cm height and 1 cm diameter. The pencils are arranged around the Z-axis in two levels. The overall height of the irradiator is 90 cm, with a mean radial extension of about 6 cm. In a previous work [7], we showed that this irradiator can be simulated by a single pencil of equal height and equal activity placed along the Z-axis.
Gharbi et al. [8] selected 29 positions, with a 10 cm step, parallel to the Z axis, at a constant distance X = 150 cm from this axis. Dose measurements were carried out using PMMA dosimeters which are oriented perpendicularly to the X-axis (Figure 1). In order to increase the dosimeter thickness, the authors superposed three films at each position. The films have a parallelepipedic shape: 3 cm long by 1 cm large and 3 mm thick.
3. Dose Rate Calculation
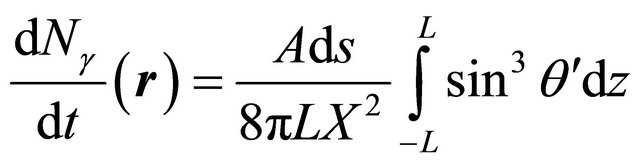
The gamma rate generated by a pencil-like gamma source of a length 2L and activity A, intercepting a dosimeter placed at a point M such us OM = r, is given by [7]:
 (3-1)
(3-1)
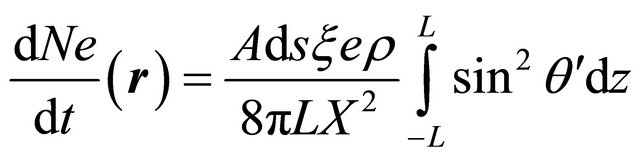
The air attenuation factor of the photon flux is equal to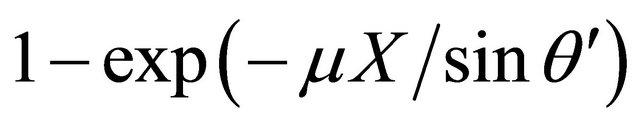 . Given that, X = 150 cm and μ = 6.8 × 10⁻⁵ cm−1 [9], the air attenuation contribution is clearly negligible (about 1%). Therefore, the number of free electrons per unit time generated in the dosimeter is given by:
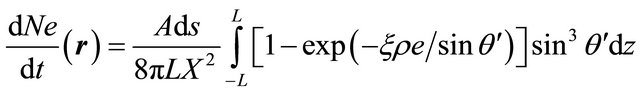 (3-2)
(3-2)
where ξ = 0.061 cm2/g [9] is the photon mass attenuation coefficient, ρ = 1.19 g/cm3 is the PMMA density [9] and e = 3 × 0.3 cm is the dosimeter thickness which corresponding to a mass thickness m = 1.07 g/cm2.
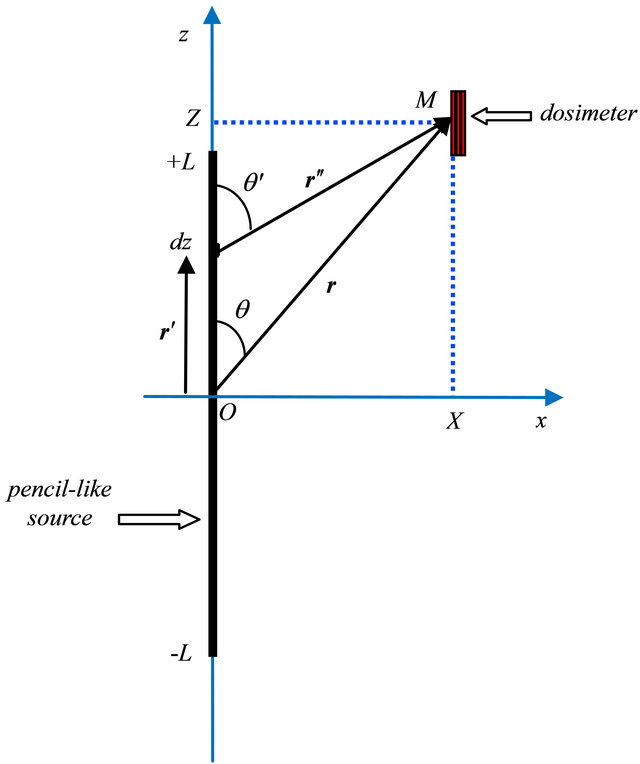
Figure 1. Positions of the source and the dosimeter films.
Since , the photon interaction probability ξ, ρe is small (0.065), the development of Equation (3-2) to the first order gives:
 . (3-3)
The dose rate is equal to the electrons rate multiplied by the mean energy deposited by each electron in the dosimeter. At  (the mean energy of the two 60Co photons), Compton scattering is predominant and the forward electron energy is E0 = 1.03 MeV having a range R = 0.45 g/cm2 [9] in the PMMA. In order to calculate the energy deposited in the dosimeter, two cases will be treated.
3.1. Front End Region
If a Compton electron is produced in the dosimeter front end region, equal to , the electron energy loss is equal to
 , where
  is the mean Compton electron energy:
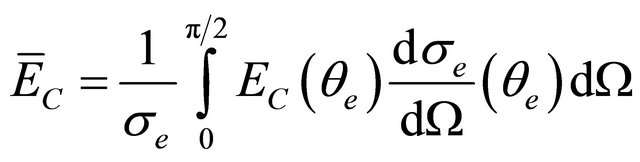 (3-1-1)
where  is the electron kinetic energy at a given angle
  and
and  is the Compton differential cross section.
After integration, we obtain .
.
Consequently, the dose rate in the dosimeter is given by:
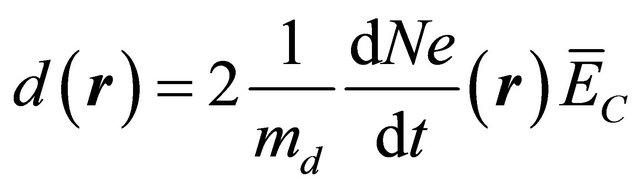 , (3-1-2)
where the factor 2 corresponds to the two 60Co photons and md = ρeds is the dosimeter mass.
Thus:
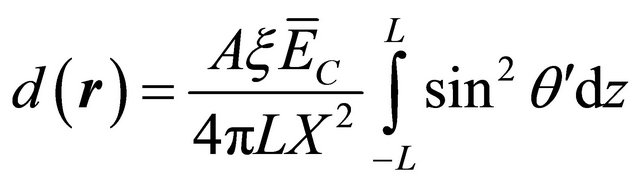 . (3-1-3)
After integration, we have:
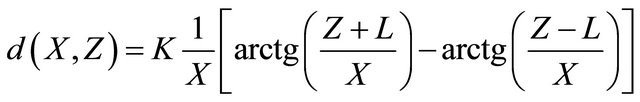 , (3-1-4)
where:  is a constant. In our case A = 1.81 ±
0.18 PBq [8] and L = 45 cm, we obtain K = 660 Gy m/h.
We obtain the same expression found by Huttlin [4], for a linear source of length 2L. However the two constants K and f are not equal, precisely
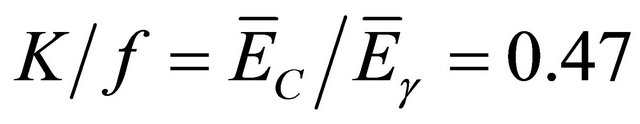 .
.
3.2. Back End Region
If a Compton electron is produced in the dosimeter back end of a mass thickness equal to R, this electron will lose only a fraction of its kinetic energy. Therefore, the electron mean energy loss in the dosimeter, is no more equal to , but to
  given by:
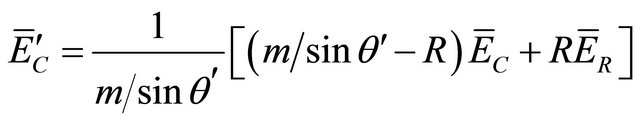 which is equivalent to:
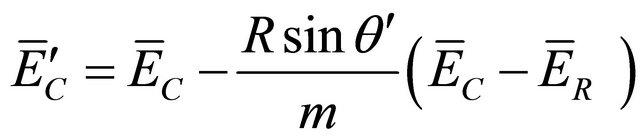 , (3-2-1)
where  is the mean energy loss of escaping electrons.
The dose rate is then:
 , (3-2-2)
After integration, we obtain:
 (3-2-3)
where  is given by:
 , (3-2-4)
is the correction factor due to escaping electrons.
The constant 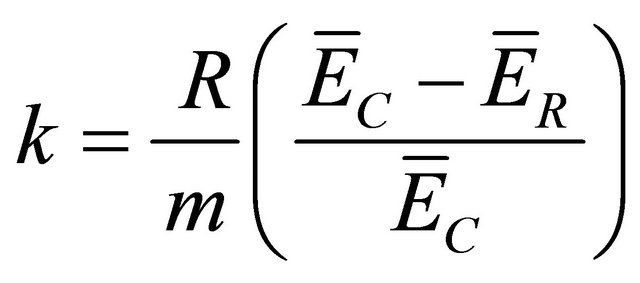 is determined by estimating
 .
.
3.2.1. Energy Loss of Escaping Electron
The mean energy loss of escaping electrons is given by:
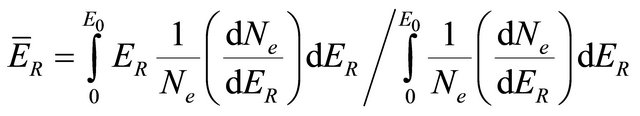
where  is the probability distribution.
  is the electrons rate per unit mass such as:
  and
and  is the energy loss of escaping electrons per unit mass.
Since in our case , we can write
 , thus
 .
.
Therefore, we can write:
 . (3-2-5)
Now, we use the approximation: , where a is a constant and E is the electron energy.
Given that , where
  is the forward Compton electron energy and
  is the energy loss of escaping electron, thus we have:
 . (3-2-6)
Finally, we obtain:
 . (3-2-7)
By injecting Equation (3-2-14) in Equation (3-2-8), we find:
 . (3-2-8)
3.2.2. Simulation
To check the validity of Equation (3-2-13), it is equivalent to show Equation (3-2-14). To determinate the constant a, we integrate Equation (3-2-14) and we find
 .
.
Finally Equation (3-2-14) can be written as:
 . (3-2-9)
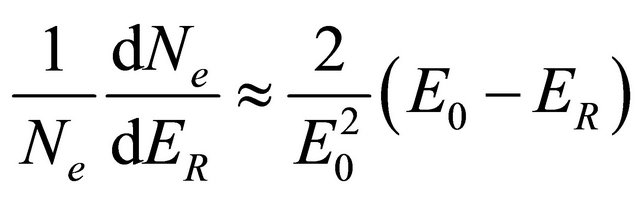
To validate this equation, we used the GEANT4 Monte Carlo code. The irradiator is simulated by a single pencil of a 90 cm length (Figure 1). A PMMA film with a mass thickness equal to the range R of the forward electron is placed at 150 cm from the center of the source. Figure 2
shows the obtained probability distribution  as a function of the escaping electron energy loss. The fit of the obtained distribution by Equation (3-2-9) gives a good mean squared error
 .
.
3.3. Conversion Factor
To determine the dose rate dmed in a very thick medium from the dose rate ddos measured using a PMMA dosimeter we write:
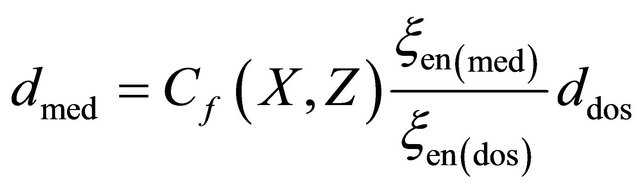 , (3-3-1)
where 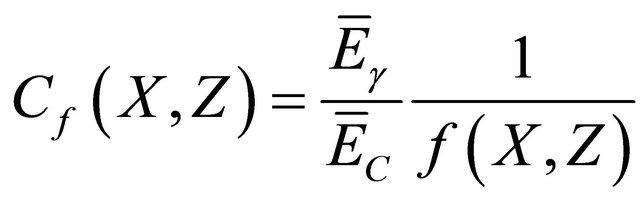 is the conversion factor.
Usually, the length L is small relatively to the distance r, in our case L = 45 cm and X = 150 cm.
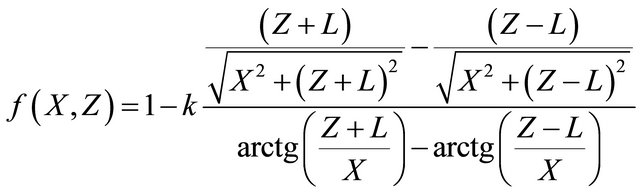
Therefore, the correction factor becomes:
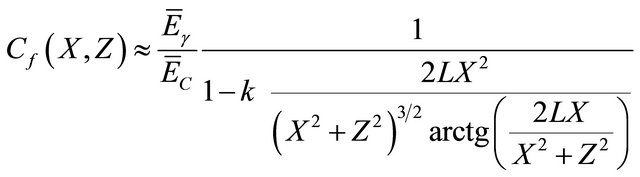 . (3-3-2)
Given that:
 ,
,  ,
,  , R = 0.45 g/cm2 and m = 1.07 g/cm2.
so k = 0.178, then for Z = 0, we obtain: Cf = 2.62.
This means that the measured dose rate is only about 38% of the dose rate that will be deposited in an infinite medium. Figure 3 shows the curve of the conversion factor as a function of dosimeter position.
4. Results
The comparison between the calculated and the experimental dose rates is shown in Figure 4. Given that the uncertainty on the source activity is about 10% [8], the distribution of the experimental data and the theoretical curve show a very good agreement which is a proof of the validity of the calculation. The conversion factor between
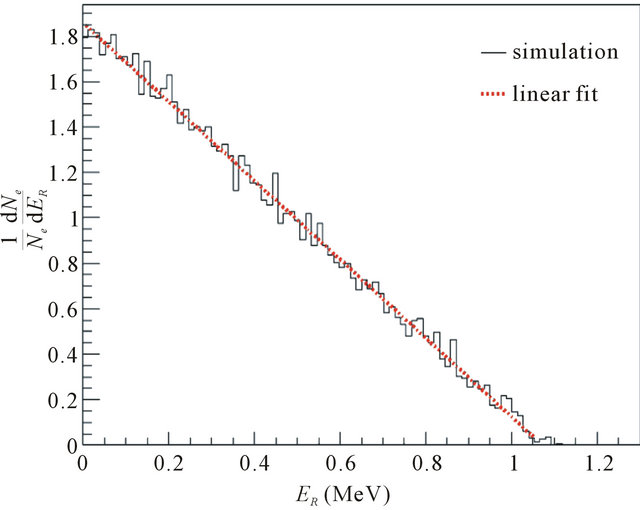
Figure 2. The distribution  as function of the electron energy loss ER.
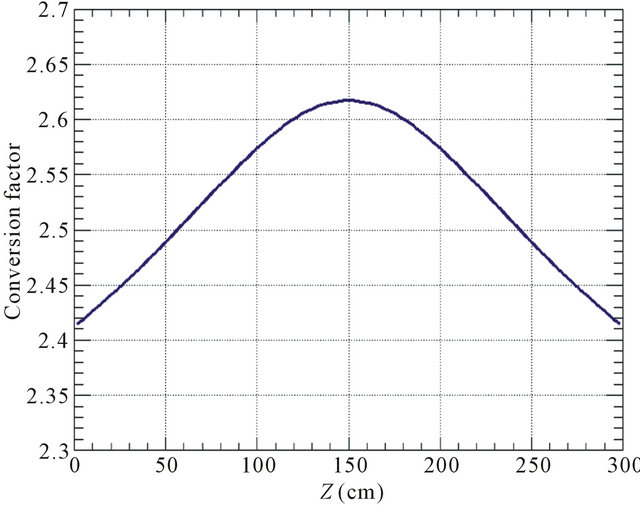
Figure 3. Conversion factor as a function of the dosimeter position.
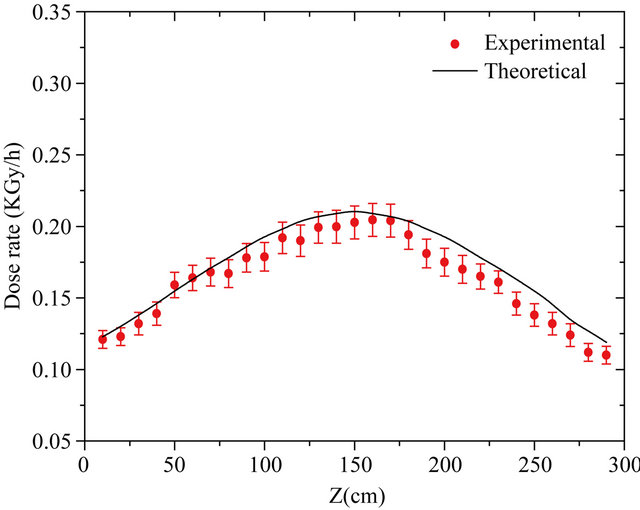
Figure 4. Calculated and experimental dose rates.
the dose rates in a given thick medium using the one measured by a PMMA dosimeter can be very useful, for instance, when commissioning a similar irradiation facility.
5. Discussion
The authors of reference [8] have determined the dose rate by simulating the dosimeters with spheres of 8 cm diameter filled with water. The mass thickness of the sphere is more than 20 times the range of the forward Compton electrons. Then, the multiple scattering is not negligible and the electron energy loss in such spheres is higher than in the dosimeter case. Consequently, the escaping effect has then been neglected, which is not the case, in PMMA dosimeters. The same authors find a too good agreement between their simulation and the data, which is questionable. It seems that, their simulation is not absolute but relative to the dosimeter placed at Z = 0. Finally, if the simulation is necessary to check or validate some calculations, we see no reason for not using the real dosimeter geometry in order to obtain an absolute result.
6. Conclusion
In conclusion, using a relatively simple calculation, we are able, to determine the dose rates in the vicinity of the CNSTN 60Co irradiator. The agreement between our calculation and the experimental data is satisfactory. We have also shown that the escaping effect, in a PMMA dosimeter, is not negligible relatively to the spheres used by some references authors. Finally, the conversion factor and the dose rates calculated in such dosimeters can be used to obtain the dose rates deposited in a real medium.
REFERENCES
- M. Contineanu, S. Perisanu and A. Neacsu, “Calculation of the Dose Rate in an External Point of a Cylindrical Gamma Radioactive Source,” Anatele Universitatti di Bucuresti—Chimi (Serie Noua), Vol. 19, No. 1, 2010, pp. 69-77.
- J. J. Fletcher, G. Emi-Renolds and E. T. Glover, “Shielding Calculations for Changing from Circular to a Rectangular Source Configuration for a Pilot Scale Irradiator,” Journal of Applied Science and Technology, Vol. 5, No. 1-2, 2000, pp. 39-40.
- G. Z. Gochaliev, “Calculation of the Average Dose Rate for Linear Gamma-Radiation Sources,” High Energy Chemistry, Vol. 44, No. 6, 2010, p. 539. doi:10.1134/S0018143910060147
- G. A. Huttlin, “Analytical 60Co Dose-Rate Contours Maps,” Army Research Laboratory, Adelphi, MD, ARLMR-324, 1996.
- www.harwell-dosimeters.co.uk/specifications
- A. Loussaief, A. Trabelsi and B. Baccari, “Extended Gamma Sources Modelling Using Multipole Expansion: Application to the Tunisian Gamma Source Load Planning,” Radiation Physics and Chemistry, Vol. 75, No. 4, 2006, pp. 463-472. doi:10.1016/j.radphyschem.2005.12.024
- E. Jemii, M. Mazouz, A. B. Fredj, et al., “Modeling of the Tunisian 60Co Gamma Irradiator by a Coaxial Equal Height and Equal Activity Single Pencil,” Radiation Physics and Chemistry, Vol. 80, No. 11, 2011, pp. 1158- 1161. doi:10.1016/j.radphyschem.2011.05.003
- F. Gharbi, O. Kadri, K. Farah, et al., “Validation of Geant Code as Predictive Tool of Dose Rate Measurement in the Tunisian Gamma Irradiation Facility,” Radiation Physics and Chemistry, Vol. 74, No. 2, 2005, pp. 102-110. doi:10.1016/j.radphyschem.2005.02.006
- www.physics.nist.gov/pml/data
NOTES
*Corresponding author.