World Journal of Nuclear Science and Technology
Vol.2 No.1(2012), Article ID:17038,7 pages DOI:10.4236/wjnst.2012.21005
Experimental Base of an Innovation S-Channel to Reduce MHD Pressure Drop*
Southwestern Institute of Physics, Chengdu, China
Email: xuzy@swip.ac.cn
Received October 6, 2011; revised November 19, 2011; accepted December 21, 2011
Keywords: Liquid Metal Blanket; MHD Effect; Pressure Drop; S-Channel
ABSTRACT
Consequent on MHD geometry sensibility phenomena was measured in an accident case; the more detail experiments have been conducted at the liquid metal experimental loop upgrade facility (LMEL-U). The experimental results indicate that MHD pressure drop can be greatly reduced in the special designed ducts. Base on the experimental data, an innovation channel concept (tentatively called as the secondary flow channel, short in “S-channel”) is addressed as a reducing MHD pressure drop channel for the application of a liquid metal blanket system in fusion reactor. It may be a dawn for solving MHD pressure drop key issue of liquid metal blanket system.
1. Introduction
As known, liquid metal blanket concepts are still attractive ITER (International Thermonuclear Experimental Reactor) and DEMO (Demonstration fusion plant) blanket candidates as they have low operating pressure, simplicity, and a convenient tritium breeding cycle. While conducting an experimental investigation of MHD effect of the flow channel inserts (FCI) for liquid metal blanket system in ITER or DEMO potential application, some MHD geometry sensibility phenomena were measured in accident case [1], and the MHD geometry sensibility phenomena (or called the secondary flow MHD effect, short in “S-MHD” effect) is successfully used to understand FCI duct flow MHD behaviors [2,3], and the experimenttal results of FCI flow indicate that the problem how to reduce the MHD pressure drop and meet the heat transferred requirement still remain key issues. As well as, up to now, it is very little about the secondary flow knowledge. To understand the secondary flow MHD effect and to try to use the effect to reduce MHD pressure drop, four special design experiments are performed at the liquid metal experimental loop upgrade facility (see Figure 1) in southwestern institute of physics, China.
2. Experimental Description
Before we state the detail of the special design experiments, we review the MHD geometry sensibility phenomena (see
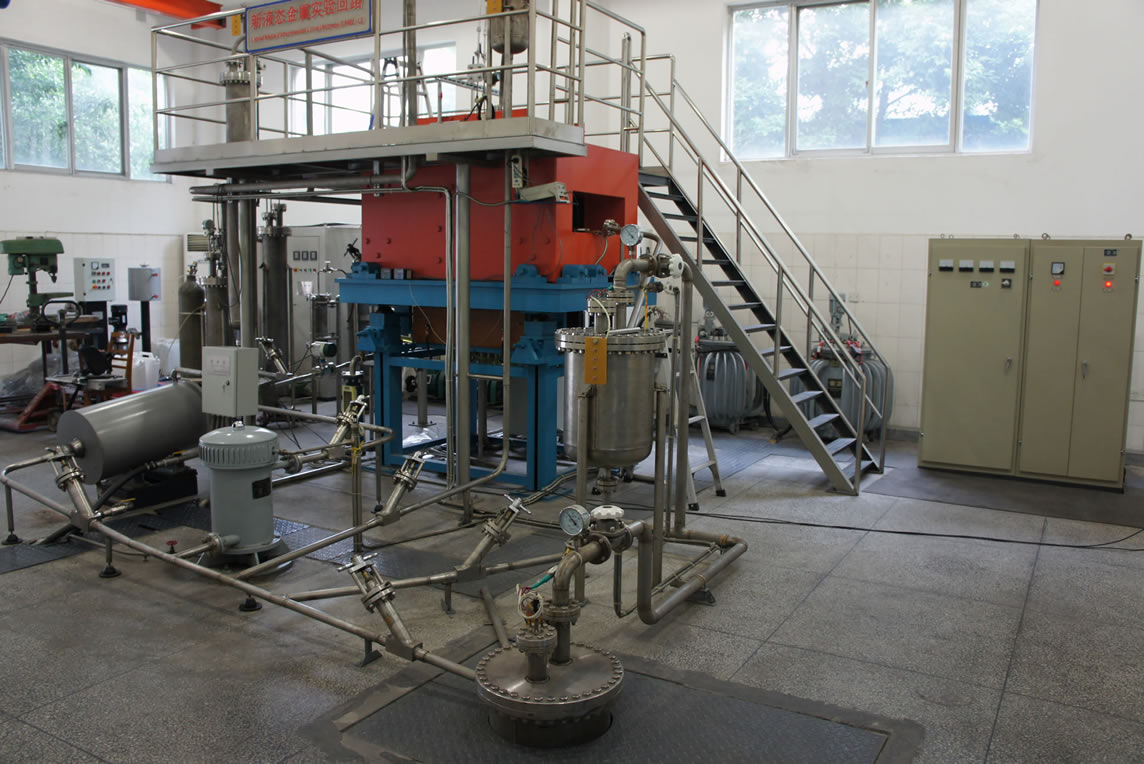
Figure 1. Picture of the liquid metal experimental loop up gradate facility (LMEL-U).
Figure 2, ref [1,2]): A rectangular duct with two small weld slots, i.e., “Sc-duct”, was fabricated with two simple Utype 304 stainless steel channels welded at the middle line of the lengthwise sides( designed to reduce the manufacture cost) while conducting experimental investigations on the MHD effect of the FCI flow. Yet, a dramatic influence on the flow pattern, pressure gradient and electric potential distribution had been measured [1]. It can be found that the small weld slots make the center velocity and the MHD pressure drop to increase, and the velocity distribution on the center-plane (y = 0) of the cross section of the duct deviates from the classical M-type profile. We make a supposition that the secondary flow (due to small weld slots) results in the center velocity and the MHD pressure drop raise and the velocity distribution deviated from the classical M-type profile (in this case, the classical M-type velocity profile strengthen the secondary flow effect). To proof the supposition, the special design experiments are conducted as the following:
1) Case 1, the normal duct (short in “N-duct”) was designed: 304 SS duct of 68, 60 and 2 mm in 2a, 2b and tw, respectively. This is as a non-secondary flow duct to be got the benchmark MHD experimental data.
2) Case 2, it is above stated MHD geometry sensibility phenomena (see Figure 2), the slots in the middle of 2a side walls is named “Sc-duct”: 304 SS duct of 68, 60, 2, ~5 and ~10 mm in 2a, 2b, tw, ds (in weld zone produced small slots in depth) and 2ws( in width), respectively. It is the cause of the investigation of the secondary flow MHD effects.
3) Case 3, it is designed a protruding duct in 2a side walls (see Figure 3, short in “Pr-duct”): 304 SS duct of 68, 58, 2, 5, 5.5 and 2.54 mm in 2a, 2b tw, 2wn (the protruding twig in width), hn (in height) and twe (the equivalent wall thickness of the duct), respectively. If the supposition of the secondary flow MHD is correction, the MHD pressure drop will be reduced in the Pr-duct.
4) Case 4, it is designed as a slot in verges in 2a side walls (see Figure 3, short in “Sv-duct”): 304 SS duct of 68, 52, 6, 42, 6, 3 and 3.94 mm in 2a, 2b tw, 2s (the verges of 2a side walls with distance), 2wsv (in width), dsv (in depth) and twe (the equivalent wall thickness of the duct), respectively. If the supposition of the secondary flow MHD is correction, the MHD pressure drop will be also reduced in the Sv-duct.
Figure 3 shows the schematic of cross sections of Prduct and Sv-duct and the test units in the uniform magnetic field. The four test units, its rectangular duct made of stainless steel is 1500 mm long. The pressure drop is measured over a section of 500 mm long in center zone, which is well distanced from both the edges of the test section (500 mm apart) and the two fringing field zones at the entry to and the exit from the magnet (120 mm apart). So that the data measured is from the full developed flow zone.
3. Experimental Results and Discussion
The experimental results are shown in Figures 4-6. MHD pressure drop have evidently reduced for the Pr-duct and the Sv-duct flows. Even for N-duct flow, the velocity distribution in the cross section is deviating from classical M-type profile [4,5], it will be specially discussed in next section.
Figure 5 and Figure 6 show that MHD pressure drop is evidently reduced (~65% lower than that in N-duct) in both cases of the protruding twigs at the middle of 2a side walls and slots in verge of 2a side walls (see Figure 2), and that the velocity distribution in cross section of the Pr-duct and the Sv-duct is similar with two peaks. It is difficult to explain clearly by current theory why the velocity
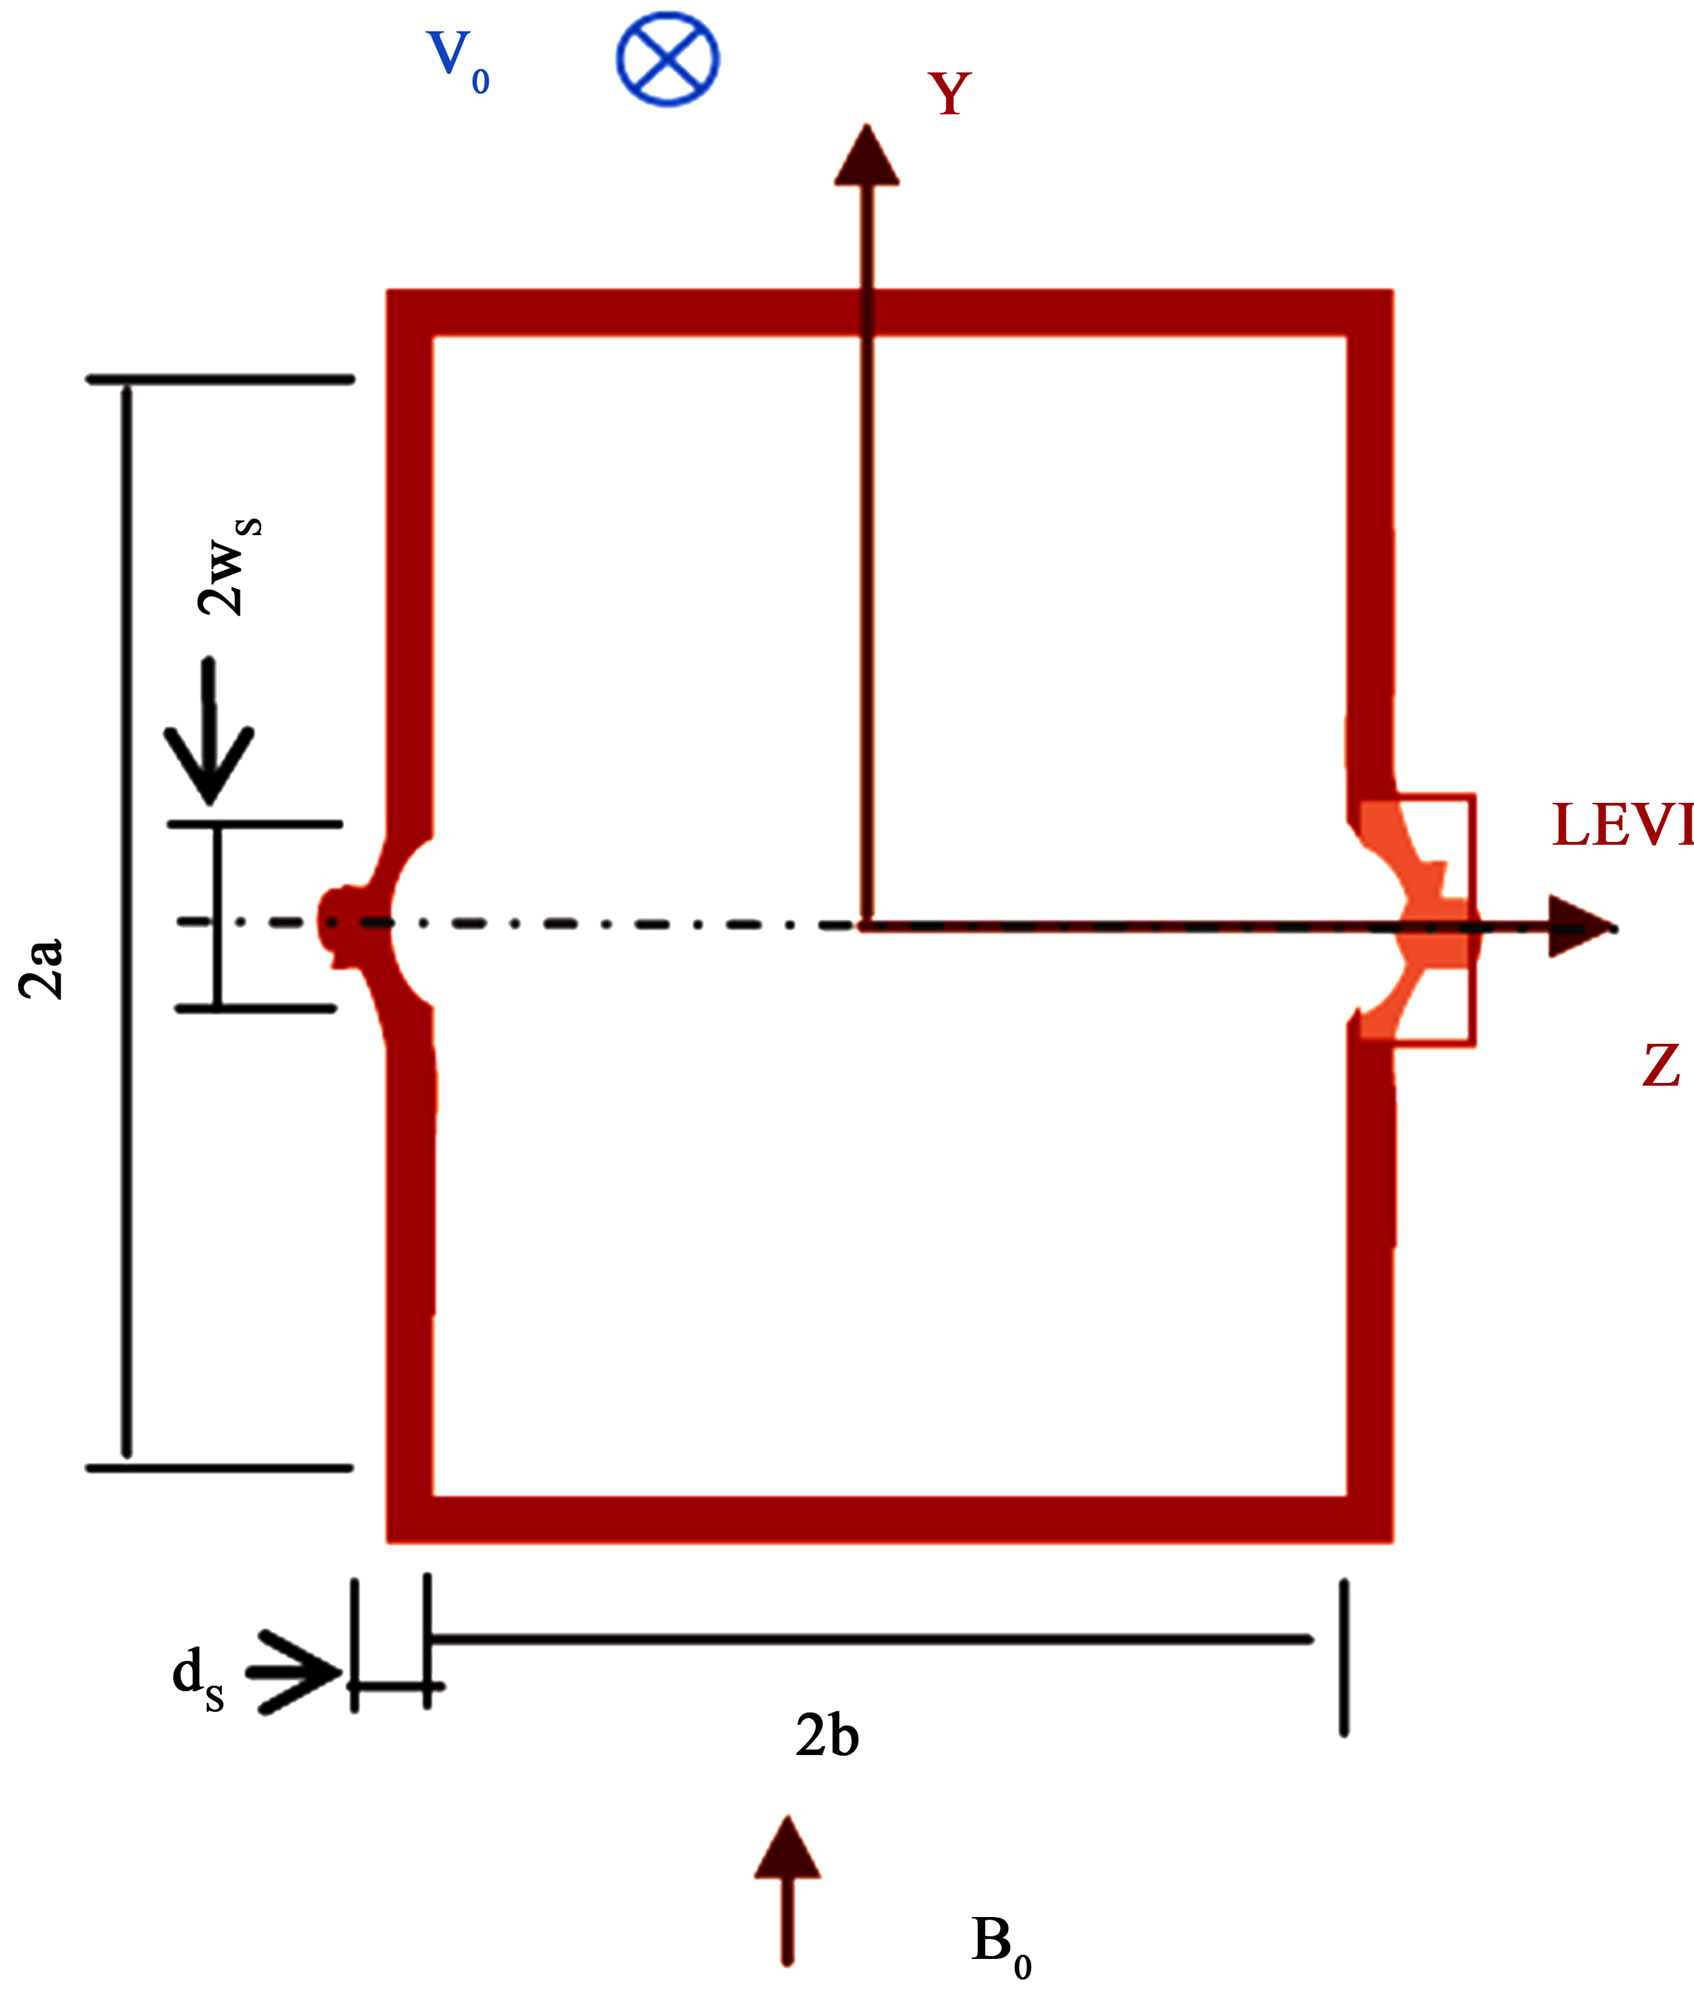
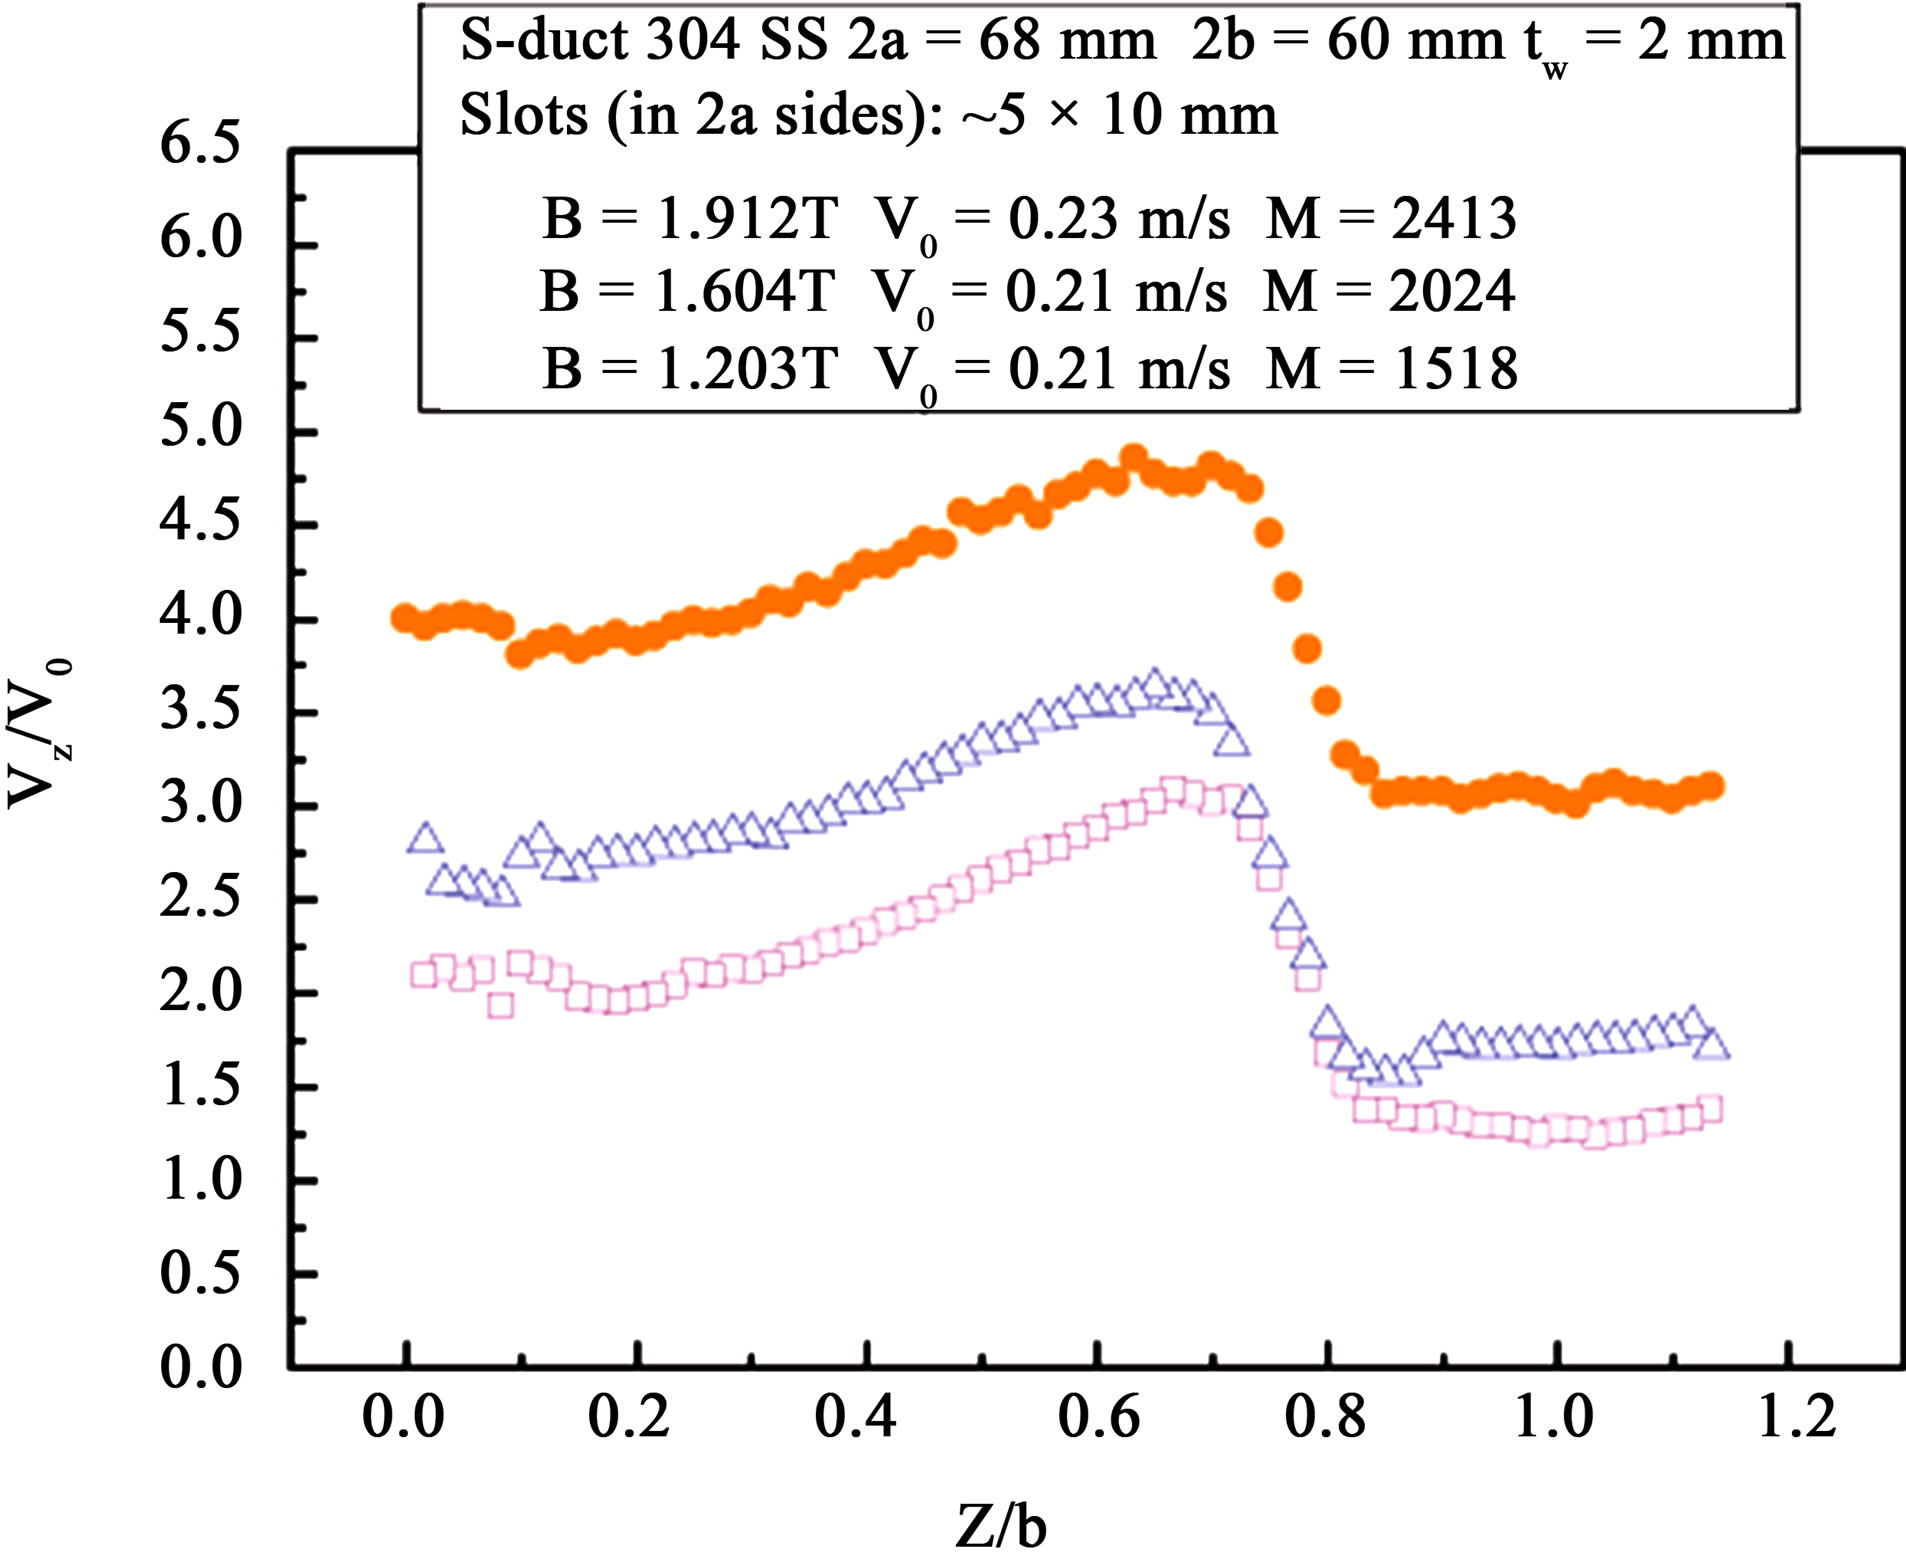
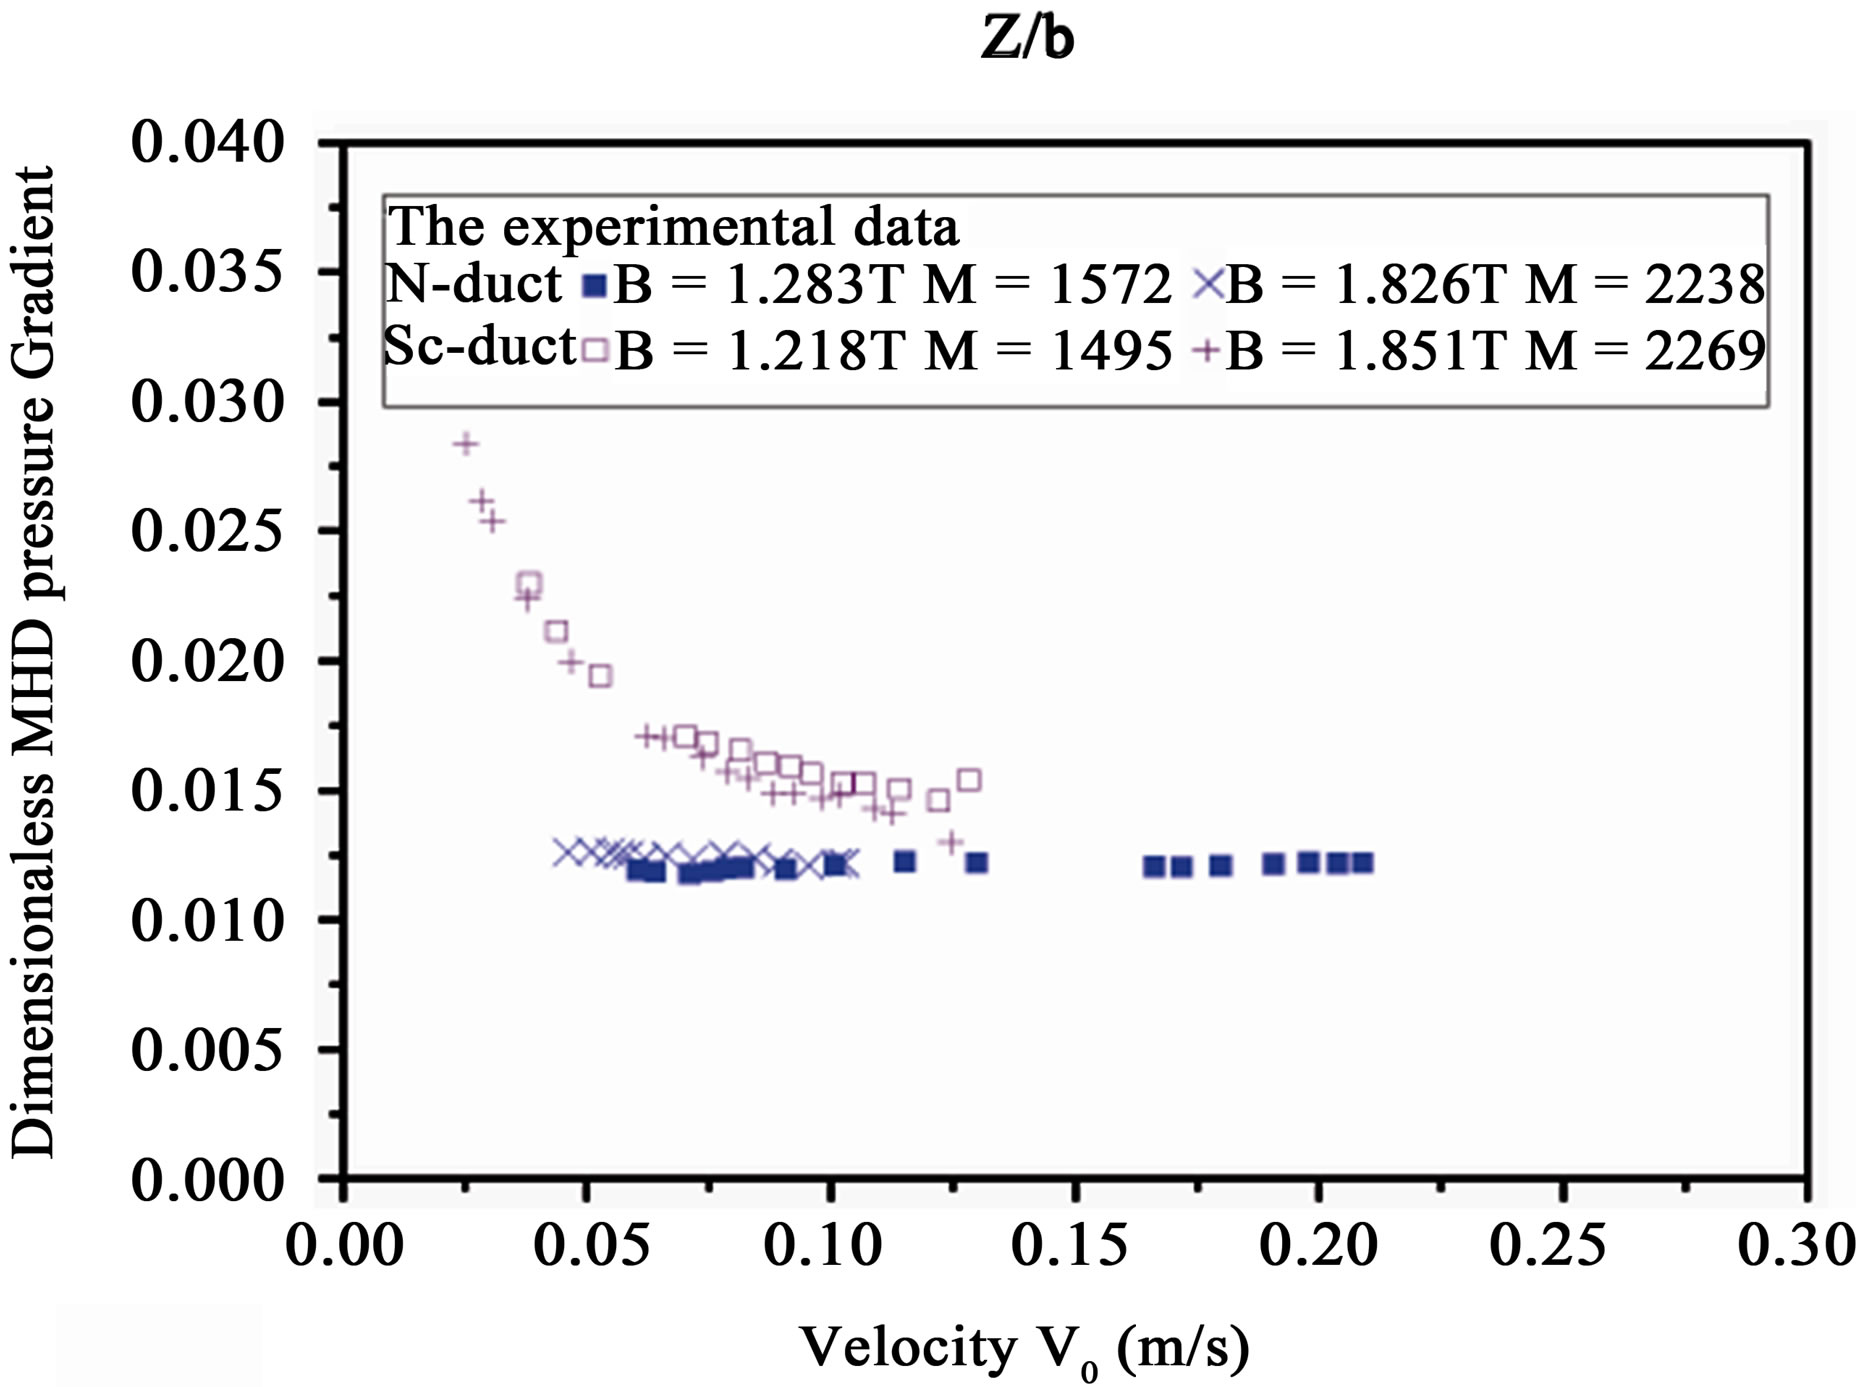
Figure 2. MHD experimental results of the velocity distribution in cross section (left upper) and MHD pressure drop (left downer) of MHD geometry sensibility phenomena (right upper, Sc-duct) re-built from Ref [1].
Figure 3. Schematic of cross section of Pr-duct and Sv-duct (upper part) and the test units in the uniform magnetic field (downer part).
Figure 4. MHD experimental results of the velocity distribution in cross section (left) and MHD pressure drop (right) of the N-duct.
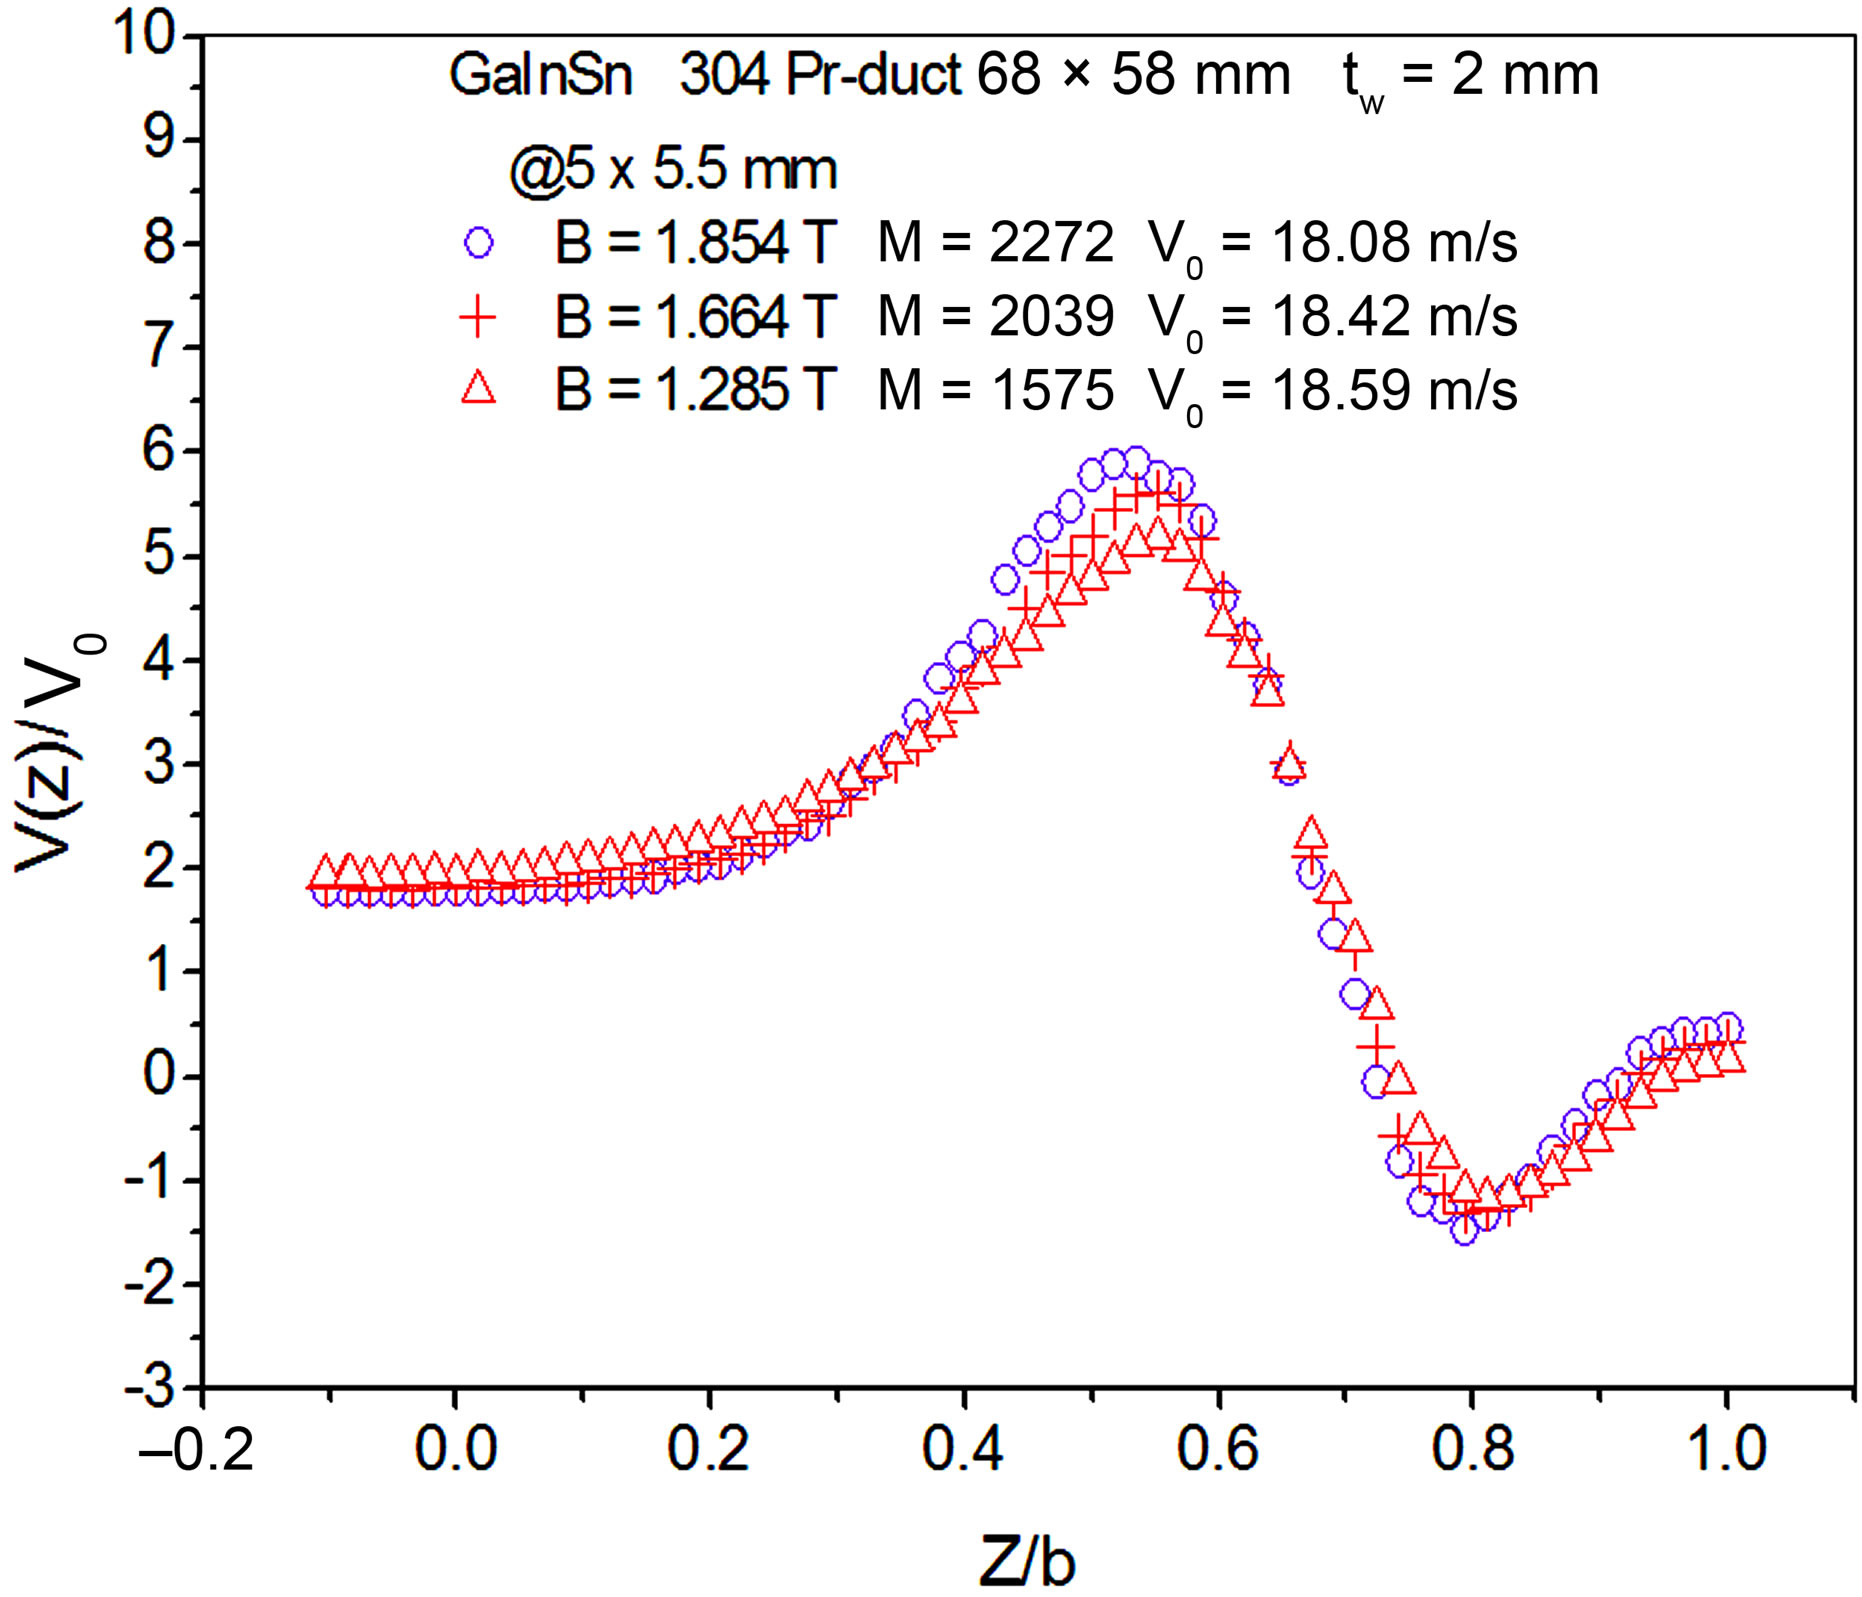
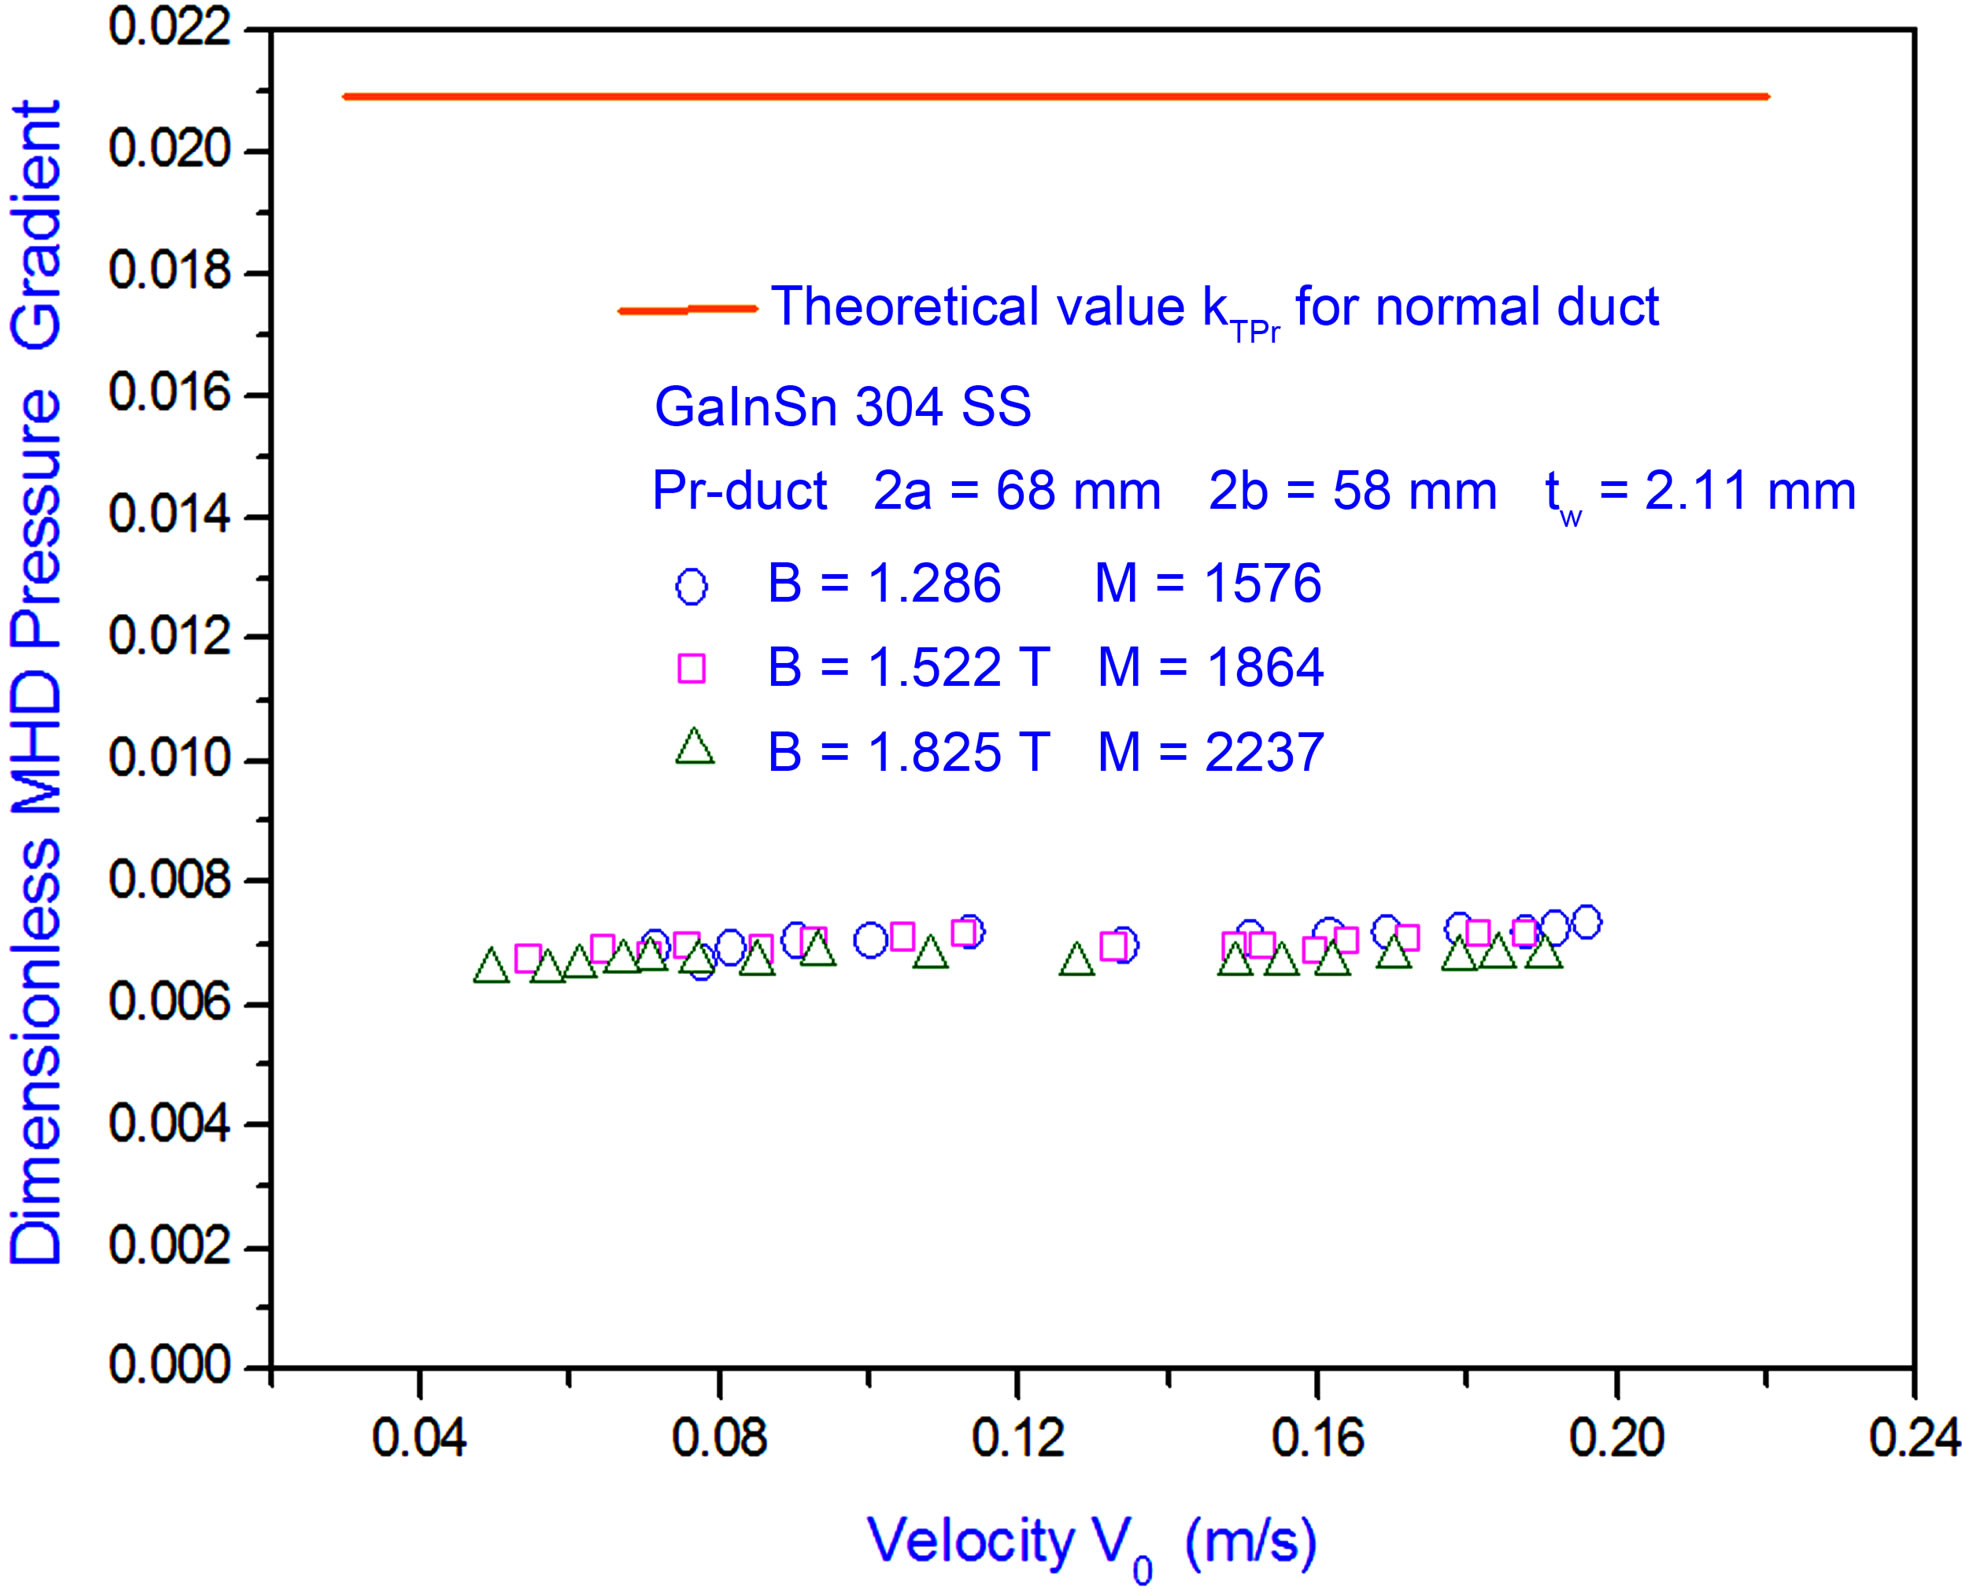
Figure 5. MHD experimental results of the velocity distribution in cross section (left) and MHD pressure drop (right) of the Pr-duct.
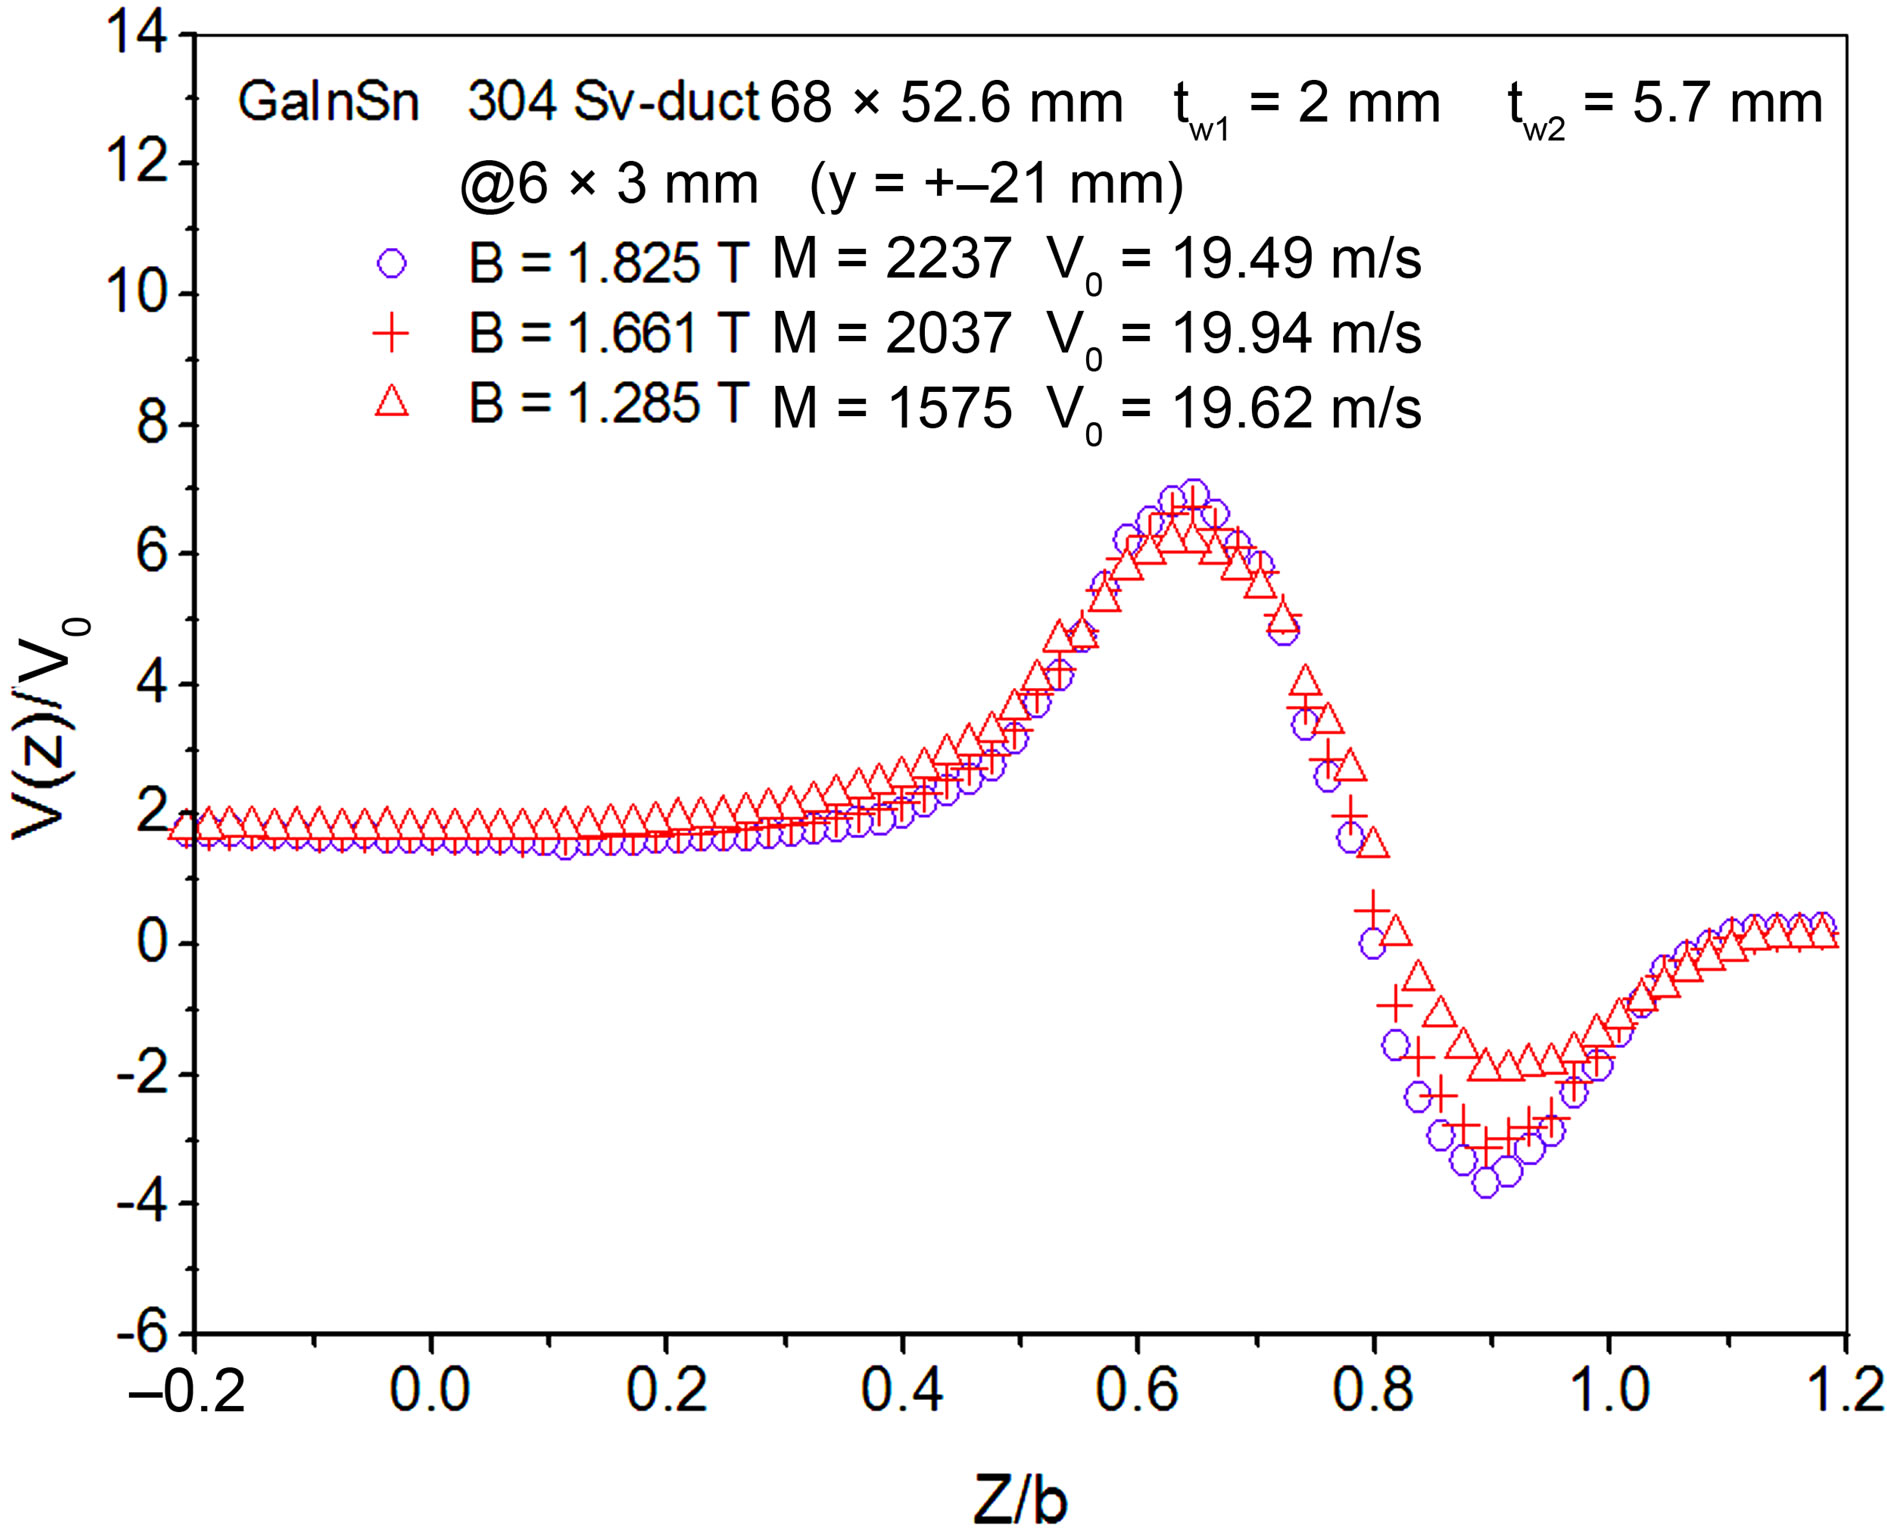
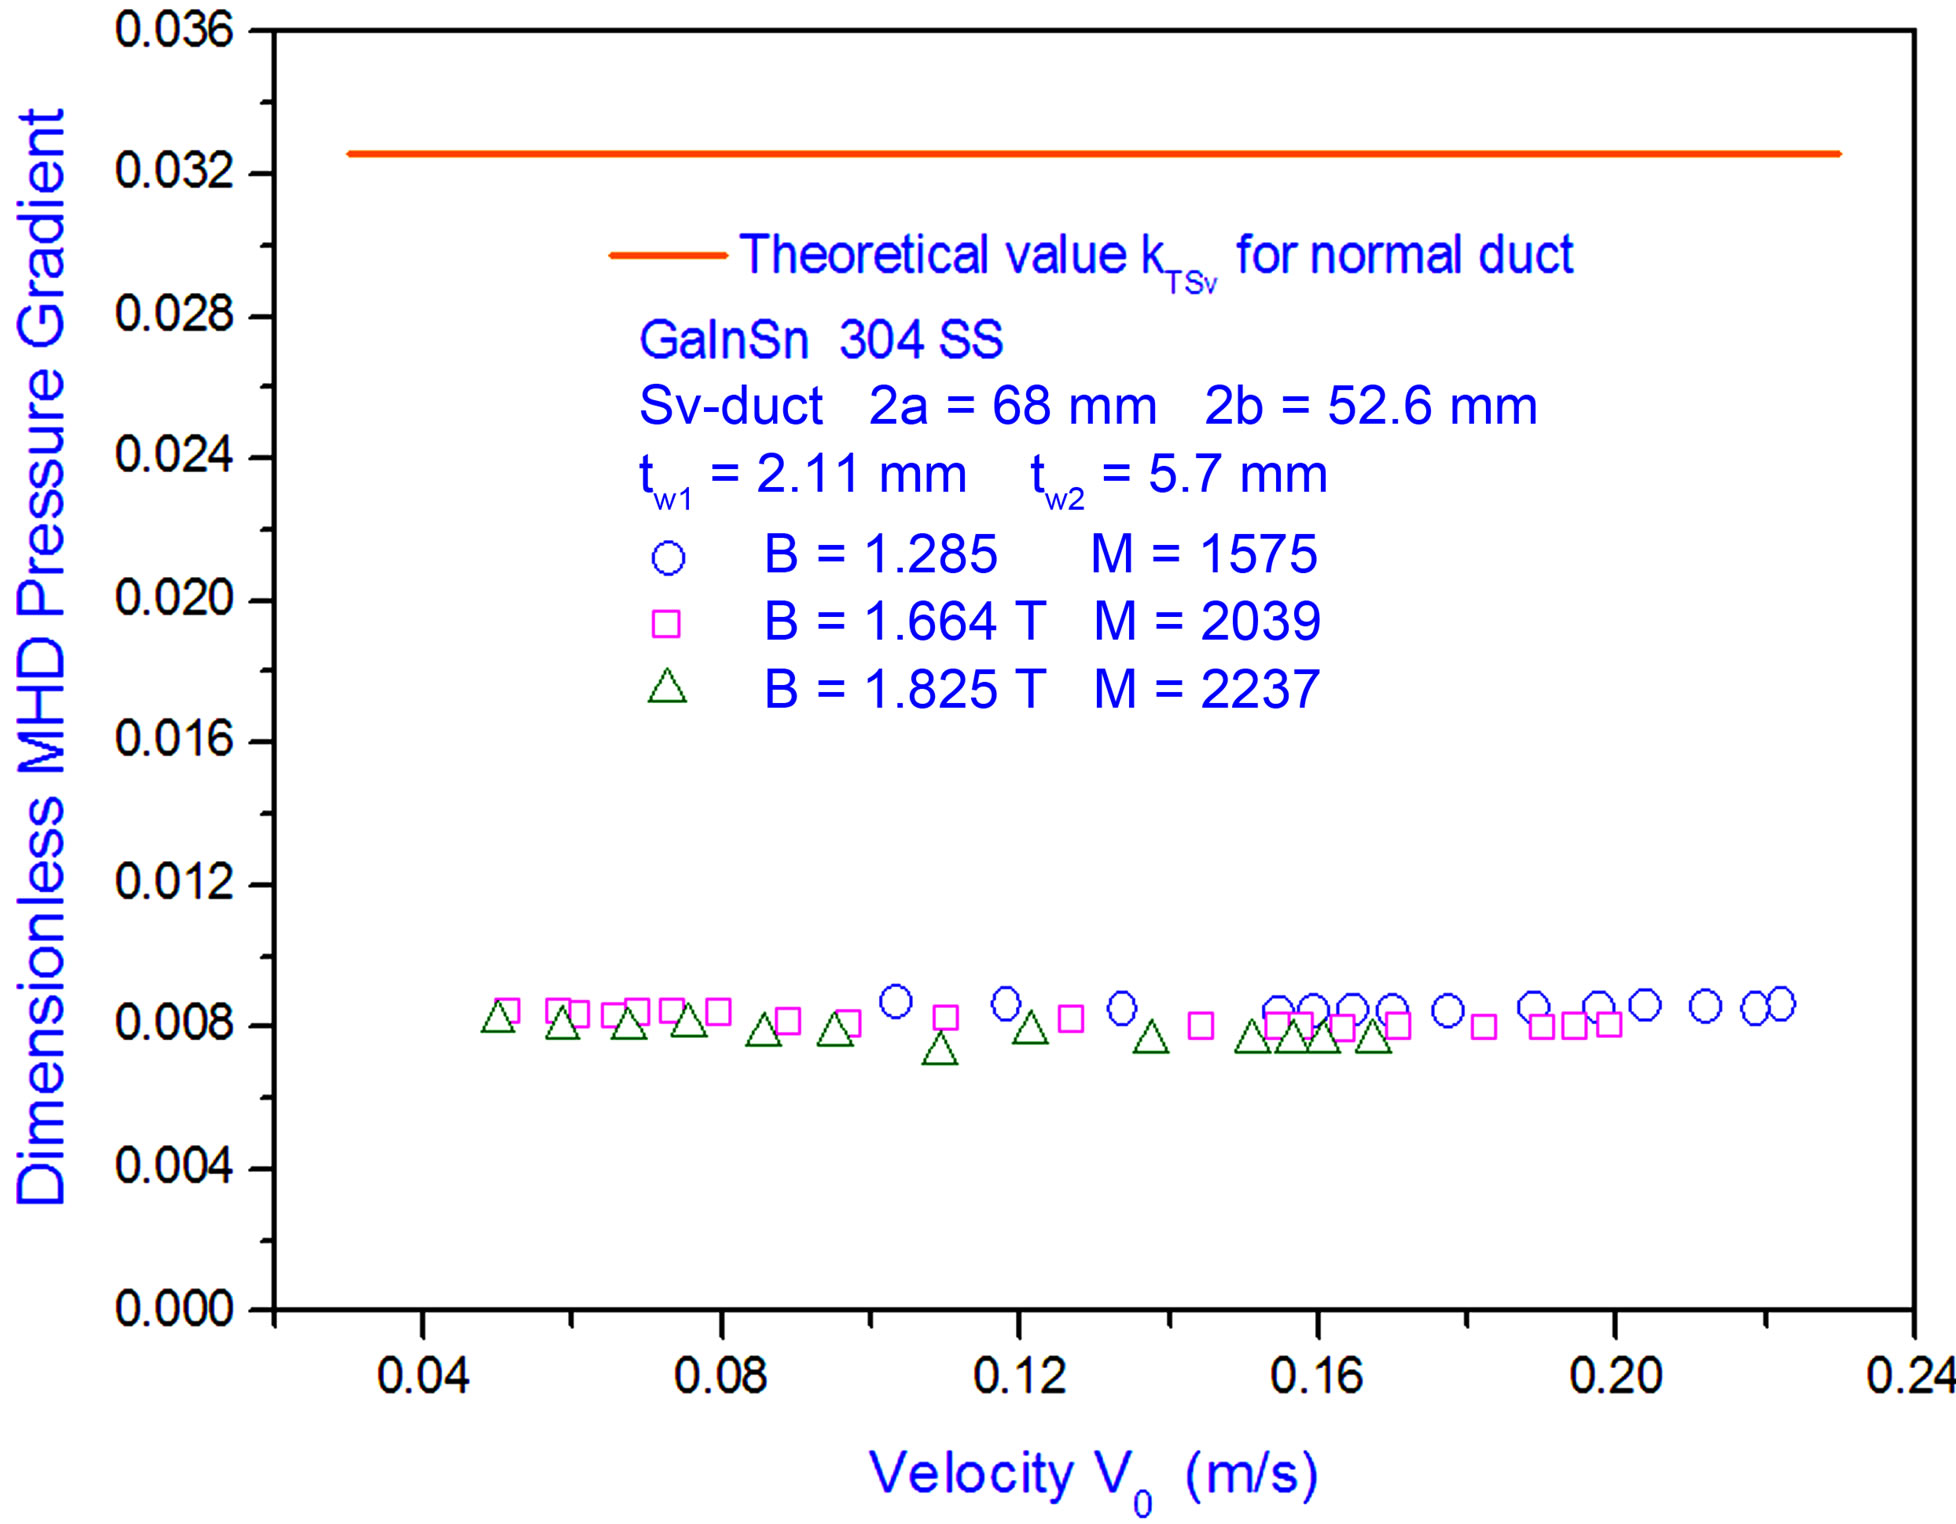
Figure 6. MHD experimental results of the velocity distribution in cross section (left) and MHD pressure drop (right) of the Sv-duct.
distributions like this? But we can understand why the peak is of difference in two cases (Pr-duct and Sv-duct cases). The diagram of the secondary flow due to the protruding twigs and slots (see Figure 7, and see ref [1]) can help to understand the difference of the velocity distribution. It can be seen that the secondary flow due to one pair of protruding twig in the Pr-duct, and that due to by two pair of slots in the Sv-duct. So it results in at y = 0 plane, the secondary flow effect is in double in the Sv-duct, and the two peaks of velocity in cross section of the Sv-duct are higher than that in the Pr-duct.
Above experimental data show that the slots or protrudeing twigs caused the secondary flow and results in MHD pressure drop increased (in Case 2) or decreased (in Cases 3 & 4), and indicated that it is correction of the supposition of the secondary flow MHD effect, and that the secondary flow MHD effect can be used to reduce MHD Pressure drop.
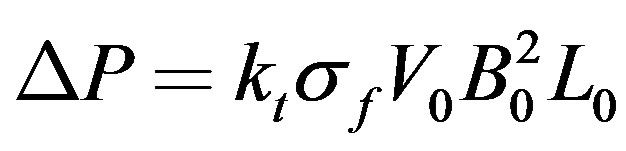
For well understanding the experimental results, all experimental data are divided by a normalization factor to the N-duct case. As we know, according to classic magneto-hydrodynamics theory the MHD pressure drop in rectangular thin wall conducting duct is (Ref [5]):
 (1)
(1)
Here DP is the MHD pressure drop; kt is the characteristic of the duct (called as the dimensionless MHD pressure drop/gradient), V0 is the average velocity of the duct flow, B0 is transverse magnetic field, L0 is the distance of measured MHD pressure drop. The dimensionless MHD pressure drop from theory is:
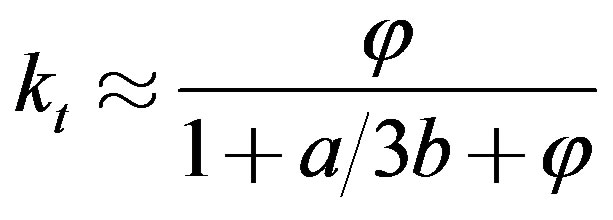 (2)
(2)
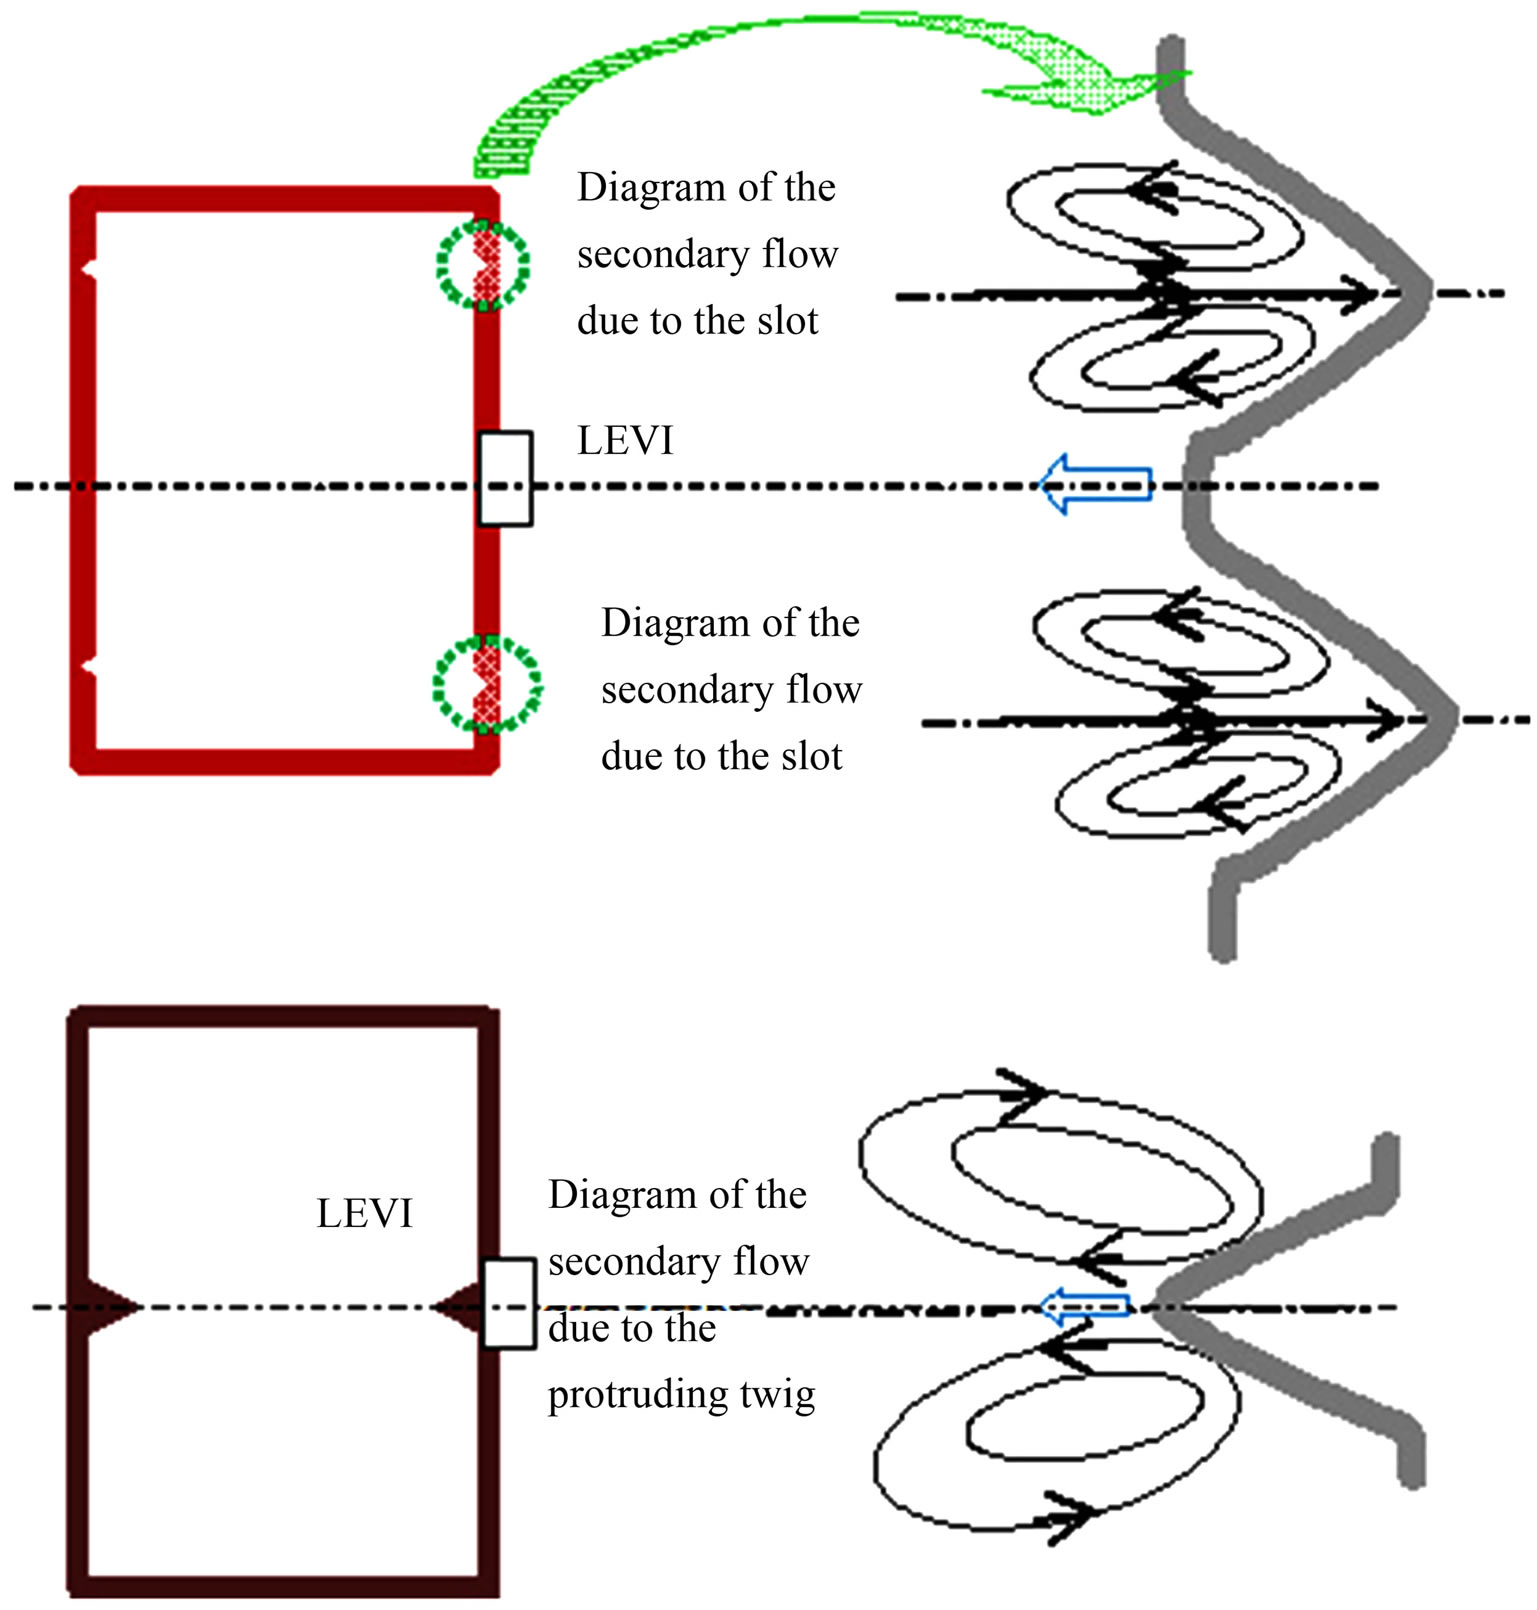
Figure 7. Schematic of the secondary flow in Pr-duct and Sv-duct.
Here  = swtw/sfa is the wall conductance ratio, sf and sw is the liquid metal conductivity and the duct conductivity, respectively. The experimentally measured dimensionless MHD pressure drop ke is:
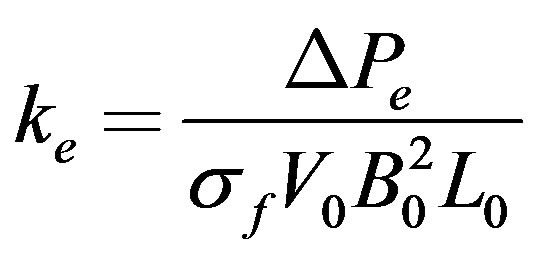 (3)
(3)
Here DPe is measured from the sensor of pressure difference, V0, B0 and L0 also is measured data, sf has been known.
So, after divided by a normalization factor ktN/ktj, the normalization experimental value is transferred to:
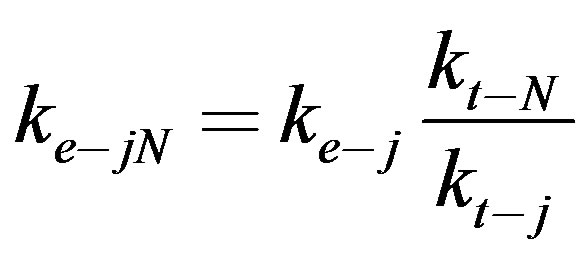 (4)
(4)
where subscript “j” denotes “Pr” (Pr-duct), “Sv” (Sv-duct) or “Sc” (Sc-duct), N denotes “N” (N-duct). Such as:
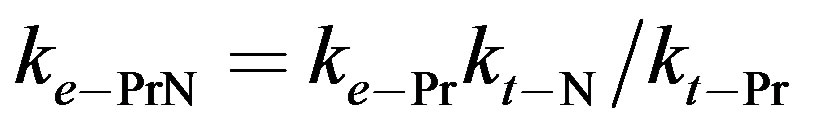 .
.
The comparison of velocity distribution and MHD pressure drop in four case ducts are shown in Figure 8. It is noted that two protruding twigs at the middle of 2a side walls and four slots in verge of 2a side walls are similar in reducing MHD pressure drop.
It will be expected that MHD pressure drop will be evidently reduced in an innovation channel, a heterotypic side wall duct, or called as “the secondary flow channel”, short in “S-channel”, which is combined the both effects of the Pr-duct and the Sv-duct, similarity the graph of right-1 at downer part of Figure 9. It may be a new hope for solving MHD pressure drop key issue of liquid metal blanket concepts.
4. Other Missions-Related
The left part of Figure 9 shows the velocity distribution in the center plane (y = 0) of the cross section of the rectangular duct (N-duct) in different work mass of GaInSn and Nak from LMEL facility experimental data [7]. The results of Nak flow is better approach to analysis solution values. But for GaInSn flow, the velocity distribution is deviating from theory expectation. This deviation is possible that other result is shown in the right part of Figure 9 [6]. To understand the different of velocity distribution in GaInSn flow is another important mission of investigation of liquid metal blanket MHD effect.
5. Conclusions
From above experimental results and discussions, the tentative conclusions can be deduced as below:
1) The two slots at the middle of 2a side walls of a duct
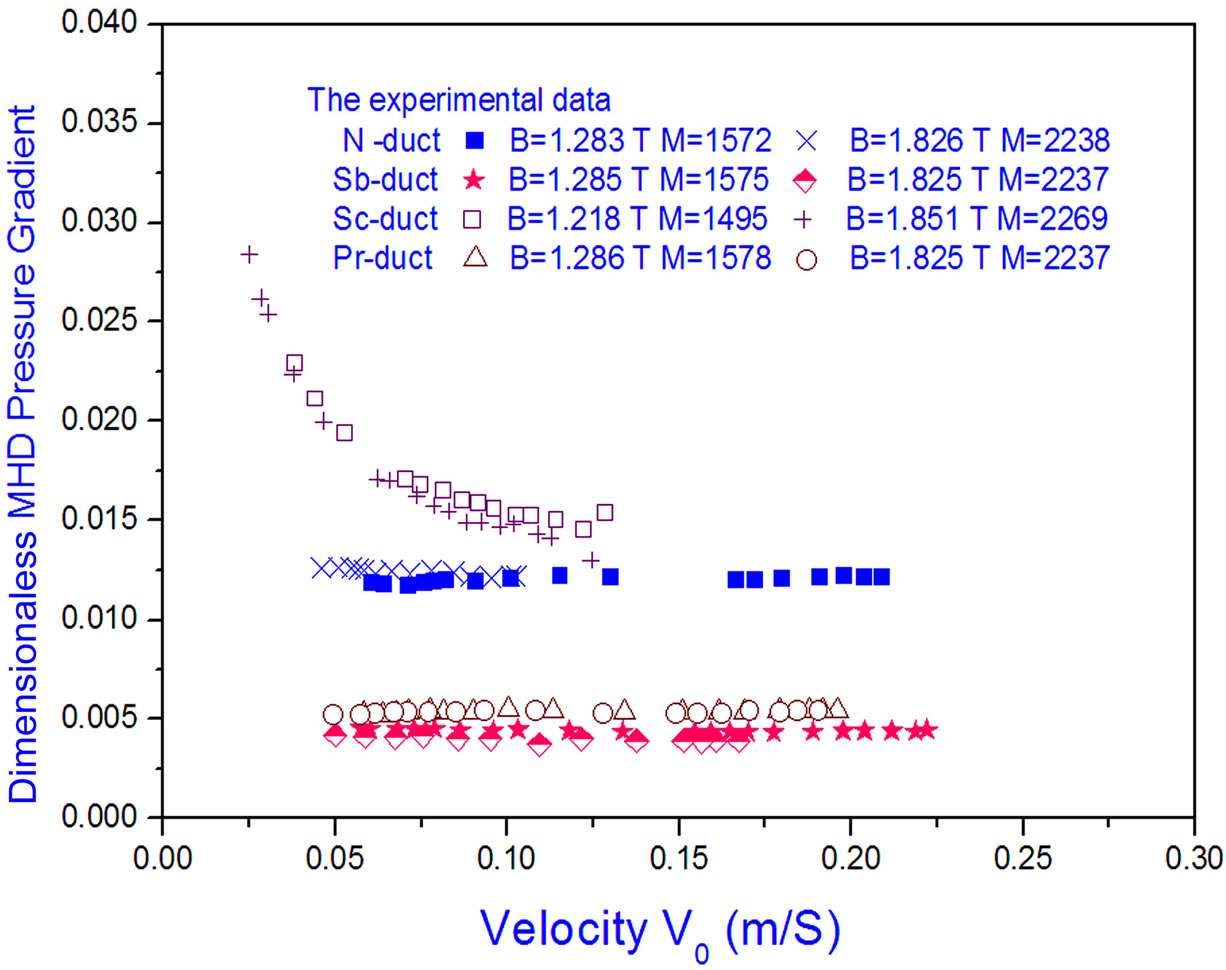
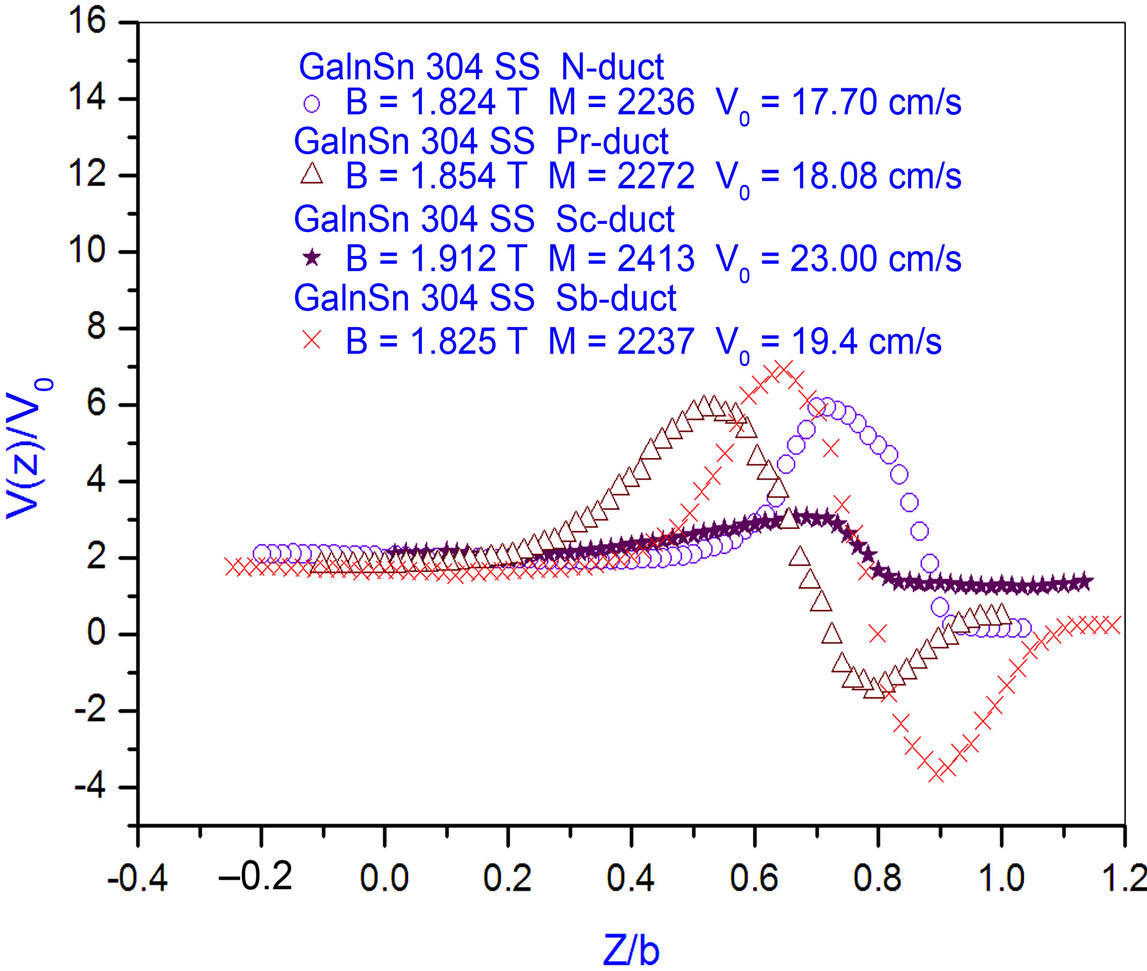
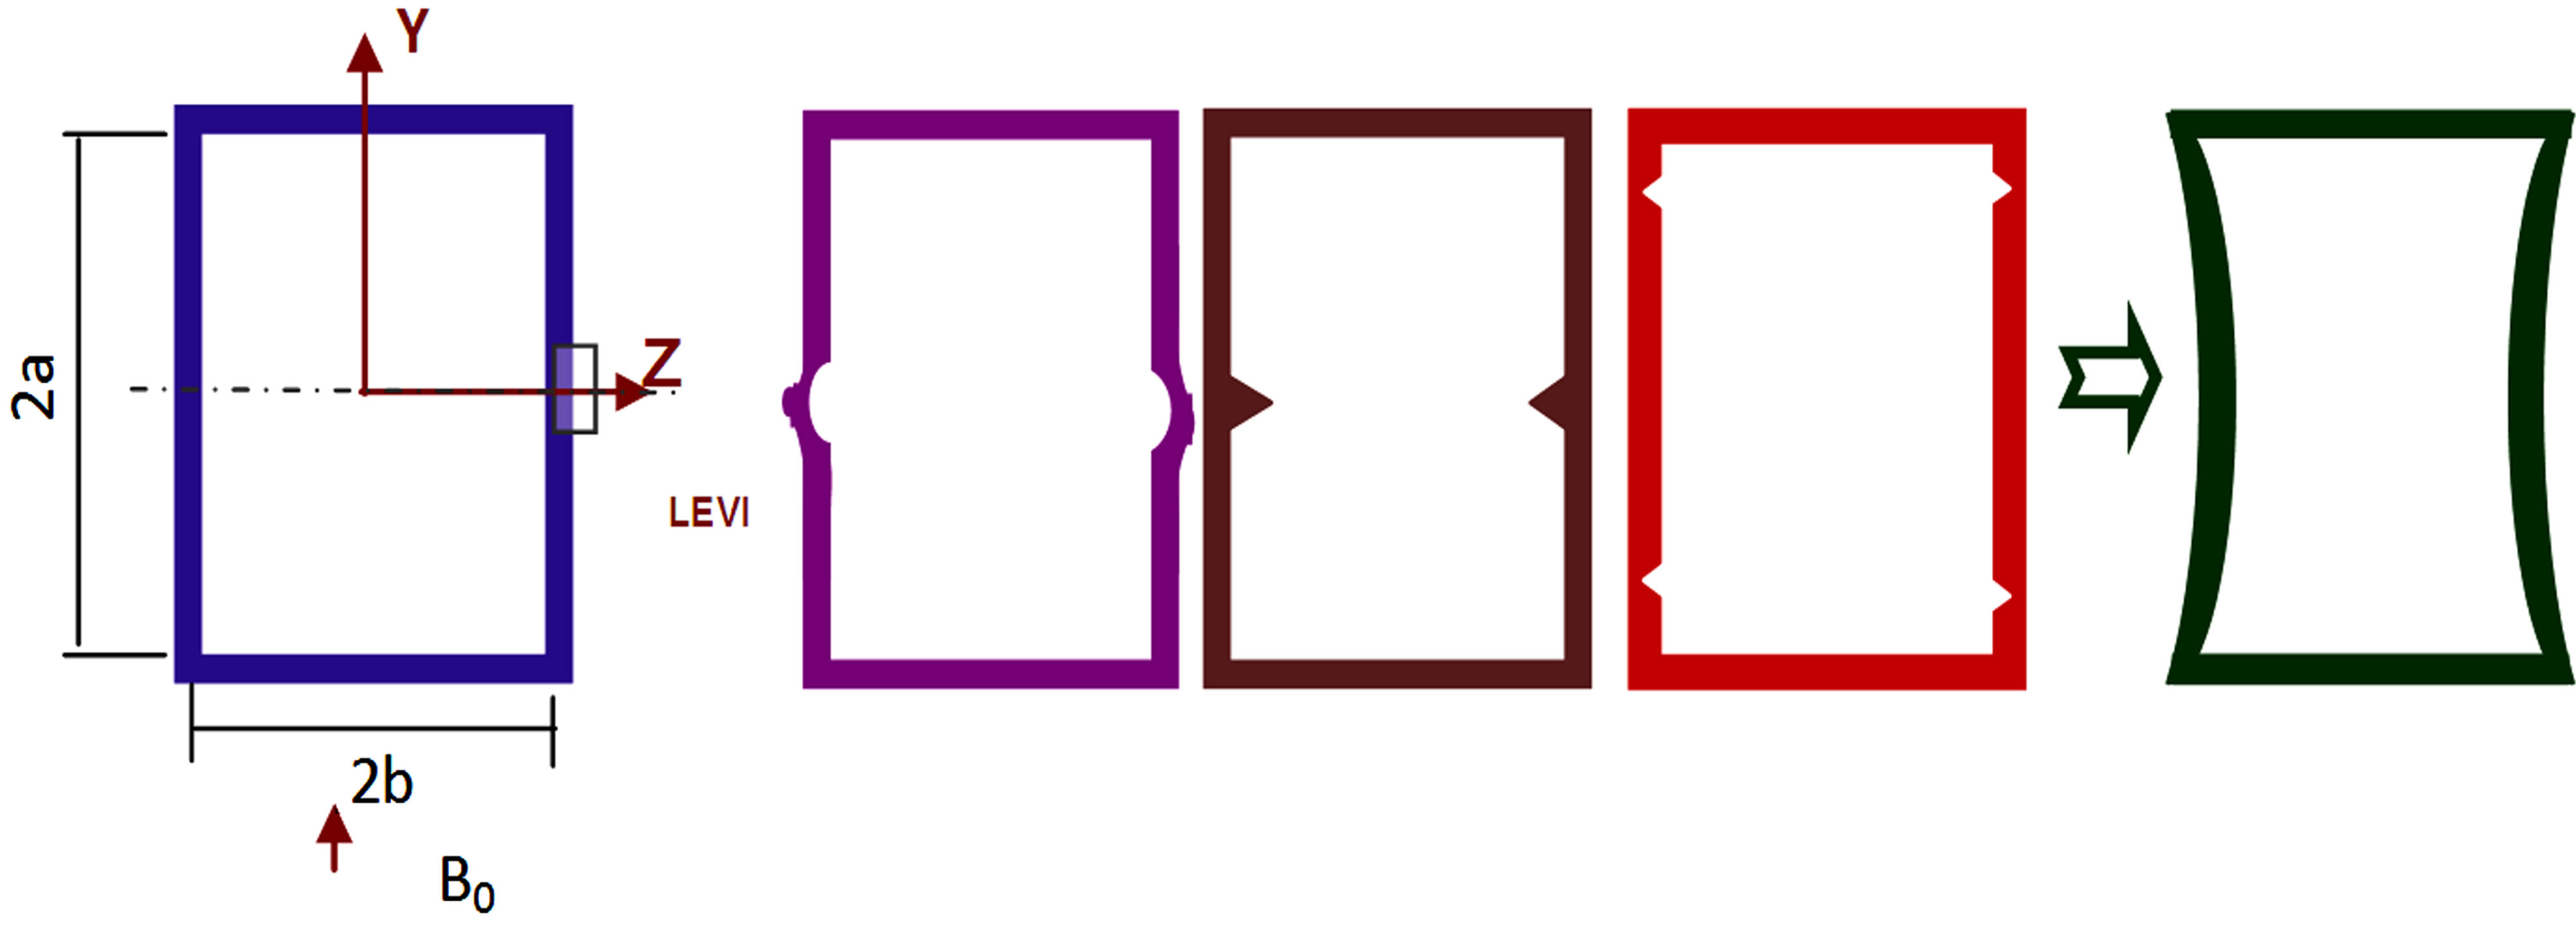
Figure 8. MHD experimental results of the velocity distribution in cross section (left) and MHD pressure drop (right) in four cases. MHD pressure drop in S-duct, Pr-duct and Sv-duct are made a normalization factor to N-duct. The right of the downer part shows a duct of combining the both characterizes of Pr-duct and Sv-duct.
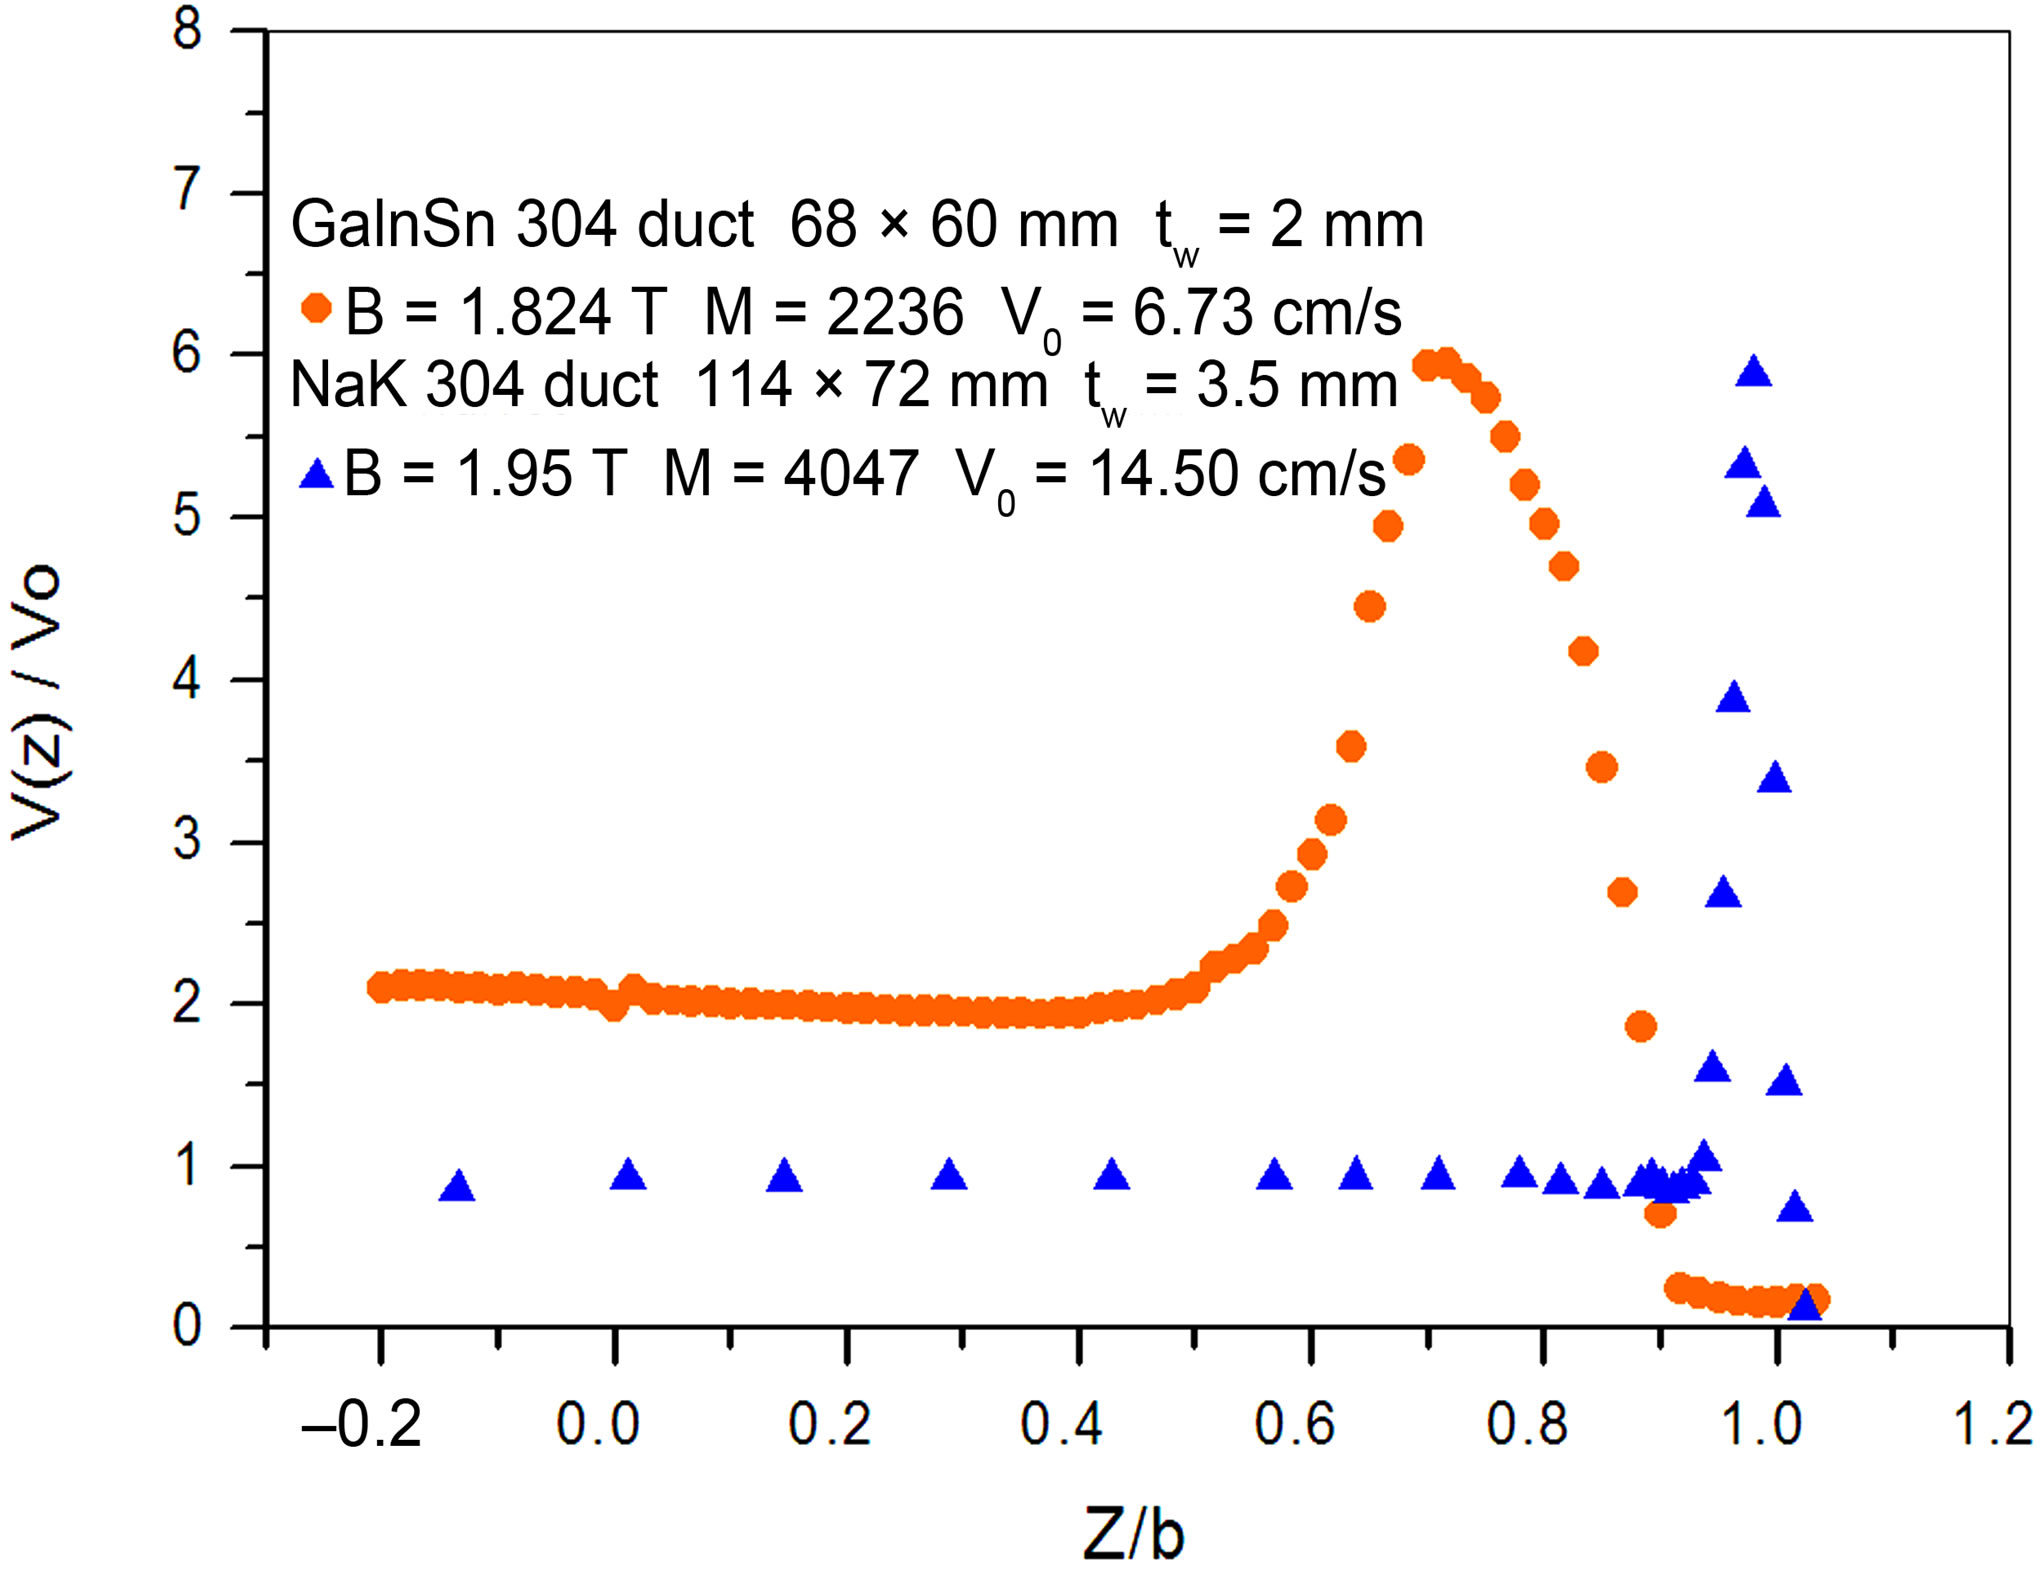
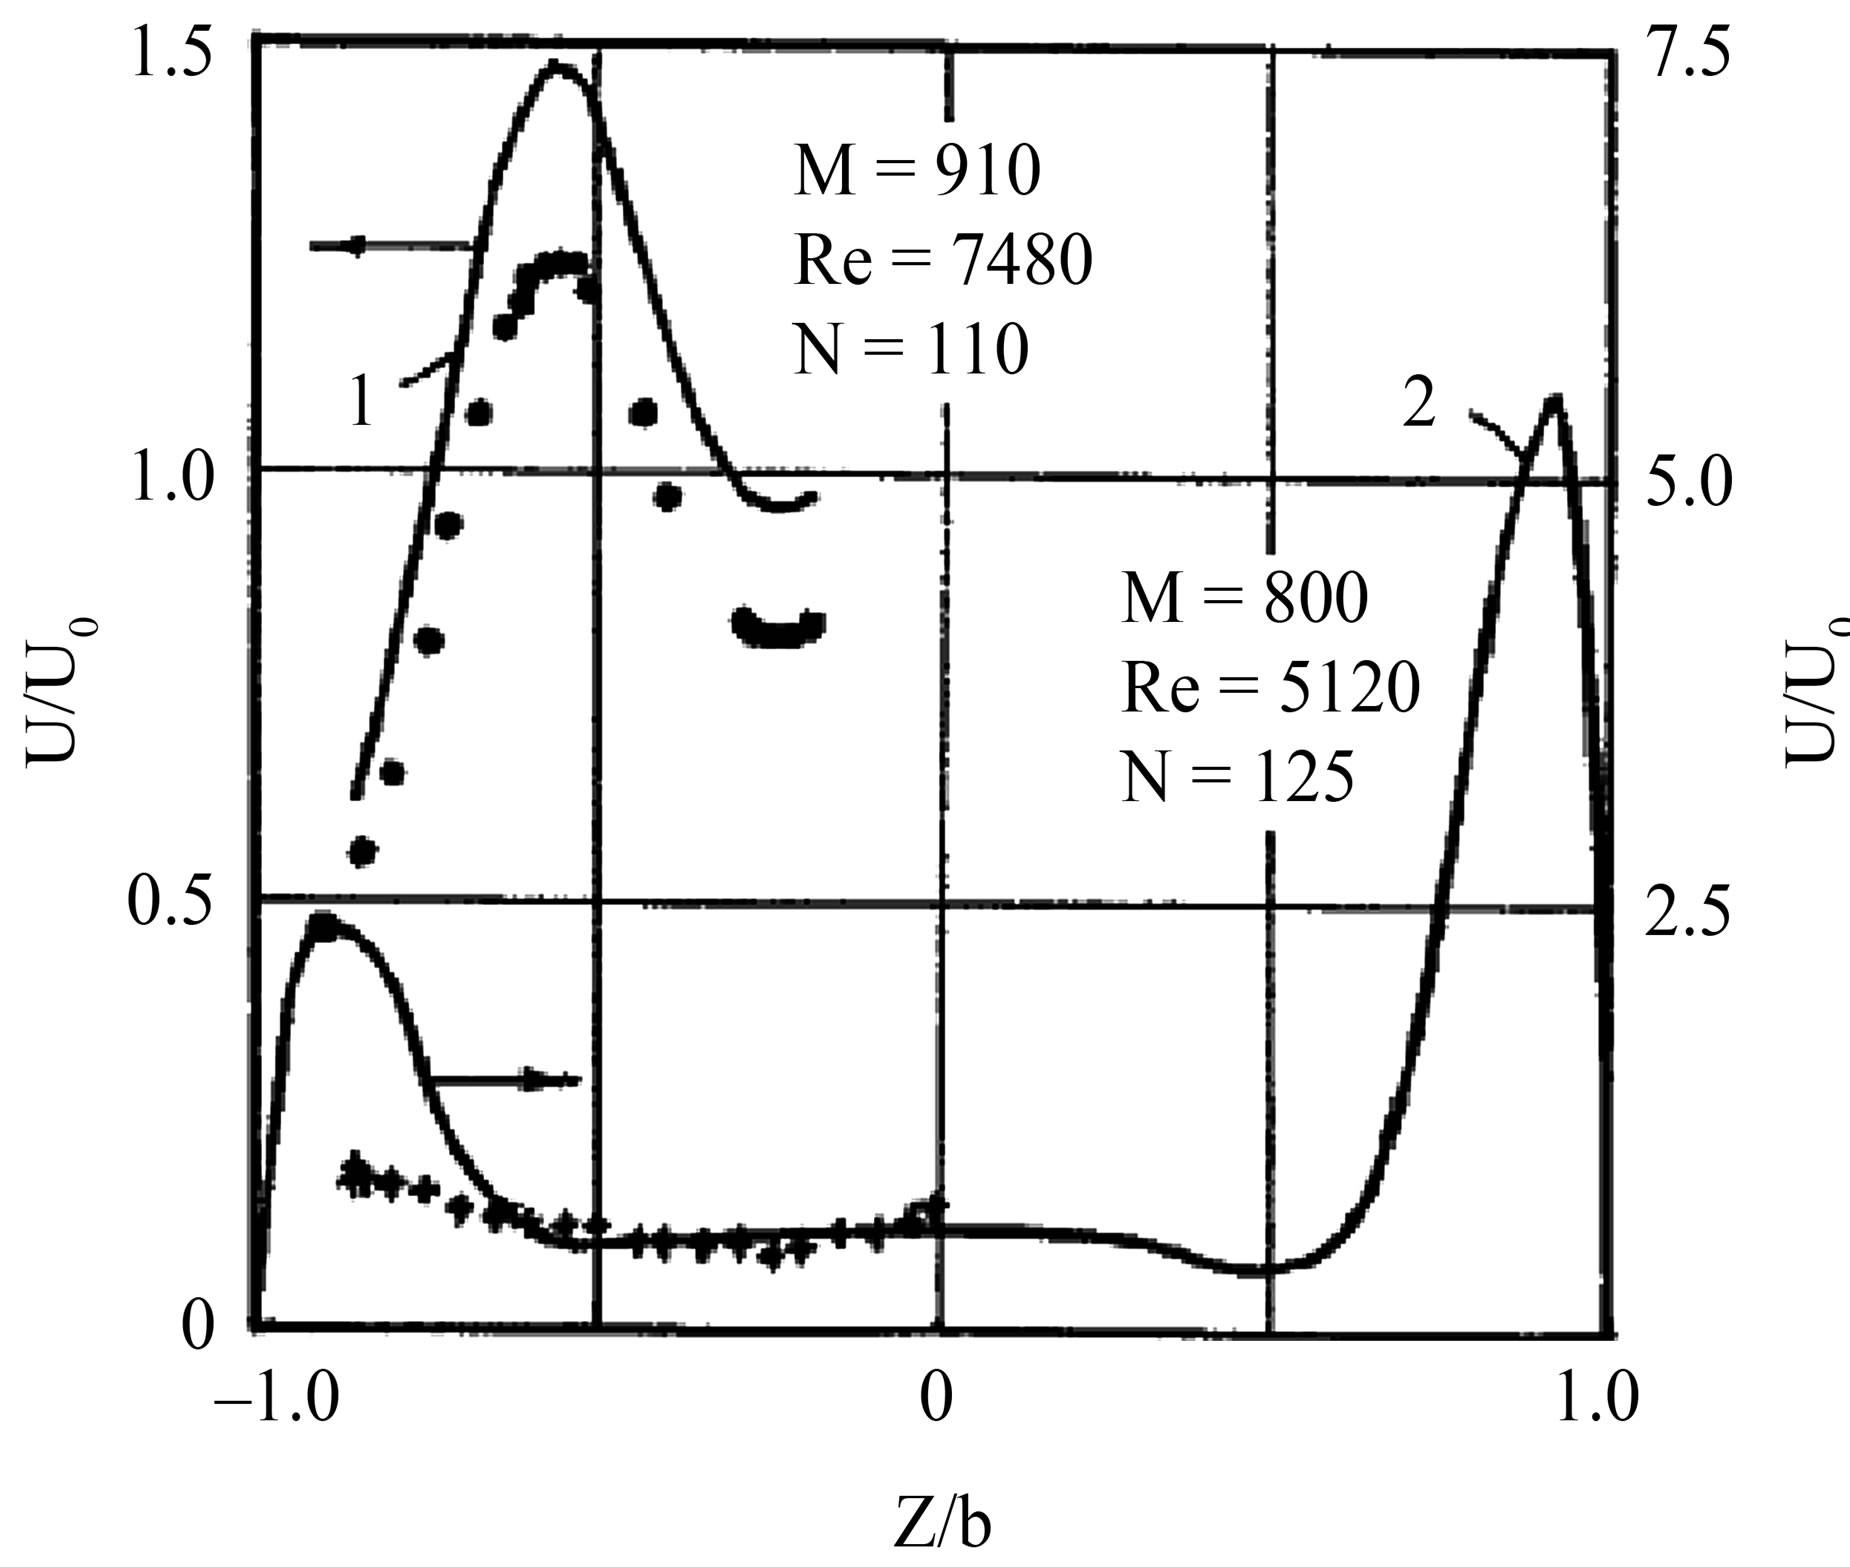
Figure 9. Comparing velocity distribution in cross section of rectangular duct for GaInSn flow with for NaK flow. The left part is the present experimental data and re-built from ref [7]) from LMEL/-U facility results, the right part is cited from ref [5], 1—for GaInSn flow, 2—for Nak flow.
makes MHD pressure drop increase;
2) The one pair of protruding twig at the middle or two pair of slots in verge of 2a side walls of a duct makes MHD pressure drop decrease;
3) The velocity distribution in cross section of normal rectangular duct for GaInSn MHD flow is different from that for NaK MHD flow;
4) An innovation S-channel concept is addressed as a reducing MHD pressure drop channel for the potential application of a liquid metal blanket system in fusion reactor. For the innovation concept, it is necessary for the more detail studied on theory and experimentally.
6. Acknowledgements
China National Nature Science Foundation grants 10775042 and Nuclear Energy Development Project in Special Program, H6603100, China, support the work and Argonne National Laboratory supplied the LEVI under the collaboration of the 1995 People’s Republic of China/United States program of cooperation in magnetic fusion.
REFERENCES
- Z.-Y. Xu, C.-J. Pan, X.-J. Zhang, L. Zhao, et al., “Geometry Sensitivity of Magnetohydrodynamic Duct Flow and Some Abnormal Phenomena,” Plasma Science and Technology, Vol. 11, No. 3, 2009, pp. 499-503. doi:10.1088/1009-0630/11/4/27
- Z.-Y. Xu, X.-J. Zhang, C.-J. Pan, X.-R. Duan and Y. Liu, “MHD Pressure Drop Geometry Sensitivity Correction Factors,” Magnetohydrodynamics, Vol. 46, No. 3, 2010, pp. 281-288.
- Z.-Y. Xu, X.-J. Zhang, C.-J. Pan, X.-R. Duan and Y. Liu, “Understanding FCI Flow Magneto-Hydrodynamic Behaviors with the Secondary Flow Effect,” Advances and Applications in Fluid Mechanics, Vol. 10, No. 2, 2011, pp. 111-222.
- J. C. R. Hunt, “Magnetohydrodynamics Flow in Rectangular Ducts,” The Journal of Fluid Mechanics, Vol. 21, Part 4, 1965, pp. 577-590.
- I. R. Kirillov, C. B. Reed, L. Barleon and K. Miyazaki, “Present Understanding of MHD and Heat Transfer Phenomen for Liquid Metal Blankets,” Fusion Engineering and Design, Vol. 27, No. 1, 1995, pp. 553-569. doi:10.1016/0920-3796(94)00357-D
- S. I. Sidorenkov and A. Shishko, “Variational Method for MHD Flow Calculation in Conducting Walls Slotted Channels,” Magnetohydrodynamics, Vol. 27, No. 4, 1991, pp. 87-96.
- Z.-Y. Xu, C.-J. Pan, W.-H. Wei and X.-Q. Chen, et al., “Experimental Investigation and Theoretical Analysis Two Dimensional MHD Effects in Rectangular Duct,” Fusion Technology, Vol. 36, No. 47, 1999, pp. 47-51.
NOTES
*China National Nature Science Foundation grants 10775042 and Nuclear Energy Development Project in Special Program, H6603100, China, support the work.