Journal of Encapsulation and Adsorption Sciences
Vol.1 No.4(2011), Article ID:9145,8 pages DOI:10.4236/jeas.2011.14011
Yerba Mate Extract Encapsulation with Alginate and Chitosan Systems: Interactions between Active Compound Encapsulation Polymers
1Facultad de Ingeniería, La Plata, Argentina
2Instituto de Investigaciones Físico-Químicas Teóricas y Aplicadas (Inifta, Conicet—Unlp), La Plata, Argentina
3Centro de Investigación y Desarrollo en Criotecnología de Alimentos (Cidca, Conicet—Unlp), La Plata, Argentina
E-mail: *loredeladino@gmail.com
Received August 25, 2011; revised September 29, 2011; accepted October 9, 2011
Keywords: Yerba Mate, Antioxidants, Alginate, Chitosan, Encapsulation
Abstract
Yerba mate (Ilex paraguariensis) contains a high amount of polyphenols associated with antiradical activity and possible benefits for preventing degenerative diseases. Natural extracts from this South American herb were encapsulated in calcium alginate and calcium alginate-chitosan beads to be incorporated as an additive in food products. The interactions between the active compound and the polymers were evaluated by Scanning Electron Microscopy (SEM), thermal analysis (Thermo Gravimetric Assays, TGA, and Differential Scanning Calorimetry, DSC) and Fourier Transform Infrared Spectrometry (FT-IR) studies. Also, the effect of these interactions on extract release in a gastrointestinal model system was evaluated. Results showed the interactions between the calcium alginate matrix and the chitosan external layer. Also, interactions between the natural extract and each polymer were observed. In both encapsulation systems the highest polyphenol content was released in simulated gastric fluid. However, capsules coated with chitosan allowed releasing a higher amount of polyphenols into the simulated intestinal fluid. This fact was attributed to both the protecttion of the chitosan barrier and the strong interaction between yerba mate extract and chitosan.
1. Introduction
Yerba mate (Ilex paraguariensis) is a beverage traditionally drunk in various countries of South America. It is rich in antioxidant compounds, minerals and vitamins. Yerba mate extracts have been obtained and characterized by HPLC, including total polyphenols content and antiradical activity [1-3]. The yerba mate polyphenols have relevant healthy properties like preventing DNA oxidation and in vitro LDL lipoperoxidation [4], antiatherogenic effect [5], inhibiting glycation related to diabetes disease [6] and promoting weight loss [7].
Nowadays, consumers’ interest is focused on healthy and minimally processed foods. However, replacing synthetic antioxidants with natural products is not simple due to their lack of stability. Thus, protecting active compounds against adverse conditions becomes necessary.
Encapsulation has been defined as the technology of packaging solid, liquid and gaseous materials in small capsules that release their content at a controlled rate over prolonged periods of time [8].
Biopolymers, like proteins and hydrocolloids, are used as encapsulating materials in food and pharmaceutical applications. Commonly, these polymers are not supposed to affect the encapsulated compound activity [9].
However, natural extracts are complex systems whose behavior is far from ideal. Thus, selection of encapsulating polymers is important to obtain an effective system tailored to the final application. In this way, yerba mate powders agglutinated with gums have been used as matrices to study the release rates of rebaudioside A in yerba mate teas [10]. In our research group, yerba mate lyophilized extracts were encapsulated as antioxidant delivery system to be further added to functional foods [11]. In previous work, two encapsulating systems, calcium alginate and calcium alginate-chitosan, were developed and their stability, loading efficiency and mechanical properties were studied. Chitosan is a weak cationic polysaccharide, composed mainly of (1,4) linked 2-amino-2-deoxy-D-glucan. On the other hand, alginic acid is a linear copolymer of (1,4) linked-D-mannuronic and L-guluronic acid residues arranged in a non-regular block pattern. The polyelectrolyte complex between chitosan and alginate has been widely used in order to obtain microcapsules for cell encapsulation and devices for the controlled release of drugs or other substances [12]. However, interactions between yerba mate extract and polymers can affect the release of the extract, and these have not be fully analyzed to our knowledge.
The objective of this work was to study the interactions between system components of encapsulated yerba mate extract by evaluating the microstructure of capsules through SEM observation, thermal analysis (DSC and TGA) and FT-IR studies. The extent of these interactions on extract release in a gastrointestinal model system was evaluated, as well.
2. Materials and Methods
2.1. Encapsulating Agents
The encapsulating agents used were 2% (w/v) sodium alginate (SA) (Protanal, Norway) and chitosan (CH) 0.5 % (w/v) in acetic acid (Sigma-Aldrich, USA). Hydrocolloids were characterized in the laboratory. Sodium alginate had a viscometry molecular weight of 225.8 kD, density was 0.999 ± 0.003 g/ml and intrinsic viscosity 6.15 g/dl. Chitosan molecular weight was 49.4 kD, density 0.996 ± 0.007 g/ml and intrinsic viscosity 41.98 g/dl.
2.2. Yerba Mate Extract
Freeze-dried yerba mate extract (Y) was obtained in the lab as detailed in a former work [11]. Briefly, 1 g of commercial yerba mate (Las Marías, Corrientes, Argentina) was mixed with 100 ml distilled water in a glass vessel, heated in a thermostatic bath (Haake, Germany) at 100˚C for 40 min. Then the extract was filtered, frozen at –80˚C for 24 h and lyophilized (Heto FD4, Denmark). Lyophilized extracts were put in tightly closed flasks and stored in a dissecator until further use.
2.3. Capsules Formation
Beads were obtained by mixing the active component (1% w/v) with the sodium alginate solution. Once homogenized, the alginate solution was pumped with a peristaltic pump (Apema, Argentina) and dropped through a syringe (0.80 × 25 mm) to a calcium chloride solution (0.05 M). The beads formed in this process were maintained in the gelling bath to harden for 15 min. Then, they were filtered through a Whatman #1 paper and washed with buffer solution (acetic/acetate, pH 5.5). The beads were allowed to stabilize in air for 15 min. Finally, a portion of the beads was immersed in a chitosan solution for 30 min. The capsules were dried in an oven at 65˚C for 3 h. As a summary, four types of capsules were prepared: Control capsules of Calcium Alginate (A), Control capsules of Alginate-Chitosan (ACH), Calcium Alginate capsules with yerba mate extract (AY) and AlginateChitosan capsules with yerba mate extract (ACHY).
2.4. Capsule Characterization
2.4.1. SEM Observation
SEM analysis was performed using a Jeol JSM-6360 (Japan) microscope. Capsules were attached to stubs using a twosided adhesive tape, then coated with a layer of gold (40 nm - 50 nm) and examined using an acceleration voltage of 10 kV.
2.4.2. Fourier Transform Infrared Spectrometry (FT-IR)
The employed equipment was a Nicolet 380 FT-IR (USA). Disks were obtained by milling 5 mg of sample with 100 mg of KBr and were analyzed by transmission taking 64 scans per experiment with a resolution of 4 cm-1. Analysis was performed on the following samples: pure materials, capsules with and without yerba mate extract and samples of yerba mate-chitosan complex (YCH). YCH was prepared mixing a known amount of yerba mate extract dissolved in water with a chitosan solution (0.5% w/v) in equal parts. The mixture was agitated for three hours and centrifuged 30 min at 1300 rpm (Beckman Coulter, Avanti J-25, USA). The obtained pellet was dried and analyzed.
2.5. Thermal Analysis
Thermal analysis was performed by thermo gravimetric assays (TGA) and Differential Scanning Calorimetry (DSC). The equipment used for the DSC assays was a DSC Q100 (TA Instruments, USA). Equipment calibration was performed with the Indium standard. Samples of 3 mg - 5 mg were placed in aluminum capsules hermetically sealed and an empty capsule was used as the reference. For standard thermograms samples were heated from 25˚C to 300˚C with at a heating rate of 10˚C/min. To determine the glass transition temperatures, the following protocol was performed: the temperature was stabilized at –80˚C for 3 min, then samples were heated at 10˚C/min from –80˚C to 80˚C after which an annealing of 30 min was applied and finally samples were heated at 5˚C/min from 80˚C to 120˚C. In samples containing chitosan, the last heating ramp was performed at 5˚C/min from 80˚C until 180˚C after which a second annealing of 30 min was performed. At last, a heating ramp at 5˚C/min from 180˚C to 300˚C was applied.
In TGA studies (DTG 60, Shimadzu, Japan), samples were placed in closed aluminum capsules under a nitrogen flow of 50 ml/min. The range of temperatures scanned was from 20˚C to 600˚C with a heating rate of 10˚C/min.
Extract Release in Simulated Gastrointestinal Fluids
The content of extract released from beads was determined by sinking a known amount of capsules in the release media while agitating in an Orbit-Environ Shaker (LabLine Instruments, USA) at 125 rpm. The release media used were in vitro model digestion fluids: Simulated Gastrointestinal Fluid, SGF, (3 h at 37˚C) followed by immersion in Simulated Intestinal Fluid, SIF, (3 h at 37˚C). SGF was prepared from a solution of hydrochloric acid 0.1 M (Anedra, Argentina) corrected with sodium hydroxide to pH = 2, and SIF from Sorensen’s phosphate buffer (pH 7.5).
The amount of extract released, determined as polyphenol content, was calculated with the following equation:
 (1)
(1)
where E is the amount of extract determined in the release medium and Eo is the initial amount of extract in the capsules. Eo for each type of capsule corresponded to the mass of polyphenols detected after capsule disintegration with sodium citrate (10% w/v) during 24 h at 25˚C [11].
Total polyphenols content was determined by the Folin-Ciocalteau method [13]. Two ml of Na2CO3 (2% w/v) (Anedra, Argentina) were mixed with 200 ml of the sample and 200 ml of Folin-Ciocalteau reagent (Anedra, Argentina, 1:1 diluted). Sample absorbance was measured at 725 nm in a spectrophotometer (Shimadzu, UV-mini 1240, Japan) after 30 min of reaction.
3. Results and Discussion
3.1. SEM Observation
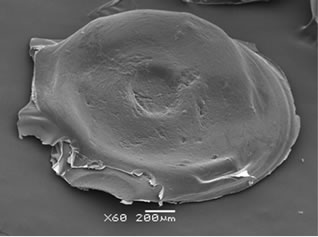
Calcium alginate beads with and without a chitosan layer were obtained to protect the antioxidants properties of the yerba mate extract. Figure 1 shows SEM micrographs of the yerba mate encapsulated beads. AY capsules exhibited zones with striped surfaces attributed to the calcium alginate structure (Figure 1(a)). The presence of a chitosan layer was revealed by SEM analysis. Chitosan coated capsules appeared to be smoother than the calcium-alginate ones (Figure 1(b)). Although ACHY capsules still showed striped surfaces, they seemed sleeker due to the chitosan layer (Figure 1(b)). The vacuum needed for the SEM analysis helped visualize the separation of the chitosan layer on portions of the samples (Figures 1(b)
 (a)
(a)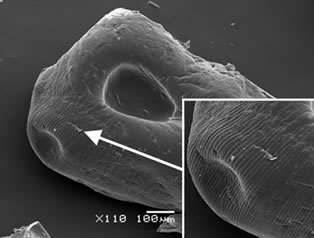 (b)
(b)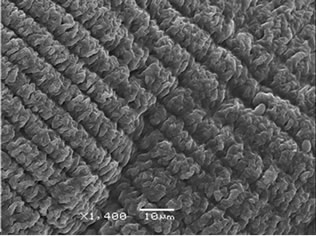 (c)
(c)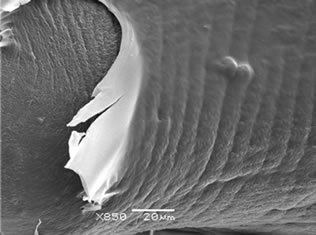 (d)
(d)
Figure 1. SEM microphotographs of (a) AY capsules and (b), (c) and (d) ACHY capsules.
and (c)). Figure 1(d) shows the exposed surface of calcium alginate with the chitosan layer removed.
3.2. Fourier Transform Infrared Spectrometry (FT-IR)
The spectrum of yerba mate extract (Figures 2 and 3) had the characteristic bands of typical polyphenols. A broad
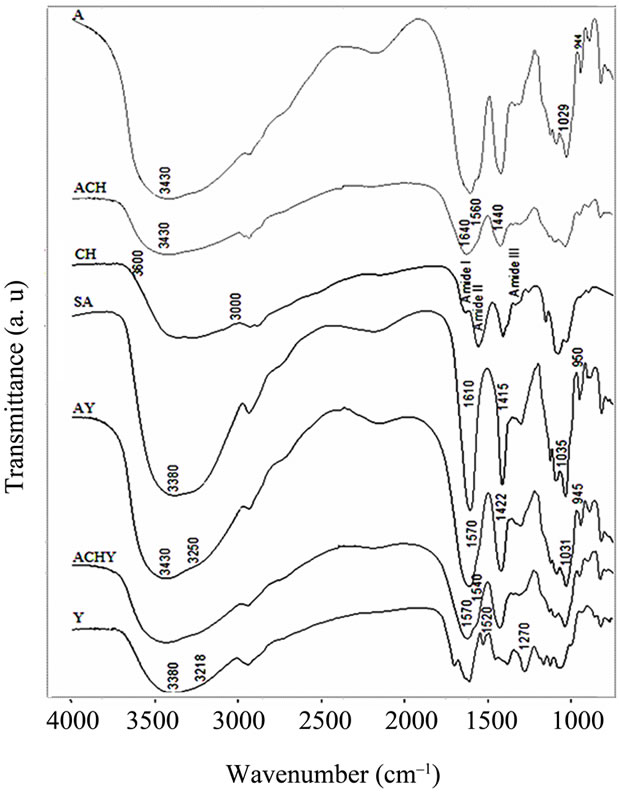
Figure 2. FT-IR spectra of lyophilized yerba mate extract, pure hydrocolloids films and capsules. Y: Yerba mate extract, SA: Sodium Alginate, CH: Chitosan, A: Control capsules of Calcium Alginate, ACH: Control capsules of Alginate-Chitosan, AY: Calcium Alginate capsules with yerba mate extract and ACHY: Alginate-Chitosan capsules with yerba mate extract.
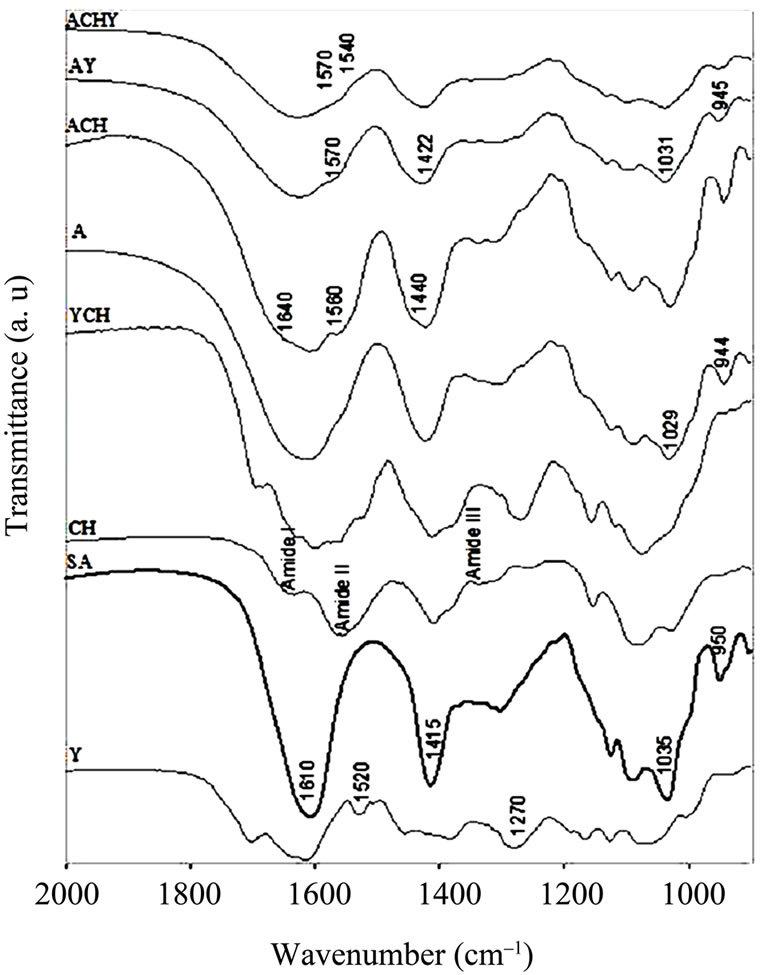
Figure 3. FT-IR spectra in the 2000 - 900 cm–1 region of Y: Yerba mate extract, SA: Sodium Alginate, CH: Chitosan, YCH: Yerba mate-Chitosan complex, A: Control capsules of Calcium Alginate, ACH: Control capsules of AlginateChitosan, AY: Calcium Alginate capsules with yerba mate extract and ACHY: Alginate-Chitosan capsules with yerba mate extract.
band centered around 3380 cm–1 assigned to the stretching modes of O-H groups and a shoulder at 3218 cm–1 that corresponds to the hydroxyl groups involved in an intermolecular hydrogen bond were observed.
Besides, peaks at 1520 cm–1 attributed to the C = C vibration of an aromatic ring were also seen, as well as the C-O stretching band at 1270 cm–1. Other hydroxyl-related bands were observed between 1160 and 1070 cm–1.
When control capsules of calcium alginate were formed, the sodium alginate O-H stretching band at ≈3380 cm–1 shifted to 3430 cm–1. By comparing absorbance spectra, it could be observed that this band grew in intensity. In contrast, the O-H shoulder at 3250 cm–1 did not appear to be modified. The modification of the 3380 cm–1 band was attributed to intramolecular bonding, whereas the shoulder at 3250 cm–1 was related to intermolecular binding [14].
In the chitosan capsules (ACH), the 3430 cm–1 band became a little broader. However, this effect could be associated to a contribution of the pure chitosan, in which the O-H and N-H stretching bands overlapped in the 3600 - 3000 cm–1 region [15]. In the capsules containing yerba mate extract (AY, ACHY), the 3430 cm–1 O-H stretching band became slightly narrower, probably due to the breaking of some intermolecular interactions.
The sodium alginate COO– peaks at ≈1610 and 1415 cm–1 (asymmetric and symmetric stretch, respectively) became broader in all the capsules, with and without the extract. The latter exhibited a large shift to high wavenumbers (from 1415 to 1422 cm–1). As this was a specific ion binding peak, when calcium ions replace sodium ions in the alginate blocks, a new environment around the carbonyl group was created [14]. Since calcium alginate beads have free carboxylic groups, interaction with the amino groups of the chitosan molecule was highly expected. Accordingly, when chitosan was present in the capsules, important changes appeared in the spectra. Smitha, Sridhar & Khan [16] assigned the shoulder observed at about 1640 cm–1 to a symmetric -NH3C deformation. The shoulder at 1560 cm–1 could be assigned to the sum of two effects: chitosan Amide II band and the interaction between alginate and the amino group of the chitosan.
A shoulder is also observed at 1440 cm–1 with a decrease in the 1422 cm–1 band. This effect could be attributed to the replacement of some Ca+2 ions for amino groups of the chitosan around the carbonyl group. The bands observed at 1035 and 950 cm–1 assigned to sodium alginate C-O stretching, shift to 1031 and 945 cm–1 in the calcium alginate beads and to 1029 and 944 cm–1 in the chitosan-coated capsules.
The most important change on the spectra of the capsules containing yerba mate was the shoulder observed between 1540 and 1570 cm–1, assigned to the interaction of different polar groups of the active compound with the hydroxyl or carboxylate groups of the alginate (Figures 2 and 3). Likewise, Kosaraju, D’ath & Lawrence [17], when studying the incorporation of olive leaf extract in chitosan capsules, attributed the signals observed at these wavenumbers to interactions between hydroxyl/carbonyl/aldehyde groups of the extract and the amine groups of the chitosan.
To magnify the possible interactions between polyphenol from yerba mate and chitosan, both components were mixed. Figure 3 shows the FT-IR spectrum of yerba matechitosan complex, where changes attributed to the interaction between extract polyphenols and the polymer were observed. A new peak at 1598 cm–1 was detected, emerging from the shift of the peaks at 1556 cm–1 in chitosan and at 1607 cm–1 from yerba mate extract (Figure 3).
Xiang & Ning [18] studied the structure of chlorogenic acid by FTIR, indicating that the peak at 1607 cm–1 corresponded to the -CO-C = Cgroup. Taking into account that chlorogenic acid is the major component of yerba mate extract, the emerging peak could be explained by the interaction between this group and chitosan.
3.3. Thermal Analysis
The yerba mate extract showed only an endothermic transition at 85˚C (Figure 4), which is very broad probably due to the great diversity of compounds present in the extract. Calcium alginate capsules with and without extract (AY, A) showed three characteristics peaks, two endothermic ones around 132 and 206˚C and one exothermic at 267˚C. When the extract was present in the capsules, the peak at 132˚C was shifted to lower temperatures. According to Zhang & Kosaraju [19], this change, as well as the shoulder observed between 1540 and 1570 cm–1 in FT-IR spectrum, would indicate interactions between polymer and polyphenols.
In capsules with the chitosan layer, either with or without extract, a peak temperature shift was observed on the second exothermic peak of calcium alginate. This fact could be attributed to the formation of a polyelectrolyte complex, independent of the presence of yerba mate extract. Smitha et al. [16], while studying alginate-chitosan complex as interchange membranes, found similar results: an endothermic peak around 200˚C, assuming the formation of amide linkages in an ionic complex structure (-COO– + NH3+). Wong, Chan, Kho & Sia Heng [20] also found this peak in capsules prepared similarly to the ones obtained in the present work.
Glass transition temperature (Tg) helps to predict capsule stability during storage. An amorphous state would facilitate the mobility of encapsulated polyphenols, loosing their antioxidant activity or allowing their interaction with
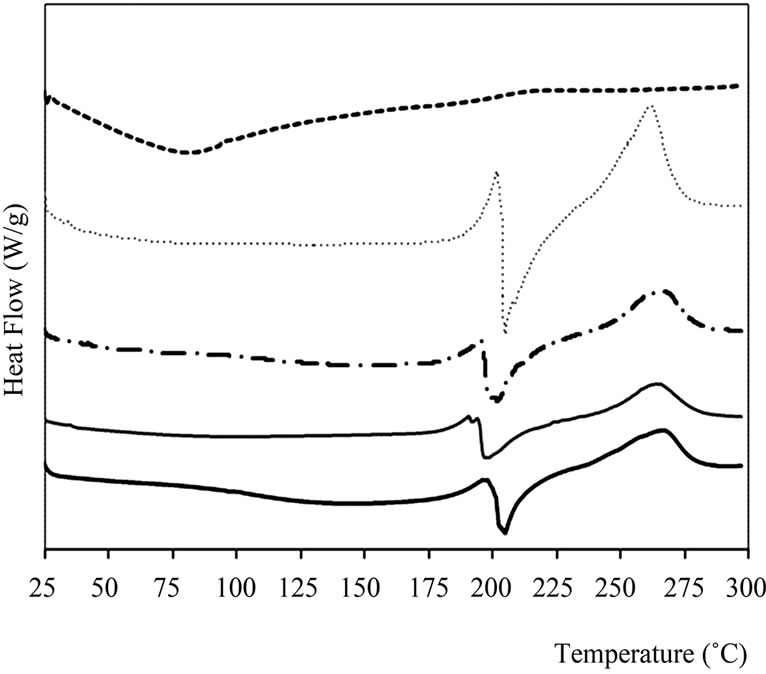
Figure 4. Thermograms obtained by DSC for pure materials and capsules. A: Control capsules of Calcium Alginate, ACH: Control capsules of Alginate-Chitosan, AY: Calcium Alginate capsules with yerba mate extract and ACHY: Alginate-Chitosan capsules with yerba mate extract.
other components when present in a complex food. In the thermograms of calcium alginate capsules (Table 1), two changes in heat capacity were observed, indicating the presence of two glass transitions. Whereas, in chitosan coated capsules only one glass transition was determined.
The annealing performed 10˚C below Tg, helped visualize the transition, since molecules received enough energy for their arrangement.
As observed in Table 1, all glass transitions were determined at temperatures higher than ambient, which would lead to satisfactory product stability. Oxygen diffusion that alters the stability of antioxidant and bioactive compounds is limited in the glassy state. However, an increase in temperature or ambient humidity could turn the capsules into a rubbery matrix accelerating the diffusion process [17].
Influence of the active compound was only evidenced at Tg1, which could be due to a preferential distribution of antioxidant extract within the capsule. This transition in AY capsules was lower than in capsules without extract (A), probably due to the plasticizing effect of yerba mate extract (Table 1). The lyophilized extract would be located in amorphous zones, with greater mobility.
The second glass transition temperature (Tg2) was found around 100˚C (Table 1) and could be associated with the egg-box structure of calcium alginate, an ordered structure with more hydrogen bonds inside the gel. This transition was observed in all samples independent of chitosan and yerba mate extract presence.
Kumar Naidu, Sairam, Raju & Aminabhavi [21] and Miura, Kimura, Suzuki, Miyashita & Nishio [22] reported Tg values for sodium alginate around 120˚C. However, for chitosan, several Tg values were informed. This variability could be attributed to factors like physiccal state, molecular weight and deacetylation degree, DD [19]. Abdel-Fattah, Jiang, El-Tabie El-Bassyouni & Laurencin [23] found Tg at 129˚C for chitosan with a DD of 79%, similar to that determined in the present work. Other reported values were between 170˚C and 180˚C for chitosan with 78% DD [24] and 203˚C for a chitosan of 96% DD [25]. Considering the above-cited literature
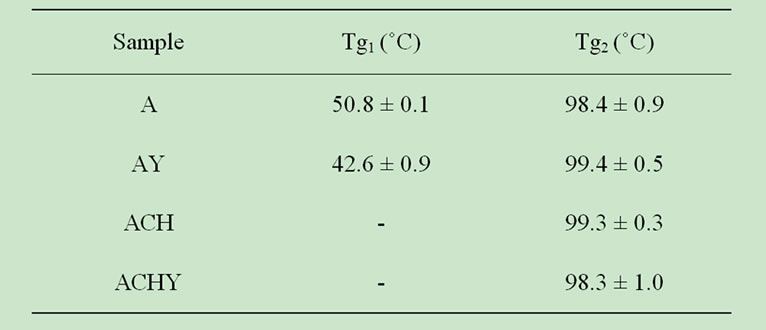
Table 1. Glass transition temperatures (Tg) found by DSC measurements.
values, none of the reported Tg values could be assigned to chitosan in the present work. Similarly, Zhang & Kosaraju [19] did not assign any Tg to chitosan when studying biopolymeric systems for polyphenolic transport.
The results of weight loss in TGA analysis are shown in Table 2. Both types of capsules, with and without chitosan, exhibited a two step decomposition process. Initial minor weight loss was attributed to desorption of moisture, corresponding to water hydrogen bounded to the saccharide structure common to both polymeric systems [26]. The presence of neither chitosan nor yerba mate extract significantly affected the shape of the curves.
Thermal data of capsules analyzed by TGA was consistent with their DSC behavior. Initially, by increasing temperature, the samples lost weight until about 160˚C (Table 2). Accordingly, DSC measurements show the first endothermic peak below 150˚C (Figure 4).
Higher temperatures provoked an abrupt weight loss up to 250˚C, close to the second endothermic peak observed in the DSC curves. Smitha et al. [16] assigned this weight loss at 260˚C to the thermal degradation of alginate-chitosan complex.
3.4. Extract Release in Simulated Fluids
In response to the hypothesized objectives, the release of polyphenols into simulated gastrointestinal fluids was determined to study the effect of polymer-polymer and extract-polymer interactions on extract release. Table 3 shows the percentages of extract released into each simulated fluid. The presence of the external chitosan layer reduced the percentage of polyphenols released in SGF and throughout the entire in vitro system (SGF + SIF). In a previous work [11], the chitosan layer showed a similar effect when encapsulated yerba mate extracts were released into water.
The majority of the polyphenols content was released into simulated gastrointestinal fluid for coated and uncoated capsules (Table 3). Taking into account the total polyphenols mass released in both simulated mediums (SGF + SIF), the AY capsules released around 10% into intestinal fluid while the ACHY capsules released 20%. The lower polyphenols content released throughout the entire in vitro model system for chitosan coated capsules could be attributed to a higher stability of the polyphenolchitosan interactions when compared to polyphenol-alginate ones. These results indicate that chitosan may act as a barrier for yerba mate extract release. Thus, the applied chitosan layer would protect polyphenols from the SGF, allowing them to reach the SIF at higher quantity, where they would be released in turn. This system would be useful for capsules with specific delivery purposes.
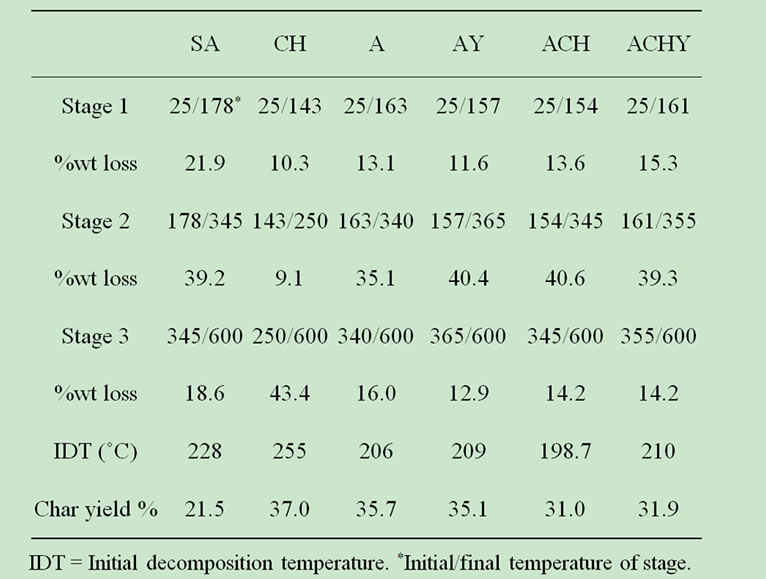
Table 2. TGA data for pure compounds and capsules.
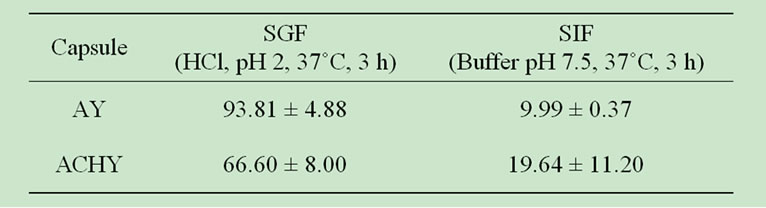
Table 3. Extract released (%) in different mediums.
4. Conclusions
Calcium alginate beads coated with chitosan were prepared as an encapsulating system for protecting polyphenols compounds from yerba mate extracts. The formation of alginate-chitosan complex, as expected for their oppositely charged groups, was confirmed in this work by DSC, TGA and FT-IR. Interaction between the yerba mate polyphenols and the calcium alginate matrix was evidenced by a decrease in the glass transition temperature and changes in the FT-IR spectra. Also, an interaction between yerba mate polyphenols and chitosan was observed through FT-IR, suggesting the formation of a polyphenol-chitosan complex.
These results explained the difference between the release from the coated and the non-coated capsules throughout the entire in vitro system. The interactions between the polyphenols and the calcium alginate seem to be weak enough to allow almost all of the polyphenol to be released into the simulated gastrointestinal fluid. On the contrary, the stronger interactions in the polyphenols-chitosan complex of the coated beads resulted in a more stable system, and therefore a lower polyphenols release was observed. Thermal analysis (DSC and TGA) showed that decomposition temperatures of both encapsulation systems are higher than the food preparation and consumption temperatures, allowing their use in the food industry.
5. Acknowledgements
Authors would like to thank to Eng. Christopher Young for checking English language.
6. References
[1] R. Filip, P. López, G. Giberti, J. Coussio and G. Ferraro, “Phenolic Compounds in Seven South American Ilex Species,” Fitoterapia, Vol. 72, No. 2, 2001, pp. 774-778. doi:10.1016/S0367-326X(01)00331-8
[2] P. Dugo, F. Cacciola, P. Donato, R. Assis Jacques, E. Bastos Caramão and L. Mondello, “High Efficiency Liquid Chromatography Techniques Coupled to Mass Spectrometry for the Characterization of Mate Extracts,” Journal of Chromatography A, Vol. 1216, No. 43, 2009, pp. 7213-7221. doi:10.1016/j.chroma.2009.08.030
[3] S. Chandra and E. Gonzalez de Mejía, “Polyphenolic Compounds, Antioxidant Capacity, and Quinone Reductase Activity of an Aqueous Extract of Ardisia compressa in Comparison to Mate (Ilex paraguariensis) and Green (Camellia sinensis) Teas,” Journal of Food Agriculture, Vol. 52, No. 11, 2004, pp. 3583-3589. doi:10.1021/jf0352632
[4] N. Bracesco, M. Dell, A. Rocha, S. Behtash, T. Menini, A. Gugliucci and E. Nune, “Antioxidant Activity of Botanical Extract Preparation of Ilex Paraguariensis: Prevention of DNA Double-Strand Breaks in Sacharomyces cerevisiae and Human Low Density Lipoprotein Oxidation,” The Journal of Alternative and Complementary Medicine, Vol. 9, No. 3, 2003, pp. 379-387. doi:10.1089/107555303765551606
[5] A. Gugliucci and A. J. Stahl, “Low Density Lipoprotein Oxidation is Inhibited by Extracts of Ilex Paraguariensis,” Biochemical and Biophysical Research Communications, Vol. 224, 1995, pp. 338-344. doi:10.1006/bbrc.1996.1030
[6] N. Lunceford and A. Gugliucci, “Ilex Paraguariensis Extracts Inhibit AGE Formation More Efficiently Than Green Tea,” Fitoterapia, Vol. 76, No. 5, 2005, pp. 419- 427. doi:10.1016/j.fitote.2005.03.021
[7] T. Andersen and J. Fogh, “Weight Loss and Delayed Gastric Emptying Following a South American Herbal Preparation in Overweight Patients,” Journal of Human Nutrition and Dietetics, Vol. 14, 2001, pp. 243-250. doi:10.1046/j.1365-277X.2001.00290.x
[8] C. P. Champagne and P. Fustier, “Microencapsulation for the Improved Delivery of Bioactive Compounds into Foods,” Current Opinion Biotechnology, Vol. 18, 2007, pp. 184-190. doi:10.1016/j.copbio.2007.03.001
[9] F. Shahidi and X. Q. Han, “Encapsulation of Food Ingredients,” Critical Reviews in Food Science and Nutrition, Vol. 33, No. 6, 1993, pp. 501-547. doi:10.1080/10408399309527645
[10] G. P. Scipioni, D. J. Ferreyra, M. G. Acuña and M. E. Schmalko, “Rebaudioside A Release from Matrices Used in a Yerba Mate Infusion,” Journal of Food Engineering, Vol. 100, 2010, pp. 627-633. doi:10.1016/j.jfoodeng.2010.05.011
[11] L. Deladino, P. S. Anbinder, A. S Navarro and M. N. Martino, “Encapsulation of Natural Antioxidants Extracted from Ilex Paraguariensis,” Carbohydrate Polymers, Vol. 71, No. 3, 2008, pp. 126-134. doi:10.1016/j.carbpol.2007.05.030
[12] L. Becherán-Marón, C. Peniche and W. Argüelles-Monal, “Chitosan and Alginate Polyelectrolyte Complex: Influence of Alginate Composition and Chitosan Molecular Weight,” International Journal of Biological Macromolecules, Vol. 34, No. 1-2, 2004, 127-133.
[13] K. Schlesier, M. Harwat, V. Böhm and R. Bitsch, “Assessment of Antioxidant Activity by Using Different in vitro Methods,” Free Radical Research, Vol. 36, No. 2, 2002, pp. 177-187. doi:10.1080/10715760290006411
[14] C. Sartori, D. S. Finch, B. Ralph and K. Gilding, “Determination of the Cation Content of Alginate Thin Films by FT-IR Spectroscopy,” Polymers, Vol. 38, No. 1, 1997, pp. 43-51. doi:10.1016/S0032-3861(96)00458-2
[15] H. Y. Zhou, X. G. Chen, M. Kong, C. S. Liu, D. S. Cha and J. F. Kennedy, “Effect of Molecular Weight and Degree of Chitosan Deacetylation on the Preparation and Characteristics of Chitosan Thermosensitive Hydrogel as a Delivery System,” Carbohydrate Polymers, Vol. 73, 2008, pp. 265-273. doi:10.1016/j.carbpol.2007.11.026
[16] B. Smitha, S. Sridhar and A. A. Khan, “Chitosan-Sodium Alginate Polyion Complexes as Fuell Cell Membranes,” European Polymer Journal, Vol. 41, 2005, pp. 1859- 1866. doi:10.1016/j.eurpolymj.2005.02.018
[17] S. L. Kosaraju, L. D’ath, and A. Lawrence, “Preparation and Characterisation of Chitosan Microspheres for Antioxidant Delivery,” Carbohydrate Polymers, Vol. 64, No. 4, 2006, pp. 163-167. doi:10.1016/j.carbpol.2005.11.027
[18] Z. Xiang and Z. Ning, “Scavenging and Antioxidant Properties of Compound Derived from Chlorogenic Acid in South-China Honeysuckle,” LWT-Food Science and Technology, Vol. 41, 2008, pp. 1189-1203.
[19] L. Zhang and S. L. Kosaraju, “Biopolymeric Delivery System for Controlled Release of Polyphenolic Antioxidants,” European Polymer Journal, Vol. 43, No. 7, 2007, pp. 2956-2966. doi:10.1016/j.eurpolymj.2007.04.033
[20] T. W. Wong, L. W. Chan, S. B. Kho and P. W. Sia Heng, “Design of Controlled-Release Solid Dosage Forms of Alginate and Chitosan Using Microwave,” Journal of Controlled Release, Vol. 84, 2002, pp. 99-114. doi:10.1016/S0168-3659(02)00237-7
[21] B. V. Kumar Naidu, M. Sairam, K. V. S. N. Raju and T. M. Aminabhavi, “Thermal, Viscoelastic, Solution and Membrane Properties of Sodium Alginate/Hydroxyethylcellulose Blends,” Carbohydrate Polymers, Vol. 61, No. 1, 2005, pp. 52-60. doi:10.1016/j.carbpol.2005.02.007
[22] K. Miura, N. Kimura, H. Suzuki, Y. Miyashita and Y. Nishio, “Thermal and Viscoelastic Properties of Alginate/Poly(vinyl alcohol) Blends Cross-Linked with Calcium Tetraborate,” Carbohydrate Polymers, Vol. 39, No. 2, 1999, pp. 139-144. doi:10.1016/S0144-8617(98)00162-3
[23] W. I. Abdel-Fattah, T. Jiang, G. El-Tabie El-Bassyouni and C. T. Laurencin, “Synthesis, Characterization of Chitosans and Fabrication of Sintered Chitosan Microsphere Matrices for Bone Tissue Engineering,” Acta Biomaterialia, Vol. 3, 2007, pp. 503-514. doi:10.1016/j.actbio.2006.12.004
[24] M. Mucha and A. Paulak, “Thermal Analysis of Chitosan and Its Blends,” Thermochimica Acta, Vol. 427, No. 1-2, 2005, pp. 69-76. doi:10.1016/j.tca.2004.08.014
[25] K. Sakurai, T. Maegawa and T. Takahashi, “Glass Transition Temperature of Chitosan and Miscibility of Chitosan/Poly(N-Vinyl Pyrrolidone) Blends,” Polymer, Vol. 41, No. 19, 2000, pp. 7051-7056. doi:10.1016/S0032-3861(00)00067-7
[26] M. J. Zohuriaan and F. Shokrolahi, “Thermal Studies on Natural and Modified Gums,” Polymer Testing, Vol. 23, No. 5, 2004, pp. 575-579. doi:10.1016/j.polymertesting.2003.11.001