American Journal of Operations Research
Vol.05 No.04(2015), Article ID:57908,13 pages
10.4236/ajor.2015.54023
Factor and Cluster Analysis as a Tool for Patient Segmentation Applied to Hospital Marketing in Jordan
Lamees M. Al-Durgham, Mahmoud A. Barghash
Industrial Engineering Department, Faculty of Engineering and Technology, The University of Jordan, Amman, Jordan
Email: l.aldurgham@ju.edu.jo, mabargha@ju.edu.jo
Copyright © 2015 by authors and Scientific Research Publishing Inc.
This work is licensed under the Creative Commons Attribution International License (CC BY).
http://creativecommons.org/licenses/by/4.0/


Received 30 May 2015; accepted 11 July 2015; published 14 July 2015
ABSTRACT
Hospital marketing is becoming important for the survival and the prosperity of the health service. In addition, it indirectly acts as a formal feedback channel for the customer requirements, preferences, suggestions and complaints. In this work we have undertaken a survey based marketing study for two main objectives: The first being to better understand the patient clusters through k-means clustering and the second to understand customer perception of the different known quality perspectives through factor rotated and unrotated analysis. All of the questionnaires were designed according to international studies. Based on general descriptive statistics, items classified with higher variance but important, are: clean environment, doctors and nurses capabilities, and specialized doctors. Items that are less important with low variance are: food type, lighting and insurance. Also, items classified as more important with low variance are: recommended, no mistakes, and the cost. Using factor analysis rotated and unrotated reduced the variables into five main variables described as: medical aspects, psychological aspects, cost aspects, hospital image and ease of access and procedures. Using k-means clustering, the customers can be clustered into four main clusters with two of them described as general patient with wide variety of interest, serious cases interested in specialized doctors and food, and very serious case with high stress on equipment, no mistakes.
Keywords:
Hospital Marketing, Factor Analysis, Clustering, Patient Segmentation, Customer Satisfaction

1. Introduction
It is argued that in the health care industry, increase in competitive pressures results in hospitals competing on the quality dimension [1] . In that respect, hospital competition might lead to better service and better efficiency. The improvement of efficiency over time is an indicator that hospitals have succeeded in their strategies to decrease the level of operational wastage in health care operations [2] . There are two consequences of competition among hospitals. One, in the absence of price competition, hospitals would perhaps compete on the quality dimension. This may lead to more resource consumption and hence lower efficiency. Two, increased competition should result in changes in demand, which would result in lower efficiency for those who are not able to attract patients, and higher efficiency for those who do [3] . Customer satisfaction is extremely important in highly competitive marketplace. Satisfaction is a person’s feeling of pleasure or disappointment resulting from campaigning a product’s perceived performance (or outcome) in relation to expectation. If the performance or expectations fall short, the customer is dissatisfied; if the performance matches the expectations, the customer is satisfied; if the performance exceeds expectation, the customer is highly satisfied or delighted [4] . Patients’ satisfaction may drive for both changes in hospitals and for a better understanding of customer perception of quality through marketing studies.
It is becoming difficult for hospitals these days to depend on mere word of mouth promotion to attract patients, so hospital managements are putting extra effort in carving a brand image of the hospital and improving hospitals’ visibility. In other words, many would agree that hospital marketing has evolved from being subtle to aggressive. Marketing is the management process that seeks to maximize returns to shareholders through developing relationships with valued customers and creating a competitive advantage [5] . The marketing concept came into use at the end of the 1940s (e.g., [6] -[13] ). Marketing duality with respect to customers and businesses is also referred to in various definitions of marketing [14] . Marketing can be looked as the art of attracting and keeping profitable customers [15] . A company should not try to pursue and satisfy every customer [16] .
Discussions of the role of marketing within organizations generally revolve around two perspectives (e.g., [17] -[20] ). The first is a functional group perspective, which views marketing as an individual and distinct organizational entity (e.g., the marketing department); the second is an activity-based perspective, where marketing is treated as a set of activities undertaken by different people throughout the whole organization (e.g., market orientation as the responsibility of everyone). Research has typically separated the two approaches; for example, Hunt (1976) [21] took an activity based perspective, while Walker et al. (1987) [22] provided an example of the application of a functional group approach. More recently, the two perspectives have also been integrated [23] -[27] .
A main component of marketing research is market segmentation and customer clustering. Clustering is an important mathematical tool for customer segmentation. Clustering is the problem of grouping objects on the basis of a similarity measure among them [28] . Relational clustering methods can be employed when a feature- based representation of the objects is not available, and their description is given in terms of pairwise (dis)simi- larities [28] . Clustering focuses on grouping objects on the basis of a similarity measure among them. It occurs very often in different disciplines and research areas. In some clustering applications, it is not possible to have a feature-based representation of the objects, and the description is given in terms of pairwise (dis)similarities. Some approaches have been proposed to cluster objects represented in this way, and are referred to as relational clustering methods [28] .
Factor analysis is a method of exploring relationships among observed parameters. Several research works utilized principle component factor analysis and varimax rotating methods to extract factors related to hospital service quality [29] . The recommended first step in developing the measurement model is to examine several potentially meaningful structures in the data collected from former patients. Exploratory factor analysis (EFA) is commonly viewed as the best analytical tool for this purpose [30] [31] . International market segmentation has become an important issue in developing, positioning, and selling products. It helps companies to target potential customers at the international-segment level and to obtain an appropriate positioning [32] . Segmentation is therefore particularly important in enterprises that wish to develop and implement successful global marketing strategies [32] . Despite the obvious importance of international market segmentation for marketing as a discipline in general and international marketing in particular, it has received relatively little attention. In the literature a small percentage of papers dealt directly with international market segmentation [32] [33] . Segmentation is important to choose the most appropriate marketing strategies that better fit the interests of each segment [34] especially if segments can be characterized in terms of demographic characteristics [35] or even quality label and perceptions [36] . The importance of the segmentation of consumers has been proved in several studies [34] [36] -[42] .
In this work we have applied customer segmentation to patients in Jordan through questionnaire result analysis for the purpose of identifying separate customer clusters and their requirements in hospitals. We also applied factor analysis to identify the important factors in customer requirements.
2. Mathematical Model
2.1. Factor Analysis
Factor analysis is related to the analysis of observable. If Xi is an observable trait. These 
with mean vector . Let
. Let  be the unobservable common factors.
 or (1)
or

and

or

where lij: factor loadings;
εi: independently distributed error terms with zero mean and finite variance;
F: the matrix .
.
The communalities for the ith variable are computed by taking the sum of the squared loadings for that variable. This is expressed as
 (2)
(2)
The sample variance-covariance matrix and is expressed as
 (3)
(3)
applying from (1) into (3)


Then
 (4)
(4)
We can’t actually calculate U until we know, or have to guess as to . A reasonable and common starting- point is to do a linear regression of each feature j on all the other features, and then set
  to the mean squared error for that regression.
 (5)
(5)
Through eigenvalue representation
 (6)
(6)
We can represent the matrices as:

And thus

Applying into (5) gives
 (7)
(7)
In summary, we have collected our eigenvectors into a matrix, but for each column of the matrix we will multiply it by the square root of the corresponding eigenvalue. This will now form our matrix L of factor loading in the factor analysis.
Factor rotation is motivated by the fact that these factor models are not unique. The rotated factor model is expressed as
 (8)
(8)
where  and
and  where
where .
.
Varimax rotation is the most common of the rotations that are available which maximizes this quantity:
 . (9)
. (9)
We can then re-estimate the rotated loadings and matrices. Following to that we can find the vector of common factors for subject i, or  by minimizing the sum of the squared residuals:
 (10)
(10)
 (11)
(11)
2.2. k-Means Clustering Analysis
Clustering uses a set of input variables  for example columns in a survey to classify them into clusters. k-means clustering aims to partition this data and following to that the population filling the questionnaire into k (≤n) sets
  so as to minimize the within-cluster sum of squares namely:
 (12)
(12)
where μi is the mean of points in Si.
We assume first a random k means  as centers of the clusters at the ith iteration.
Then we assign each point (customer) to one of the means Eucliden distance.
 (13)
(13)
We then re-estimate the mean of the clusters
 (14)
(14)
The algorithm has converged when the assignments no longer change.
3. Results and Discussion
This section includes description of the questionnaire used (Section 3.1), general quantitative analysis is included in Section 3.2, factor analysis is described in Section 3.3, finally the clustering is in Section 3.4.
3.1. Questionnaire
The design of the questionnaire used in this study is as in Table 1, the first column in the questionnaire contains question number, the next column contains the questions, the questionnaire contains 19 questions, the questions cover different variables related to the location, the calmness and cleanness of the surrounding environment, the availability of parking, the cost and quality of the service, the accuracy of the medical procedures, the availability of specialized doctors and nurses, the popularity of the hospital among people, etc. the last column in the questionnaire is divided into ten columns with scales from 1 to 10, and it is required to fill only one from the 10 choices for each question.
We have distributed questionnaires to different people in different geographical location, and we got the results presented in this work.
3.2. General Quantitative Analysis
Table 2 contains the descriptive statistics for all the variables under investigation. It seems that all average values are around 5 which shows conflicting responses for all of the patients. High variance shows more disputed

Table 1. Marketing questionnaire used in this work.
Table 2. Variance explained for each attribute/object in 3-dimensional map.
categories, clean environment, doctors capability, and nurses capability, and specialized doctors. The explanation for the higher variance of these variables might be explained as a difference in responses between patient with critical cases for example the patient who wants to do an operation, and the patients doing routine hospital visits i.e. patients with simple procedure.
Low variances reflect low dispute, there is less dispute that the food type, the lighting, and the insurance are relatively less important to patients, on the other hand there is less dispute that the recommended, no mistakes, and the cost are relatively more important.
3.3. Factor Analysis
SPSS software was used to conduct factor analysis. Communality shows how much each attribute is explained by the factors. Table 3 is the table of communalities which shows how much of the variance in the variables has been accounted for by the extracted factors. Table 3 illustrates that all communalities are considered to be of high values for the 19 attributes, so the 19 attributes will be taken and considered for the next explanations.
According to Equation (1) communalities are calculated as the sum of the loadings of the variables which are calculated after removing the static mean (m) and the noise factor (e). Thus it reflects better the importance of the different variables to the patients. Variables with higher communalities are considered more important to the patients, namely no mistakes, interior design, the environment of the hospital, and the cost of service. Insurance, parking, and recommended are considered less important by the patients.
Table 4 shows the rotated matrix factor analysis. Column 1 is the factor where the initial number of factors is the same as the number of variables used in the factor analysis. Column 2 is the initial eigenvalues, eigenvalues are the variances of the factors. Column 2 contains three columns the first one is the total, the second one is the % of variance, and the last one is the cumulative %. The first one which is the total contains the eigenvalues. The
Table 3. Communalities generated by SPSS factor analysis.
Extraction method: Principal component analysis.
first factor will always account for the most variance (and hence have the highest eigenvalue), and the next factor will account for as much of the left over variance as it can, and so on. The second one which is the % of variance this column contains the percent of total variance accounted for by each factor. The last column is % of variance this column contains the cumulative percentage of variance accounted for by the current and all preceding factors. Next the table contains the rotation sums of squared loadings column the values in this panel of the table represent the distribution of the variance after the varimax rotation.
Table 4 shows that 74.138% of variance is explained by the 5 factors from the whole data, which is a representative result considering the sample size of 1000 respondents. The first factor explains about 20.274%, the second explains 15.308%. The third factor has a variance of 14.16%, the forth and the fifth factors explain the rest of the data.
The Scree plot graphs the eigenvalue against the factor number. Figure 1 shows the Scree plot generated by the SPSS. From the Scree plot, it is known that SPSS software as a default takes the components which have an Eigen values above 1.
Component 5 has Eigen value of 0.992, so it can be included also. Then that bring us with 5 components/ factors which is reliable with 74.138%.
Table 4 shows the rotated component matrix generated by SPSS software. The 19 attributes are reduced into 5 major factors as discussed before.
Using the marketing engineering software we obtained the results in Table 5. Based on the largest absolute values in each column we defined the factors in Table 6. For example the largest values in the first column in
Table 4. Variance of five factors.
Extraction method: Principal component analysis.
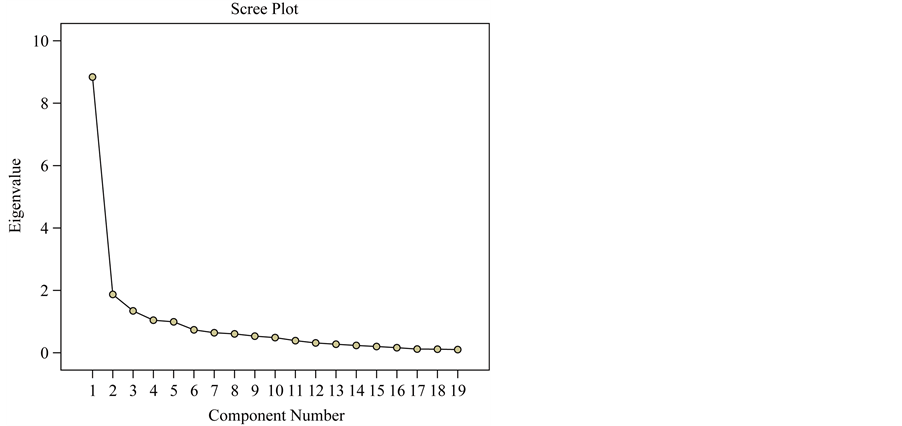
Figure 1. Scree plot for factor analysis.
Table 5. Unrotated factor analysis results.
Table 6. Factors and their major components.
Table 5 are related to no medical mistakes, doctors’ capabilities, nurses’ capabilities, calmness, clean environment, and special tests and X-rays. These components are all related to medical aspects. The largest values in the next column are related to entertainment and interior design. We proposed that these two components can be defined as the psychological aspects. The largest absolute values in the third column are from health insurance, and cost of treatment, both are components of cost aspects. From the forth column the values are related to the food service and the reputation of the hospital, we proposed that these two components are defining the image of the hospital, from the last column in Table 5, location, clean environment, parking, and quality of service are the components that have the highest absolute values, and all these components are related to ease of access and easy and quality procedures.
Table 7 shows the rotated components matrix, the idea of rotation is to reduce the number of factors on which the variables under investigation. Rotation does not actually change anything but makes the interpretation of the analysis easier.
From Table 7 we gathered the components with the maximum absolute values in each column, and defined the factor for these components in Table 8, from column 1 in Table 7. It is clear that food service, calmness, and no medical mistakes are the components with the highest values, all of these components are related to medical mistakes, quality of service, and psychological aspects.
The second column shows that reputation, and quality have the maximum values, these two components reflect the image of the hospital, from the third column it is clear that the cost of the service and the food type are the components with the highest values, they are related to the quality and the cost. The forth column in Table 7 reveals that the location of the hospital and the environment are the components with the highest absolute values, these components are related to ease of access and the psychological aspects. From the last column in Table 7 it is clear that the lighting and the interior design are the components with the highest values, these two components are related to the psychological aspects.
3.4. Clustering
The clustering analysis study are shown in Table 9 resulted in a best number of clusters to be four, taking into account the five factors resulting from the factor analysis. The confidence level was set to be 95%.
Table 7. Rotated component matrix.
Extraction method: Principal component analysis; rotation method: Varimax with Kaiser Normalization; aRotation converged in 7 iterations.
Table 8. Proposed factors and its major components.
Table 9. Clustering results.
Cluster 1 this cluster represents 64% of the sample, this cluster represents general patient while concerned about all features equally. They will be selecting a hospital with no medical mistakes is very important to them, the presence of specialized doctors, capable doctors and capable nurses in the hospital is also very important. This group seeks hospital with certain tests or X-rays. Hospital locations are of great importance to them, they also seek a calm and clean surrounding area around the hospital. It is important for them to find a parking area for their cars as well as their visiting relatives’. From their point of view, it is important that hospital offers good quality food to its in-patients, the overall quality of services is of much importance to them. They prefer hospitals with considerably good reputation. It is important to have entertainment features in the hospital room (T.V., magazines, medical brochures, etc.). It is also preferred for them if the treating physician of a patient recommends the hospital. They prefer a hospital where they are health insured. Cost of treatment is a major factor for selecting hospitals for these people. Good Food service in the cafeteria of the hospital is also important to them. The lighting of the room is very important to them, i.e. proper sunshine and good electrical lighting is important for these people.
Cluster 2, this cluster represents (7%) of the sample, it is clear that this cluster represent the patients with critical cases, since the availability of Specialized doctor in the hospital is of the highest importance for them. They also require the hospital to offer a good type food to its patients.
Cluster 3, this cluster represents (11%) of the sample, specialized equipment are of major importance to them, this cluster shares a high interest with cluster 1 in some of the attribute. The lighting of the room is very important to them, i.e. proper sunshine and good electrical lighting is important for these people. They prefer a hospital where they are health insured. Their major interest is in the interior design of the hospital room. Comfortable interior design is of high importance to them. They prefer hospitals with considerably good reputation.
The last cluster is Cluster 4 with 18% from the sample. It is clear that this cluster is for the patients with the very serious cases, a hospital known for its accurate and reliable results and no medical mistakes committed during patients’ treatment is very important to them. The presence of capable doctors and nurses in the hospital is very important to them. This cluster also share common interest with cluster 1 in some of the attributes. The cost of treatment and the presence of specialized equipment are major factors for selecting hospitals for the people in this cluster. Good Food service in the cafeteria of the hospital is also important to them.
The results acquired from the Clustering analysis model shows that the majority of the sample (64%) are interested in almost all of the attributes. That means that the chosen attributes are of great importance to many people and that they highly affect their hospitals’ choice. Clusters 2, 3 and 4 are also interested in some of the attributes which confirms the importance of these attributes to people.
4. Conclusions
From the analysis of the results we concluded the following:
1) Based on general descriptive statistics, items classified with higher variance but important, are: clean environment, doctors and nurses capabilities, and specialized doctors. Items that are less important with low variance are: food type, lighting and insurance. Also, items classified as more important with low variance are: recommended, no mistakes, and the cost.
2) Factor analysis rotated and unrotated shows that we can sum up the variable into five main variables described as: medical aspects, psychological aspects, cost aspects, hospital image and procedures.
3) Using k-means clustering: the customers can be clustered into four main clusters:
Cluster 1 (64% of the sample): this cluster represents general patients who usually select a hospital with high emphasis on no medical mistakes, specialized doctors, capable doctors and nurses, availability of certain tests, hospital locations, calm and clean surrounding area around the hospital, acceptable cost of treatment.
Cluster 2 (7% of the sample): critical cases consider availability of specialized doctor in the hospital and a good type food.
Cluster 3 (11% of the sample) considers specialized equipment, interior design, health insured and good reputation. This cluster shares a high interest with cluster 1 in some of the attribute.
Cluster 4 (18% from the sample) may represent very serious cases and consider no medical mistakes, capable doctors and nurses, cost of treatment, and the presence of specialized doctors.
Cite this paper
Lamees M.Al-Durgham,Mahmoud A.Barghash, (2015) Factor and Cluster Analysis as a Tool for Patient Segmentation Applied to Hospital Marketing in Jordan. American Journal of Operations Research,05,293-306. doi: 10.4236/ajor.2015.54023
References
- 1. Nyman, J. and Bricker, D. (1989) Profit Incentives and Technical Efficiency in the Production of Nursing Home Care. Review of Economics and Statistics, 71, 586-594.
- 2. Assaf, A.G. and Josiassen, A. (2012) Time-Varying Production Efficiency in the Health Care Foodservice Industry: A Bayesian Method. Journal of Business Research, 65, 617-625.
http://dx.doi.org/10.1016/j.jbusres.2011.02.049 - 3. Chang, H., Chang, W.-J., Das, S. and Li, S.-H. (2004) Health Care Regulation and the Operating Efficiency of Hospitals: Evidence from Taiwan. Journal of Accounting and Public Policy, 23, 483-510.
http://dx.doi.org/10.1016/j.jaccpubpol.2004.10.004 - 4. Kotler, P. and Armstrong, G. (2004) Principles of Marketing. 10th Edition, Pearson-Prentice Hall, New Jersey.
- 5. Kotler, P. and Lane, K.K. (2008) Marketing Management. 12th Edition, Pearson-Prentice Hall, New Jersey.
- 6. Ames, B.C. (1970) Trappings vs. Substance in Industrial Marketing. Harvard Business Review, 48, 93-102.
- 7. Anderson, E.W. and Mittal, V. (2000) Strengthening the Satisfaction-Profit Chain. Journal of Service Research, 3, 107-120.
http://dx.doi.org/10.1177/109467050032001 - 8. Bagozzi, R.P. (1975) Marketing as Exchange. Journal of Marketing, 39, 32-39.
http://dx.doi.org/10.2307/1250593 - 9. Felton, A.P. (1959) Making the Marketing Concept Work. Harvard Business Review, 37, 55-65.
- 10. Grønroos, C. (1990) Marketing Redefined. Management Decision, 28, 5-9.
http://dx.doi.org/10.1108/00251749010139116 - 11. Kohli, A.K. and Jaworski, B.J. (1990) Market Orientation: The Construct, Research Propositions, and Managerial Implications. Journal of Marketing, 54, 1-18.
http://dx.doi.org/10.2307/1251866 - 12. Kohli, A.K. and Jaworski, B.J. (1993) Market Orientation: Antecedents and Consequence. Journal of Marketing, 57, 50-70.
- 13. Narver, J.H. and Slater, S.F. (1990) The Effect of Market Orientation on Business Profitability. Journal of Marketing, 54, 20-35.
http://dx.doi.org/10.2307/1251757 - 14. Helgesen, Ø. (2007) Customer Accounting and Customer Profitability Analysis for the Order Handling Industry—A Managerial Accounting Approach. Industrial Marketing Management, 36, 757-769.
http://dx.doi.org/10.1016/j.indmarman.2006.06.002 - 15. Kotler, P. and Armstrong, G. (1996) Principles of Marketing. 7th Edition, Prentice-Hall, Englewood Cliffs.
- 16. Berger, P.D. and Nasr, N.I. (1998) Customer Lifetime Value: Marketing Models and Applications. Journal of Interactive Marketing, 12.
- 17. Piercy, N.F. (1986) The Role and Function of the Chief Marketing Executive and the Marketing Department: A Study of Medium-Sized Companies in the UK. Journal of Marketing Management, 1, 265-289.
http://dx.doi.org/10.1080/0267257X.1986.9963990 - 18. Varadarajan, R.P. (1992) Marketing’s Contribution to the Strategy Dialogue: The View from a Different Looking Glass. Journal of the Academy of Marketing Science, 20, 335-344.
http://dx.doi.org/10.1007/BF02725210 - 19. Webster Jr., F.E. (1992) The Changing Role of Marketing in the Corporation. Journal of Marketing, 56, 1-17.
- 20. Workman Jr., J.P. (1993) Marketing’s Limited Role in New Product Development in One Computer Systems Firm. Journal of Marketing Research, 30, 405-421.
- 21. Hunt, S.D. (1976) The Nature and Scope of Marketing. Journal of Marketing, 40, 17-28.
http://dx.doi.org/10.2307/1249990 - 22. Walker Jr., O.C. and Ruekert, R. (1987) Marketing’s Role in the Implementation of Business Strategies: A Critical Review and Conceptual Framework. Journal of Marketing, 51, 15-34.
- 23. Workman Jr., J.P., Homburg, C. and Gruner, K. (1998) Marketing Organization: An Integrative Framework of Dimensions and Determinants. Journal of Marketing, 62, 21-41.
- 24. Moorman, C. and Rust, R.T. (1999) The Role of Marketing. Journal of Marketing, 63, 180-197.
http://dx.doi.org/10.2307/1252111 - 25. Merlo, O. and Auh, S. (2009) The Effects of Entrepreneurial Orientation, Market Orientation, and Marketing Subunit Influence on Firm Performance. Marketing Letters, 20, 295-311.
http://dx.doi.org/10.1007/s11002-009-9072-7 - 26. Verhoef, P.C. and Leeflang, P.S.H. (2009) Understanding Marketing Department’s Influence within the Firm. Journal of Marketing, 73, 14-37.
http://dx.doi.org/10.1509/jmkg.73.2.14 - 27. Merlo, O. and Auh, S. (2010) Marketing’s Strategic Influence in Australian Firms: A Review and Survey. Australasian Marketing Journal, 18, 49-56.
http://dx.doi.org/10.1016/j.ausmj.2010.01.002 - 28. Filippone, M. (2009) Dealing with Non-Metric Dissimilarities in Fuzzy Central Clustering Algorithms. International Journal of Approximate Reasoning, 50, 363-384.
http://dx.doi.org/10.1016/j.ijar.2008.08.006 - 29. Lee, W.-I., Shih, B.-Y. and Chung, Y.-S. (2008) The Exploration of Consumers’ Behavior in Choosing Hospital by the Application of Neural Network. Expert Systems with Applications, 34, 806-816.
http://dx.doi.org/10.1016/j.eswa.2006.10.020 - 30. Briggs, S.R. and Cheek, J.M. (1986) The Role of Factor Analysis in the Development and Evaluation of Personality Scales. Journal of Personality, 54, 106-148.
http://dx.doi.org/10.1111/j.1467-6494.1986.tb00391.x - 31. Koerner, M.M. (2000) The Conceptual Domain of Service Quality for Inpatient Nursing Services. Journal of Business Research, 48, 267-283.
http://dx.doi.org/10.1016/S0148-2963(98)00092-7 - 32. Steenkamp, J.B.E.M. and Ter Hofstede, F. (2002) International Market Segmentation: Issues and Perspectives. International Journal of Research in Marketing, 19, 185-213.
http://dx.doi.org/10.1016/S0167-8116(02)00076-9 - 33. Aulakh, P.S. and Kotabe, M. (1993) An Assessment of Theoretical and Methodological Development in International Marketing: 1980-1990. Journal of International Marketing, 1, 5-28.
- 34. Naes, T., KubberØd, E. and Sivertsen, H. (2001) Identifying and Interpreting Market Segments Using Conjoint Analysis. Food Quality and Preference, 12, 133-143.
http://dx.doi.org/10.1016/S0950-3293(00)00039-2 - 35. Andrews, R.L. and Currin, I.S. (2003) Recovering and Profiling the True Segmentation Structure in Markets: An Empirical Investigation. International Journal of Research in Marketing, 20, 177-192.
http://dx.doi.org/10.1016/S0167-8116(03)00017-X - 36. Sepúlveda, W.S., Maza, M.T. and Mantecón, A.R. (2010) Factors Associated with the Purchase of Designation of Origin Lamb Meat. Meat Science, 85, 167-173.
http://dx.doi.org/10.1016/j.meatsci.2009.12.021 - 37. Carbonell, L., Izquierdo, L., Carbonell, I. and Costell, E. (2008) Segmentation of Food Consumers According to Their Correlations with Sensory Attributes Projected on Preference Spaces. Food Quality and Preference, 19, 71-78.
http://dx.doi.org/10.1016/j.foodqual.2007.06.006 - 38. Fonti Furnols, M., San Julián, R., Guerrero, L., Sañudo, C., Campo, M.M., Olleta, J.L., et al. (2006) Acceptability of Lamb Meat from Different Producing Systems and Ageing Time to German, Spanish and British Consumers. Meat Science, 72, 545-554.
http://dx.doi.org/10.1016/j.meatsci.2005.09.002 - 39. Oliver, M.A., Nute, G.R., Fonti Furnols, M., San Julián, R., Campo, M.M., Sañudo, C., et al. (2006) Eating Quality of Beef from Different Production Systems, Assessed by German, Spanish and British Consumers. Meat Science, 74, 422- 435.
http://dx.doi.org/10.1016/j.meatsci.2006.03.010 - 40. Realini, C.E., Fonti Furnols, M., Guerrero, L., Campo, M.M., Sañudo, C., Nute, G.R., et al. (2009) Effect of Finishing Diet on Consumer Acceptability of Uruguayan Beef in the European Market. Meat Science, 81, 499-506.
http://dx.doi.org/10.1016/j.meatsci.2008.10.005 - 41. Verbeke, W., Pérez-Cueto, F.J.A., de Barcellos, M.D., Krystallis, A. and Grunert, K.G. (2009) European Citizen and Consumer Attitudes and Preferences regarding Beef and Pork. Meat Science, 84, 284-292.
http://dx.doi.org/10.1016/j.meatsci.2009.05.001 - 42. Fonti Furnols, M., Realini, C., Montossi, F., Sañudo, C., Campo, M.M., Oliver, M.A., Nute, G.R. and Guerrero, L. (2011) Consumer’s Purchasing Intention for Lamb Meat Affected by Country of Origin, Feeding System and Meat Price: A Conjoint Study in Spain, France and United Kingdom. Food Quality and Preference, 22, 443-451.
http://dx.doi.org/10.1016/j.foodqual.2011.02.007