New Journal of Glass and Ceramics
Vol.05 No.03(2015), Article ID:58413,14 pages
10.4236/njgc.2015.53008
Dielectric and Magnetic Properties of Nano-Structure BiFeO3 Doped with Different Concentrations of Co Ions Prepared by Sol-Gel Method
Inas Kamal Batttisha1*, Ibrahim Sayed Ahmed Farag1, Mostafa Kamal2, Mohamed Ali Ahmed3, Emad Girgis1, Hesham Azmi El Meleegi4, Fawzi El Desouki1
1National Research Centre (NRC), Solid State Physics Department, 33 Bohouth St, Dokki, Giza, Egypt
2Metal Physics Laboratory, Physics Department, Faculty of Science, Mansoura University, Mansoura, Egypt
3Materials Science Lab (1), Physics Department, Faculty of Science, Cairo University, Giza, Egypt
4National Research Centre (NRC), Thin Film Lab, Electron Microscope Department, 33 Bohouth St, Dokki, Giza, Egypt
Email: *szbasha@yahoo.com, *ibattisha@gmail.com
Copyright © 2015 by authors and Scientific Research Publishing Inc.
This work is licensed under the Creative Commons Attribution International License (CC BY).
http://creativecommons.org/licenses/by/4.0/


Received 6 June 2015; accepted 26 July 2015; published 29 July 2015
ABSTRACT
BiFe1−xCoxO3 (x = 0, 0.03, 0.05 and 0.1) symbolic as (BFO, BF3CO, BF5CO and BF10CO) in powder form has been prepared by sol-gel technique using ethylenediamine tetraacetic acid (EDTA) as a chelating agent. X-ray diffraction (XRD) and FTIR analysis showed rhombohedra distorted BiFeO3 structure with compressive lattice distortion induced by the Co substitution at Fe sites. The transmission electron microscope (TEM) shows irregular particles. The additive of cobalt oxide has led to grains refining giving the following crystallite sizes of 18 nm for BF5Co. The scanning electron microscope (SEM) study reveals that the samples morphology shows relatively uniform grain size distribution. The dielectric properties of BiFeO3 nano-particles in the frequency range of 1 up to 5 MHz at RT revealed that the A.C. conductivity of the prepared samples reaches its maximum value in BF5CO. By decreasing BiFeO3 particle size as a result of doping with different Co ion concentrations, an enhancement in magnetization and a simultaneous suppression in current leakage occurred. The remnant magnetization Mr of BiFe1−xCoxO3 (x = 0, 0.03, 0.05, 0.1) ceramics significantly enhanced, which provides potential applications in information storage.
Keywords:
Nano-Structure, Multiferroic, BiFe1−xCoxO3 (x = 0, 0.03, 0.05, 0.1), XRD, FTIR, TEM, Remnant Magnetization

1. Introduction
Multiferroic materials have attracted much attention because of their potential applications in data storage, spintronic and microelectronic device, and the possibility of controlling magnetic order by electric field or vice versa through magnetoelectric coupling. Ferroelectricity originates from off-center structural distortions while magnetism is involved with local spins, which limits the presence of off-center structural distortion [1] . This quite contradiction results in a few multiferroic materials in single phase. Bismuth ferrite BiFeO3 (BFO) is one of the most researched single-phase multiferroic materials because of its coexistence of ferroelectric and antiferromagnetic orders with ferroelectric Curie temperature (TC = 820˚C - 830˚C) and antiferromagnetic Neel temperature (TN = 370˚C) [2] . From a structural point of view, the room-temperature structure of BFO is a highly rhombohedrally distorted perovskite with space group R3c. In recent years, more attentions were focused on the preparation of BFO both in powder and thin film forms since they allow direct integration of the material into the spintronic technology. But, preparation of BFO is quite difficult either as single crystals or as a pure powder of polycrystalline form. According to the phase diagram of Bi2O3-Fe2O3, BFO is an incongruently melting compound [3] - [5] and the kinetics of phase formation in the Bi2O3-Fe2O3 system can easily lead to the formation of impurity phases such as Bi25FeO40 and Bi2Fe4O9 when preparing it in bulk ceramic form. Moreover, according to some reports, the successful synthesis of single phase powder essentially depends on the purity of the starting materials; these authors used some high purity reactants (99.9995%). The impurities formed during the heating process cannot be removed with further heat treatments. To overcome this problem researcher adopted different techniques such as co-precipitation, Pechini’s auto-combustion and so on [6] , but these methods are based on complex solution processes. Sol-gel process, used in this work, has been proven for several years, which is now efficient for the processing of BiFeO as powder and thin film materials. The primary attention was paid to the low-temperature nature of the sol-gel process. This dictates that one of the main advantages of the sol-gel process is the low-energy cost since the BiFeO can be obtained at quite low temperature. The sol-gel researchers, however, soon became aware of the potential of the sol-gel method to provide new advanced functional ferroelectric materials based on various microstructures [7] - [10] .
In this work sol-gel method is adopted for the synthesis of BFO powder samples and their structural, electrical, optical and magnetic properties are studied. Pure nano-particle BiFeO3 was synthesized by doping with cobalt ions to obtain pure phase BFO and enhancing the magnetization at lower concentrations through sol-gel process at low temperature to overcome the mentioned difficulties. Ethylenediamine tetraacetic acid (EDTA) is used as a chelating agent. This process is simple, energy-saving and cost-effective. The microstructure and magnetic properties of BiFeO3 powders were investigated by using XRD patterns and lakeshore vibrating sample magnetometer (VSM). Ferroelectric transition was detected by differential thermal analysis. The morphology of the prepared sample was evaluated by transmission electron microscope (TEM) and scanning electron microscope (SEM).
The prepared materials have the potential of future development as powders RT multiferroic, by preparing it under annealing atmosphere to reduce oxygen vacancies and after allowing us to switch polarization at higher applied voltage.
2. Materials and Methods
2.1. Samples Preparation
BiFeO3 nano-materials doped with different concentrations of Cobalt oxide Bi Fe1−xCoxO3 where (x = 0, 3, 5 and 10%), (BFO, BF3CO, BF5CO and BF10CO), as shown in Table 1, in powder form have been prepared by a modified sol-gel method. Bismuth (III) nitrate penta-hydrate (Aldrich, 99.5%), iron (III) nitrate non-ahydrate (Aldrich, 98%) and Cobalt (II) nitrate non hydrate were used as precursor materials. In a typical synthesis of BiFeO3 nano-materials 0.01 mol Bi (NO3)3-5H2O and 0.01 mol Fe (NO3)3-9H2O were initially dissolved in the dilute nitric acid (20% HNO3) to form a transparent solution. Ethylenediamine tetraacetic acid (EDTA) in 1:1 mol ratio with respect to the metal nitrates Bi and Fe was added to the above solution as a chelating agent. The solution was then heated at 130◦C under constantly stirring in an oil bath until all liquid evaporated out from the solution. Crystallization of the gel was achieved by calcinating in air for 1 h at 600◦C, in a muffle furnace type (CarboliteCWF1200).
2.2. Characterization
The phases of the obtained samples are characterized by X-ray diffraction (XRD) (BRUKUR D8 ADVANCED

Table 1. Dopant concentration, sample abbreviation, chemical formula and oxygen vacancy of Co2+ concentration doped nanocomposite BFO powders.
TARGET Cu Kα with Secondary monochromatic KV = 40, mA = 40 Germany) in a wide range of Bragg angle from 10˚ - 80˚ using Cu Ka (1.5406 Å) radiation with a step size of 0.02 at room temperature. The crystallite size (G) is determined from the Scherrer’s equation;
 (1)
(1)
where K is the Scherer constant, in the present case K = (0.9), l is the wavelength and D is the full width (in radians) of the peak at half maximum (FWHM) intensity. The microstructure and surface morphology of the samples were observed by (TEM) transmission electron microscope (using JEOL JEM-1230 equipment operating at 120 kV with attached CCD camera) and (SEM) scanning electron microscope (Quanta 250 FEG (Field emission Gun)) was used to determine grain size and uniformity of the sample analysis. The phase transitions above room temperature have been investigated by DTA (SDT Q 600 V 20.9 Build 20) measurements.
(J-E) curve was measured by using kethlay and ferroelectric hysteresis loops were measured device by using ferroelectric loop tracer at a frequency of 50 Hz.
Magnetization hysteresis (M-H) measurements were carried out at room temperature using lakeshore vibrating sample magnetometer (VSM 7410) model lakeshore 7110.
The relative dielectric permittivity was calculated using the relations:
 (1)
(1)
where C is the capacitance of the measured sample in Farad, d is the thickness of the sample in meters, A is the cross section area of the sample and εo is the permittivity of free space (8.854 × 10⁻¹² Fm−1).
 (2)
(2)
where, ε" is the dielectric loss and tanδ is the loss tangent.
The AC resistivity (ς') of the prepared samples has estimated from the dielectric parameters. As long as the pure charge transport mechanism is the major contributor to the loss mechanism, ς' can be calculated using the following relation:
 (3)
(3)
where , w is the angular frequency and f is the frequency of the applied electric field in Hertz.
 (4)
(4)
where σ is the A.C. conductivity, f is the operating frequency, d is the thickness of the dielectrics, tanδ is the dielectric loss, C is the capacitance and A is the area of the electrode.
3. Results and Discussion
3.1. XRD Analysis
XRD patterns of BiFeO3 (BFO) nanoparticle in powder form calcined in air at 600˚C for 1 h is shown in Figure 1, which indicates that drying in an oil bath reduce the impurity and identifying the phase structure. Observed peaks in the XRD patterns could be identified to be rhombohedra distorted pervoskite structure of BiFeO3 with space group R3c according to (ICDD No 86-1518). Beside these prominent peaks, some other peaks of low intensity are observed, which do not belong to pervoskite BFO, informing the Bi2Fe4O9 impurity phase presence [11] .

Figure 1. Room temperature XRD pattern of B FO (a) in air and (b) in oil path calcined at 600˚C for one hour (samples (pyrochlore phase (Bi2Fe4O9) is marked by ♦)).
Figure 2 shows the XRD patterns of (BFO, BF3CO, BF5CO and BF10CO) calcined at 600˚C for one hour. The same observed peaks in the XRD patterns detected in (BFO), Figure 1 appeared and could be indexed to rhombohedra distorted pervoskite structure of BiFeO3 with space group R3c (JCPDS No 86-1518). Beside these prominent peaks, some other peaks of low intensity are observed, which do not belong to pervoskite BFO, informing the Bi2Fe4O9 impurity phase presence as indicated before for (BFO). It is clear that small concentrations of cobalt (x = 0.03 and 0.05) causes stabilization to BFO rhombohedra perovskite structure with no indication of any detectable secondary phases. Since the Co2+ ion has similar radius as that of Fe3+ ion (0.65 Å for Co2+ and 0.645 Å for Fe3+; six coordination) [12] . This makes it possible for Co ions to substitute Fe ions. Figure 3 shows the expansion of the XRD patterns in the range between 2θ = 28˚ and 38˚ of BFO, (BF3CO), (BF5CO) and (BF10CO). Compared with BFO3, no large shift toward lower 2θ side can be observed for the major peaks position of BiFe1-xCoxO3 (x = 0, 0.03, 0.05, 0.1). However, the peak splitting gradually decreases by increasing Co ion concentrations in BFCO.
This result reveals that the basic rhombohedra distorted perovskite structure of BFO, (BF3CO), (BF5CO) and (BF10CO) has been affected by the substitution of Co ions. No impurity phases of Co oxides can be observed at low concentration in XRD patterns, which confirms that Co atoms have been successfully incorporated into the host lattice.
The plot of cell volume as a function of cobalt concentration is shown in Figure 4. Shrinkage in lattice parameter and unit cell volume may be expected as shown in Table 2. A systematic decrease in lattice volume, at (x = 0, 0.03 and 0.05) indicated successful substitution of cobalt at Fe site. By increasing the Co concentration up to x = 0.1 the phase purity disappeared. The appearance of the impurity at higher Co concentration could be an indication that the saturation level of forming a solid solution has been reached just before this concentration.
The average crystallite sizes of our samples calculated using Scherrer’s formula were decreased by doping with Co ions to be equal to 42 and 18 nm for BFO, and BF5CO, respectively.
3.2. FT-IR, Analyses
Figure 5 shows the FTIR spectra of x = 0 (a), 0.03 (b), 0.05 (c) and 0.1 (d) recorded at room temperature. One of the fundamental absorptions is observed in the wavelength region between 440 and 460 cm−1. This band is attributed to the bending vibration of the Fe-O bond (nearly at 444 cm−1) in the FeO6 octahedral unit However, the most important as well as complex part of the spectra is the region from 480 to 600 cm−1 in the pristine BFO, which become broader by Co ions-doping. It can be seen that the extent of broadening increases by increasing dopant concentration. Another peak of Fe-O at 810 cm−1 can be attributed to the formation of highly crystalline BFO phase [13] [14] .
3.3. Transmission and Scanning Electron Microscope (TEM)
Figures 6(a)-(c) show the transmission electron (TEM) micrographs along with their corresponding (selected
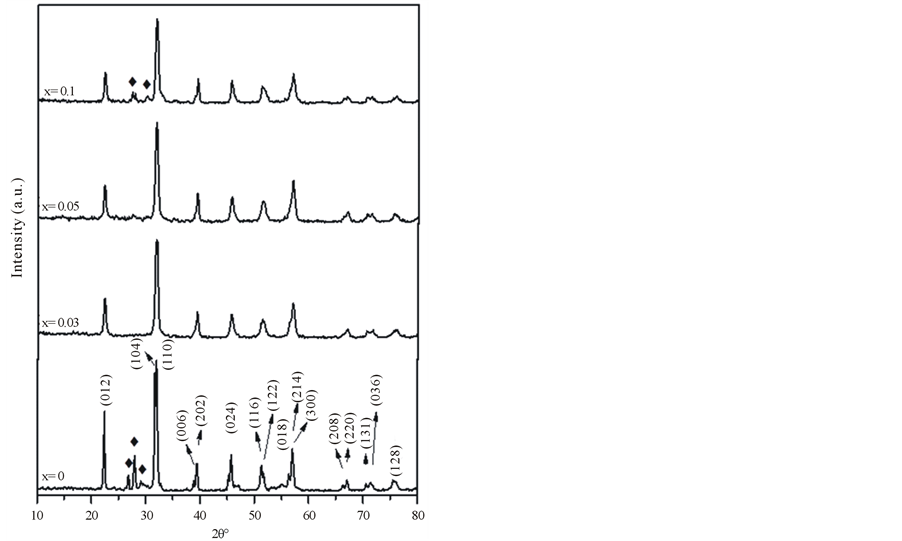
Figure 2. Room temperature XRD pattern of (BFO, BF3CO, BF5CO and BF10CO), calcined in air at 600˚C for one hour (pyrochlore phase (Bi2Fe4O9) is marked by ♦).

Figure 3. The expansion of the XRD patterns in the range between 2θ = 31˚ and 33˚ of BFO, BF3CO, BF5CO and BF10CO.

Figure 4. Variation of cell volume as a function of Co concentration in BiFe1−xCoxO3.

Figure 5. FTIR spectra of nano-particles, BFO (a), BF3CO (b), BFO5C (c) and BF10CO (d) calcined in air at 600˚C for one hour.
 (a)
(a) (b)
(b) (c)
(c)
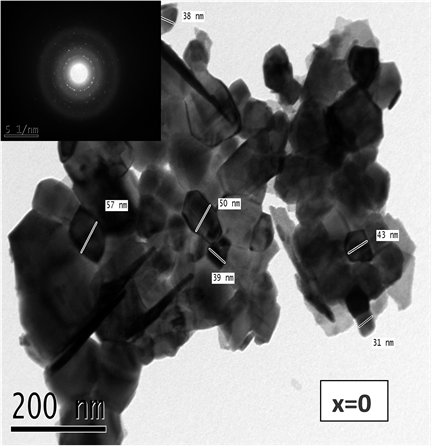
Figure 6. TEM micrograph with their corresponding (selected area electron diff.) (SAED) patterns for BFO (a), BF3CO (b), BFO5C (c) calcined in air at 600˚C for one hour.
Table 2. Lattice parameters and unit cell volume.
area electron diffraction, SAED) patterns of the powder samples BiFe1−xCoxO3 (x = 0, 0.03, 0.05). Some degree of agglomerations has been found in the clusters, which contain many small grains. A clear and strong SAED patterns observed and confirmed that the powder samples are with good crystalline structure and have a bimodal size distribution with large particles 57 nm and smaller ones 17 nm. The particle shapes of the as synthesized samples are displayed nanostructure scale by doping the samples with x = 0.03 and 0.05 mol% of Co ions. The particle size is slightly greater than the crystallite size (C.S.) obtained by the Scherrer’s equation (XRD section) due to the presence of both microstrain and the particles agglomeration. The calculated average crystallite size obtained from TEM are about 43, 22.5 and 23.3 nm for the pure powder sample and the doped with BFO, BF3Co and BF5Co, respectively. The BiFe1−xCoxO3 TEM shows good consistency with the obtained C.S. from XRD results (42, 20 and 18 nm) for the same samples. The TEM C.S. reveals a decrease in the doped samples than the pure one. The presence of sharp diffraction spots indicating the formation of well developed, highly crystalline nanoparticles. Figure 7(a) and Figure 7(b) show a small nanorod shapes for the samples doped with Co ions with x = 0.03 and 0.05 in another regions of the samples.
The FESEM images of BiFe1−xCoxO3 (x = 0, 0.03, 0.05, 0.1) ceramics are displayed in Figures 8(a)-(d). The SEM micrographs reveal microstructure comprising of various size grains with well-defined boundaries, indicating polycrystalline material nature. The morphology of the samples shows relatively uniform grain size distribution; it is clear that the grains appear to stick to each other and accumulated in small amount, which may be due to presence of large oxygen vacancies. The sample micrographs are denser at higher concentrations. The grain size appears to be in nano-scale and confirms the data obtained from XRD pattern and TEM.
3.4. Thermal Analyses
The phase transition and thermal stability of BFO sample above room temperature are investigated by DTA measurements as shown in Figure 9. The endothermic peak was observed at 829.15˚C during heating, indicating the BFO ferroelectric phase transformation. The obtained result is in agreement with the previously reported [2] [3] .
3.5. Ferroelectric Properties
Figures 10(a)-(c) show the frequency dependence of the dielectric constant, dissipation factor (tanδ) and A.C.
 (a)
(a) (b)
(b)
Figure 7. TEM micrograph of nano-structure BF3CO (a) and BFO5C (b) calcined in air at 600˚C for one hour.
 (a)
(a) (b)
(b) (c)
(c) (d)
(d)
Figure 8. FESEM images surface morphologies of nano- structure BFO (a), BF3CO (b), BFO5C (c) and BF10C, calcined in air at 600˚C for one hour (d).

Figure 9. Thermal analysis curve (DTA) of BFO.
conductivity (σac) variations in the range between 1 kHz and 5 MHz for BFOCx, where x = 0, 0.03, 0.05, and 0.1. It is observed that both ε' and “tanδ” are dependent on frequency, where it decreases at higher frequency region. But relatively at lower frequency region, dielectric constant shows a dielectric dispersion evidently. Such dispersion seems to be a common feature in ferroelectric materials concerned with ionic conductivity, which is referred as low-frequency dielectric dispersion. When the frequency increases, the relative effect of ionic conductivity becomes small and as a result, the frequency dependence of ε' becomes weak. It is known that, value of dielectric constant ε' at lower frequencies normally depends on the lattice vibrations, excitation of bound electrons, dipole orientation, and space charge polarization (atomic and electronics). At higher frequency region, the value of ε' is almost constant. This flat type characteristic at higher frequencies indicated that there is no space charge polarization contribution at this frequency range. Oxygen vacancy is one of the main sources of movable space charges in BFO [14] . There are always some oxygen vacancies in un-substituted BiFeO3, which result in relatively small dielectric constant. Normally, the mobile oxygen vacancies can be readily activated to be free for conduction by the electric field because energy levels associated with (VO−2) are very close to the conduction band, However, when Co2+ ions was doped into BFO lattice, defect complexes between electric acceptors Co2+ and VO−2 were formed [15] . The increased mobile oxygen vacancies resulted in the increase of both the dielectric constant and ac conductivity and a decrease of loss tangent at 5 mol% Co as compared with BFO nano- composite. The physical reason for the dispersion of dielectric constant can be understood on the basis of hopping of electrons between Fe2+-Fe3+ pairs of ions. The applied electric field displaces the electrons slightly from their equilibrium positions, thus producing polarization.
 (a) (b)
 (c) (d)
Figure 10. (a)-(c) RT Frequency dependence of (a) (ε'), (b) (tanδ), (c) (σac) and (d) J-E characteristics in the bias range of ±100 V/cm for (BFO, BF3CO, BF5CO and BF10CO) calcined in air at 600˚C for one hour.
In case of (tanδ) it was noticed that this attenuation by increasing frequency might be attributed to the phonon dipole interaction which led to a lowering of the energy transferred to the dielectric medium. In addition, the increase of ε' and the decrease in tanδ by increasing the Co ions concentration up to 5 mol% were due to the high leakage current in the BiFeO3 pellet. But at 0.1 mol% of Co ions the trend is completely different, this might be due to the Bi2Fe4O9 impurity phase presence as shown in the XRD part in this work.
Figure 10(d) shows the leakage current density (LCD) of BiFe1−xCoxO3 (x = 0, 0.03, 0.05, 0.1). The LCD of the powder at x = 0 was 10−4 A/cm2 under 100 V/cm as electric field. After doping with 5 mol% Co, the LCD was increased significantly to be 0.013 A/cm2 referring to the optimum condition for the electric properties.
Figure 11 shows the polarization-electric field (P-E) hysteresis loop of BiFe1−xCoxO3 (x = 0.03 & 0.05). The remnant polarization (P) and the coercive electric field (EC) obtained from the P-E hysteresis loops are about 1 μC/cm2 and 3 V/cm, respectively. No saturation in polarization-electric field (P-E) curve could be obtained for both ceramics at this minimum applied electric field range due to the relatively large leakage current in the samples, only low field electric hysteresis loops were obtained. The samples are highly conductive at room temperature and only partial polarization reversal takes place.
The relatively high conductivity of BiFeO3 is known to be attributed to the variable oxidation states of Fe ions (Fe2+ to Fe3+), which require oxygen vacancies for charge compensation. Also during synthesis, the slow heating rate and long sintering time will enable the equilibrium concentration of the oxygen vacancies at high temperature (600˚C) to be reached and will result in the high oxygen vacancy concentration in the synthesized product. So the presence of Fe2+ ions and oxygen deficiency leads to high conductivity. No saturated polarization hysteresis loop has been observed for all samples at room temperature under such applied field due to high conductivity of the samples. It is clear that the optimum condition of the ferroelectric characteristic is at 5 mol% Co concentration. It is needed to be further study by applying the polarization using a bigger volt or kilo volt range to obtain saturation in polarization. The prepared materials have the potential of future development as powders RT multiferroic, by preparing it under annealing atmosphere to reduce oxygen vacancies, which allow us to switch polarization at higher applied voltage.
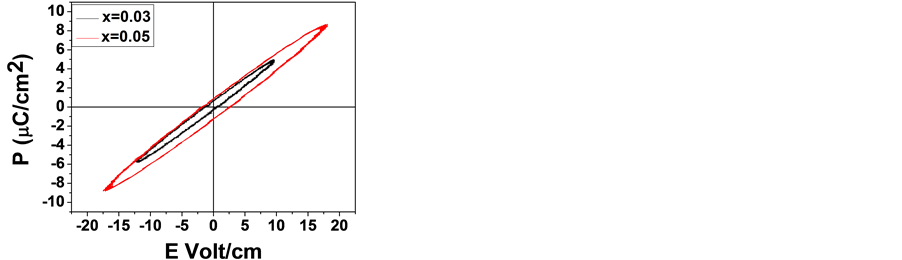
Figure 11. Ferroelectric hysteresis loops of BiFe1 (a) and BFO5C (b) calcined in air at 600˚C for one hour.
3.6. Magnetic Properties
Figure 12(a) shows the room temperature magnetization hysteresis loops for BiFe1−xCoxO3 (x = 0) powders calcined at 600˚C. M-H curve exhibits a nonlinearity with the remanent magnetization of 0.001 emu/g and coercive field of 125.67 Oe (as shown in Table 3), confirming the weak ferromagnetism nature at room temperature. In fact, at x = 0 the sample exhibited a G-type antiferromagnetic ordering, but has a residual magnetic moment caused by its canted spin structure (weak ferromagnetism). The weak ferromagnetic order itself can be understood as a result of noncolinear (canted) spin arrangements in two sublattices [16] . Figure 12(b) shows shifted hysteresis loops for the BFO according to Ne’el is further supported by the observation of a shift in the hysteresis loops shown in Figure 13(b), which can be ascribed to the presence of exchange coupling between the ferromagnetic surfaces and the antiferromagnetic cores. The apparently shifted coercivities, HC, are shown in the curve. The shape of our hysteresis loops, which exhibit very small remnant magnetization and a lack of saturation, reflect exchange and dipolar inter-particle interactions in addition to interfacial cross grain-boundary interactions due to the high packing volume fraction in our system. Figure 13 shows M-H curves of BiFe1−xCoxO3 (x = 0.03, 0.05 and 0.1) powders calcined at 600˚C for 1 h at different concentrations of Cobalt ions, we can see that saturation magnetization (Ms) increases with the decrease in particle size and as a result of increasing the cobalt ion concentrations. It is known that magnetism in oxide nanoparticles arises from vacancies, so the increase in magnetization of BF10CO as a result of increasing in oxygen vacancies and impurities as obtained from XRD patterns can be expected to be present. The weak magnetic property of BFO nanoparticles should be attributed to the size-confinement effects of the BFO nanostructures, which correlate with: a) the increased suppression of the known spiral spin structure (period length of 62 nm) with decreasing nanoparticle size and b) uncompensated spins and strain anisotropies at the surface (Park et al. [17] ). The enhancement of the ferromagnetism of the BFCO could be attributed to the magnetic moment of Co2+ and the possible breakage of the space modulated spin cycloid period. It is well known that in the BFO there is an existed cycloid modulated period of magnetization of 62 nm which make BFO showing no or weak ferromagnetization [18] . Since the Co2+ ions have similar radius as that of Fe3+ ion (0.65 Å for Co2+ and 0.645 Å for Fe3+; six coordinations), a structural distortion can be expected. On the other hand, the bond angle of Fe3+-O-Co2+ is different with that of Fe3+-O-Fe3+, the magnetic moments of Fe3+ and Co2+ are different also, so the net magnetic moment is changed. The changes of both structure and net magnetic moment may change the canting of the antiferromagnetic arranged neighboring spins and break the spiral spin configuration and then enhance the magnetization. There will be a dependence of anisotropy constant K on the Co2+ ion concentration x, which can be evaluated by using the following relation K = HC MS/2 [19] - [23] .
The magnetic moment of Co2+ and Fe3+ ions are equal to 3 B.M, and 5 B.M, respectively, when Co2+ ion concentrations increased this leads to the compensation of Fe3+ ions in the octahedral location. That increasing of Co-concentration led to increase the total magnetization and hence an increase of MS was detected. Thus, the increase of Co-concentration led to the increase of ferrites anisotropy property, hence HC increases as shown in Table 3.
4. Conclusions
In summary, BiFe1−xCoxO3 (x = 0, 0.03, 0.05, 0.1), BFO, BF3CO, BF5CO and BF10CO nano-particles in powder

 (a) (b)
Figure 12. (a) The room temperature magnetization hysteresis loops for BFO; (b) Shifted hysteresis loops for the BFO nano-particle, indicating presence of exchange coupling.
 (a) (b) (c)
Figure 13. M-H loops for nano-structure (BF3CO, BF5CO and BF10CO) calcined in air at 600˚C for one hour at 300 K.
Table 3. Magnetic parameters at room temperature and particle size.
form have been successfully prepared by sol-gel technique using ethylenediamine tetraacetic acid (EDTA) as a chelating agent. The average crystallite size of our samples calculated using Schrrer’s formula was decreased by doping with Co ions giving the following values of 44.5 and 18 nm for BFO and BF5CO, respectively. The SEM and TEM images show that the particles are uniform, dense and nearly rods and nano-particles shapes.
The magnetic moments of Co2+ and Fe3+ ions are equal to 3 B.M, and 5 B.M, respectively, when Co2+ ion concentrations increased the compensation of Fe3+ ions in the octahedral location causing an increase in HC.
The prepared materials have the potential of future development as powders RT multiferroic, by preparing it under annealing atmosphere to reduce oxygen vacancies and after allowing us to switch polarization at higher applied voltage.
Cite this paper
Inas KamalBatttisha,Ibrahim Sayed AhmedFarag,MostafaKamal,Mohamed AliAhmed,EmadGirgis,Fawzi ElDesouki,Hesham Azmi ElMeleegi,Fawzi ElDesouki, (2015) Dielectric and Magnetic Properties of Nano-Structure BiFeO3 Doped with Different Concentrations of Co Ions Prepared by Sol-Gel Method. New Journal of Glass and Ceramics,05,59-73. doi: 10.4236/njgc.2015.53008
References
- 1. Bhushan, B., Basumallick, A., Vasanthacharya, N.Y., Kumar, S. and Das, D. (2010) Sr Induced Modification of Structural, Optical and Magnetic Properties in Bi1-xSrxFeO3 (x = 0, 0.01, 0.03, 0.05 and 0.07) Multiferroic Nanoparticles. Solid State Sciences, 12, 1063-1069.
http://dx.doi.org/10.1016/j.solidstatesciences.2010.04.026 - 2. Li, B., Wanga, C., Liu, W., Ye, M. and Wang, N.G. (2013) Multiferroic Properties of La and Mn Co-Doped BiFeO3 Nano Fibers by Sol-Gel and Electro Spinning Technique. Materials Letters, 90, 45-48.
http://dx.doi.org/10.1016/j.matlet.2012.09.012 - 3. Bhushan, B., Das, D., Priyamc, A., Vasanthacharya, N.Y. and Kumar, S. (2012) Enhancing the Magnetic Characteristics of BiFeO3 Nanoparticles by Ca, Ba Co-Doping Centre for Applied Physics. Materials Chemistry and Physics, 135, 144-149.
http://dx.doi.org/10.1016/j.matchemphys.2012.04.037 - 4. Annapu Reddy, V., Patha, N.P. and Nath, R. (2012) Particle Size Dependent Magnetic Properties and Phase Transitions in Multiferroic BiFeO3 Nano-Particles. Journal of Alloys and Compounds, 543, 206-212.
http://dx.doi.org/10.1016/j.jallcom.2012.07.098 - 5. You, S.J., Ai, L., Li, D., Huang, H.M., Chen, W.P., Liu, W., Guo, S.S. and Zhao, X.Z. (2013) Enhanced Electrical Properties of Composite Nanostructures Using BiFeO3 Nanotubes and Ferroelectric Co-Polymers. Materials Letters, 94, 183-185.
http://dx.doi.org/10.1016/j.matlet.2012.12.056 - 6. Safi, R. and Shokrollahi, H. (2012) Physics, Chemistry and Synthesis Methods of Nanostructured Bismuth Ferrite (BiFeO3) as a Ferroelectro-Magnetic Material. Progress in Solid State Chemistry, 40, 6-15.
http://dx.doi.org/10.1016/j.progsolidstchem.2012.03.001 - 7. Batttisha, I.K., Farag, I.S.A., Kamal, M., Ahmed, M.A., Girgis, E., El Meleegi, H.A. and El Desouky, F.G. (2014) Structural and Multiferroic Properties of (Fe-Co) Co-Doped Ba0.9Sr0.1TiO3 Solids Prepared by Sol Gel Technique. New Journal of Glass and Ceramics, 4, 19-28.
http://dx.doi.org/10.4236/njgc.2014.42003 - 8. Abdel Aal, A., Hammad, T.R., Zawrah, M., Abou Hammad, A.B. and Battisha, I.K. (2014) FT-IR Study of Nano- Structure Perovskite BaTiO3 Doped with Both Fe3+ and Ni2+ Ions Prepared by Sol-Gel Technique. Acta Physica Polonica, A, 126, 1318.
http://dx.doi.org/10.12693/APhysPolA.126.1318 - 9. Willander, M., Nur, O., Israr, M.Q., Abou Hamad, A.B., Abd El Maksoud, F.G., Salem, M.A. and Battisha, I.K. (2012) Development of A.C. Conductivity of Nano-Composite Perovskite Ba(1-x-y)Sr(x)Ti Fe(y)O3 Prepared by the Sol-Gel Technique. Journal of Crystallization Process and Technology (JCPT), 2, 1-11.
http://dx.doi.org/10.4236/jcpt.2012.21001 - 10. Nur, O., Willander, M., Israr, M.Q., El Desouky, F.G., Salem, M.A., Battisha, I.K. and Abou Hamad, A.B. (2012) Effect of Elevated Concentrations of Strontium and Iron on the Structural and Dielectric Characteristics of Ba(1-x-y) Sr(x)Ti Fe(y)O3 Prepared through Sol-Gel Technique. Physica B: Physics of Condensed Matter, 407, 2697-2704.
http://dx.doi.org/10.1016/j.physb.2012.03.023 - 11. Wu, J. and Wang, J. (2010) Multiferroic, Optical, and Fatigue Behavior of BiFeO3 Thin Films with a Sintering Aid of CuO. Electrochemical and Solid-State Letters, 13, G68-G70.
- 12. Bhushan, B., Das, D., Priyam, A., Vasanthacharya, N.Y. and Kumar, S. (2012) Enhancing the Magnetic Characteristics of BiFeO3 Nanoparticles by Ca, Ba Co-Doping. Materials Chemistry and Physics, 135, 144-149.
http://dx.doi.org/10.1016/j.matchemphys.2012.04.037 - 13. Safi, R. and Shokrollahi, H. (2012) Physics, Chemistry and Synthesis Methods of Nanostructured Bismuth Ferrite (BiFeO3) as a Ferroelectro-Magnetic Material. Progress in Solid State Chemistry, 40, 6-15.
http://dx.doi.org/10.1016/j.progsolidstchem.2012.03.001 - 14. Picozzi, S. and Ederer, C. (2009) First Principles Studies of Multiferroic Materials. Journal of Physics: Condensed Matter, 21, 303201-303219.
http://dx.doi.org/10.1088/0953-8984/21/30/303201 - 15. Shimada, T., Uratani, Y. and Kitamura, T. (2012) Vacancy-Driven Ferromagnetism in Ferroelectric PbTiO3. Applied Physics Letters, 100, 162901-162903.
http://dx.doi.org/10.1063/1.4704362 - 16. Dormann, J.L. and Nogues, M. (1990) Magnetic Structures in Substituted Ferrites. Journal of Physics: Condensed Matter, 2, 1233-123.
http://dx.doi.org/10.1088/0953-8984/2/5/014 - 17. Park, T.J., Papaefthymiou, G.C., Viescas, A.J., Moodenbaugh, A.R. and Wong, S.S. (2007) Size-Dependent Magnetic Properties of Single-Crystalline Multiferroic BiFeO3 Nanoparticles. NanoLetters, 7, 766-772.
http://dx.doi.org/10.1021/nl063039w - 18. You, S.J., Ai, L., Li, D., Huang, H.M., Chen, W.P., Liu, W., Guo, S.S. and Zhao, X.Z. (2013) Enhanced Electrical Properties of Composite Nanostructures Using BiFeO3 Nano-Tube Sand Ferroelectric Copolymers. Materials Letters, 94, 183-185.
http://dx.doi.org/10.1016/j.matlet.2012.12.056 - 19. Cullity, B.D. and Graham, C.D. (2009) Introduction to Magnetic Materials. John Wiley & Sons, Inc., Hoboken.
- 20. Zhou, J.P., Wang, P.F., Qiu, Z.C., Zhu, G.Q. and Liu, P. (2008) Flower-Like Pb(Zr0.52Ti0.48)O3 Nanoparticles on the CoFe2O4 Seeds. Journal of Crystal Growth, 310, 508-512.
http://dx.doi.org/10.1016/j.jcrysgro.2007.10.066 - 21. Eerenstein, W., Mathur, N.D. and Scott, J.F. (2006) Multiferroic and Magnetoelectric Materials. Nature Journal, 442, 759-765.
- 22. Gajek, M., et al. (2005) Spin Filtering through Ferromagnetic BiMnO3 Tunnel Barriers. Physical Review B, 72, 020406(R).
http://dx.doi.org/10.1103/PhysRevB.72.020406 - 23. Bush, A.A., Fetisov, Y.K., Kamentsev, K.E., Meshcheryakov, V.F. and Srinivasan, G. (2003) Magnetic and Microwave Properties of (Ni, Co)Fe2O4-Ferroelectric and (La,Ca,Sr)MnO3-Ferroelectricmultilayer Structures. Journal of Magnetism and Magnetic Materials, 258-259, 45-47.
http://dx.doi.org/10.1016/S0304-8853(02)01008-9
NOTES

*Corresponding author.