Journal of Crystallization Process and Technology
Vol.4 No.2(2014), Article ID:44999,12 pages DOI:10.4236/jcpt.2014.42013
Studies on Optical, Mechanical and Electrical Properties of Organic Nonlinear Optical p-Toluidine p-Toluenesulfonate Single Crystal
Suresh Sagadevan1*, Priya Murugasen2
1Department of Physics, Sree Sastha Institute of Engineering and Technology, Chembarambakkam, Chennai, India
2Department of Physics, Saveetha Engineering College, Thandalam, Chennai, India
Email: *sureshsagadevan@yahoo.co.in
Copyright © 2014 by authors and Scientific Research Publishing Inc.
This work is licensed under the Creative Commons Attribution International License (CC BY).
http://creativecommons.org/licenses/by/4.0/


Received 15 January 2014; revised 15 February 2014; accepted 22 February 2014
ABSTRACT
The optically transparent and bulk single crystal of p-Toluidine p-Toluenesulfonate (PTPT) was grown by slow evaporation technique. The lattice parameters and crystallinity of the grown crystal were estimated by single crystal XRD. The optical absorption of the crystal was recorded using the UV-Vis-NIR spectrophotometer. The optical bandgap and optical constants of the material were determined by using absorption spectrum. The refractive index of the grown crystal has been determined using the Brewster angle method. The dielectric constant and dielectric loss were measured as a function of frequency and temperature for the grown crystal. Nonlinear optical properties were performed to confirm the SHG efficiency of the grown crystal. Hence, PTPT is an excellent NLO material with enhanced SHG efficiency required for important applications in the field of optoelectronic and photonics. This material exhibits NLO behaviour remarkably due to its better optical and dielectric properties.
Keywords:Single X-Ray Diffraction, UV-Vis-NIR Spectrophotometer, NLO, SHG, Dielectric Constant, Dielectric Loss Studies

1. Introduction
The nonlinear optics is the field which includes all phenomena in which optical parameters of materials are changed with the interaction of intense coherent source of light. The NLO phenomena have lead to the enhancement in understanding of light-matter interactions. Due to high speed and ease of production of photons the area of photonics has become an active area of research in view of improved telecommunications, data storage, retrieving, processing and transmission [1] -[3] . The design of devices that utilize photons instead of electrons has created a need for new materials with unique nonlinear properties. Materials with large nonlinear optical susceptibilities are of current interest in the area of harmonic generation and optical modulation. Some polar organic crystals which form a noncentrosymmetric structure which exhibits a second-order nonlinear properties have led to the synthesis and evaluation of a wide range of potentially useful nonlinear optical crystals. NLO materials also find their applications in electro-optical shutters, color displays and signal processing. Materials with large second order nonlinear optical properties, short transparency cut off wavelengths, appropriate refractive index for phase matching, very low absorption, good optical quality, high damage threshold are of interest in view of the various applications. Amongst the organic NLO crystals, PTPT shows good SHG efficiency. In the present investigation we report the growth, optical and electrical properties of PTPT crystal.
2. Growth of p-Toluidine p-Toluenesulfonate (PTPT)
p-Toluidine p-Toluenesulfonate (PTPT) single crystal was formed in ethanol solution containing p-toluenesulfonic acid, p-Toluidine in molar ratio 1:1 at room temperature. Calculated amount of reactants were thoroughly dissolved in ethanol and stirred well by using magnetic stirrer to ensure homogeneous solution. The solution was then filtered using filter paper and transferred to a Petri dish. The prepared solution was allowed to evaporate at room temperature. The growth was initiated following the nucleation kinetics due to slow evaporation of the solvent. The quality of the crystal was improved by recrystallization process. After a period of 30 days, good quality of the crystal was harvested with more transparency. The reaction scheme for the formation of the crystal is shown in Figure 1.
3. Results and Discussion
3.1. Single Crystal X-Ray Diffraction Analysis
Single crystal X-ray diffraction (X-ray crystallography) is an analytical technique in which X-rays are employed to determine the actual arrangement of atoms within a crystalline specimen. Single crystal X-ray diffraction is a non-destructive tool to analyze crystal structure of compounds, which can be grown as single crystals. The molecular structure, atomic coordinates, bond lengths, bond angles, molecular orientation and packing of molecules in single crystals can be determined by X-ray crystallography. Single crystal X-ray diffractometer collects intensity data required for structure determination. Accurate measurements of intensities of reflections of all Miller indices within a specified reciprocal radius (usually 25˚ for MoKa and 68˚ for CuKa) is needed to find the structure, while unit cell parameters depend only on direction of reflections. As the name implies, a crystalline sample is required. For single-crystal work, the specimen should be smaller than cross section diameter of the beam. Larger crystals can be cut down to proper size and smaller crystals may be suitable if they contain

Figure 1. Reaction scheme of PTPT.
strongly diffracting elements. The monochromatic X-rays incident on a plane of single crystal at an angle theta are diffracted according to Bragg’s relation, 2dsinq = nl where “d” is the interplanar spacing of the incident plane, “l” is the wavelength of X-rays and “n” is a positive integer. The intensity of the diffracted rays depends on the arrangement and nature of atoms in the crystal. Collection of intensities of a full set of planes in the crystal contains the complete structural information about the molecule. With the set of X-ray diffraction data collected, unit cell parameters, space groups, molecular structure of the crystalline solids and Miller indexing the different faces of the crystal are possible. Unit cell parameter is simply the dimension of the basic molecular brick with which the crystal is built. Space group tells us the symmetry with which the molecules are arranged within the unit cell. All the geometrical features of molecules (bond distance, bond angles, torsion angles between bonds, dihedral angles between planes etc.,) may be obtained from coordinates.
In the present study, the single crystal X-ray diffraction analysis was performed using an ENRAF NONIUS CAD4-F single crystal X-ray diffractometer. Single crystal X-ray diffraction analysis was carried out to determine the lattice parameters. The results of the XRD analysis reveals that the grown crystals have monoclinic structure with P21 space group and the lattice parameter values of the grown crystals are a = 5.876 Å, b = 9.0203 Å, c = 13.372 Å. The crystal structure of PTPT was shown in Figure 2 [4] . The origin of nonlinearity in organic NLO materials is due to the presence of delocalized p-electron connecting donor and acceptor groups, which enhance the necessary asymmetric polarizability. PTPT is one such p donor acceptor molecular compound in which p-tolunesulfonic acid acts as proton donor and p-toluidine as proton acceptor. It crystallizes form its aqueous solution in the monoclinic crystal system with non-centrosymmetric space group.
3.2. UV-Visible Spectroscopy
Ultraviolet-visible spectroscopy (UV/VIS) is also known as electronic spectroscopy. Ultraviolet (200 - 400 nm) and visible (400 - 800 nm) absorption spectroscopy is the measurement of the attenuation of a beam of light after it passes through a sample or after reflection from a sample surface. The schematic representation of a UV-Vis spectrophotometer is shown in Figure 3. It uses light in the visible and adjacent near ultraviolet (UV) and near infrared (NIR) ranges. In this region of energy space molecules undergo electronic transitions. Ultraviolet and visible light are energetic enough to promote outer (valence) electrons to higher energy levels. Valence electrons are found in three types of electron orbitals namely s bonding orbitals, p bonding orbitals and non-bonding orbitals (n-lone pair electrons). Sigma (s) bonding orbitals tend to be lower in energy than p bonding orbitals, which in turn are lower in energy than non-bonding orbitals. The unoccupied or anti bonding orbitals (s* and p*) are the orbitals of highest energy. An energy level diagram showing electronic transitions is depicted in Figure 4 of the six transitions outlined, only the two lowest energy ones (left-most, coloured blue) are achieved by the energies available in the 200 to 800 nm spectrum. As a rule, energetically favored electron promotion will be from the highest occupied molecular orbital (HOMO) to the lowest unoccupied molecular orbital (LUMO) and the resulting species is called an excited state.
In particular, absorption bands results from transitions  and
and  involving p-orbitals and lone pairs (n = non-bonding) are important and so UV-Vis spectroscopy is of most use for identifying conjugated

Figure 2. Molecular structure of PTPT.
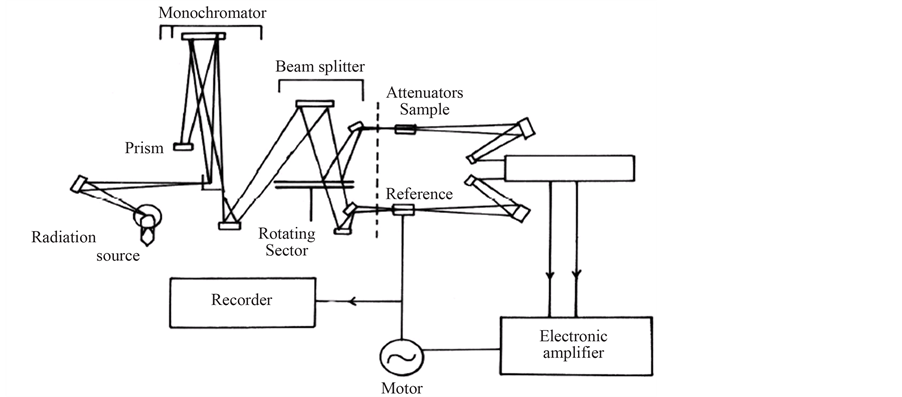
Figure 3. Schematic representation of a UV-Vis-NIR spectrophotometer.

Figure 4. Energy level diagrams with electronic transitions.
systems which tend to have stronger absorptions. Absorption bands can also arise from certain molecules where the energy required for removing an electron from one atom and placing it on another falls within the UV/Vis region. This process is known as a charge transfer excitation. Molecules with the ability to exhibit the above types of electronic transitions are said to possess chromophores. An isolated functional group not in conjugation with any other group is said to be a chromophore if it exhibits absorption of a characteristic nature in the ultraviolet or visible region. The most common are (C=C) and (C=O) which exhibits  and
and  transitions respectively.
If a series of compounds have the same functional group and no complicating factors are present, all of them will generally absorb at very nearly the same wavelength. Thus, it is readily seen that the spectrum of a compound, when correlated with data from the literature for known compounds, can be a very valuable aid in determining the functional groups present in the molecule. Samples are typically placed in a transparent cell, known as a cuvette. The sample holders (cuvettes) are the rectangular shaped quartz or glass cells of about 10 mm path length. The transmitted light radiation is received at the photomultiplier tube alternately from the reference and the sample beams. A photoelectric signal timing system is synchronized with the alternate pulses which permits the comparison of signals from the two beams. The difference between the two signals is recorded with the help of a motor driven pen or is interfaced with a PC-XT and stored there for easy reference. Samples in solid form, powder, pellets are dissolved in suitable solvents to form the contents of the sample cell and the solvents are taken in the reference cell.
In the present work, the UV-Visible spectra were recorded using Perkin Elmer Lamda Instrument. The spectrum gives information about the structure of the molecule because the absorption of UV and visible light involves promotion of the electron in the s and p orbital from the ground state to higher states. The optical absorption spectrum of p-Toluidine p-Toluenesulfonate (PTPT) crystal shown in Figure 5 was recorded between 200 and 1200 nm. The crystal has excellent transmission in the entire visible region. The lower cutoff wavelength is 290 nm single crystals are mainly used in optical applications and hence optical transmittance window and the transparency lower cut off (200 nm - 400 nm) is very important for the realization of SHG output in this range using lasers. This transparent nature in the visible region is a desirous property for the material used for NLO applications.
The bandgap of the crystal was estimated from the relation in Equation (1)
 (1)
(1)
This was found to be 4.28 eV, which is typical of dielectric materials. This high value of bandgap indicates that the grown crystal possesses dielectric behavior to induce polarization when powerful radiation is incident on the material. The absence of absorption bands in the visible region and the wide band gap of the grown crystal confirm to the suitability of the grown crystal for photonic and optical applications. The larger energy bandgap shows that the defect concentration in the grown crystal is very low. From the absorption spectrum, the lower cut-off wavelength is found to be 290 nm and the lower percentage absorption indicates that the crystal readily allows the transmission of the laser beam in the range between 290 nm and 1200 nm. It shows that the grown crystal has a good transparency in UV, visible and near IR region indicating that it can be used for NLO applications. Using Tauc’s plot, the energy gap (Eg) was calculated as 4.28 eV. This high band gap value indicates that the grown crystal possesses dielectric behaviour to induce polarization when powerful radiation is incident on the material.
Determination of Optical Constants
The extinction coefficient (K) can be obtained from the following equation,
 (2)
(2)
The transmittance (T) is given by
 (3)
(3)
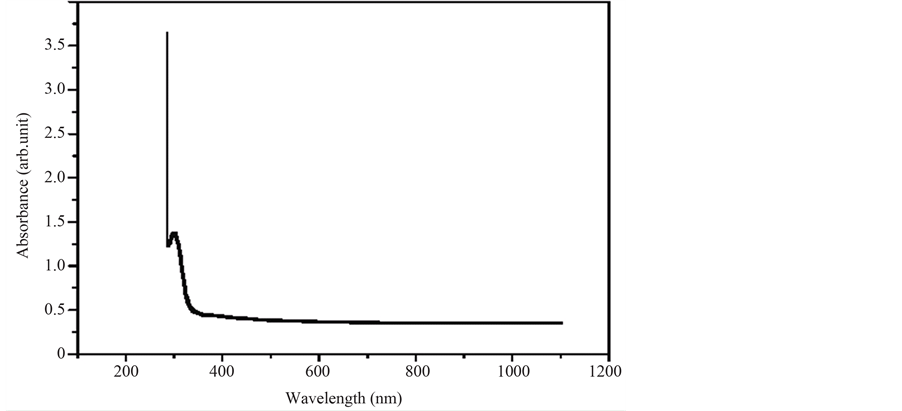
Figure 5. Absorption spectrum of PTPT crystal.
Reflectance (R) in terms of absorption coefficient can be obtained from the above equation. The moderate value of refractive index and optical band gap suggest that the material has sufficient transmission range for NLO applications.
Hence,
 (4)
(4)
Refractive index (n) can be determined from reflectance data using the following equation,
 (5)
(5)
The refractive index (n) was found to be 1.72 at λ = 1200 nm. From the optical constants, electric susceptibility (χc) can be calculated according to the following relation [5]
 (6)
(6)
Hence,
 (7)
(7)
where ![]() is the permittivity of free space. The value of electric susceptibility
is the permittivity of free space. The value of electric susceptibility  is 0.1473 at
![]() . The real part dielectric constant
. The real part dielectric constant ![]() and imaginary part dielectric constant
and imaginary part dielectric constant  can be calculated from the following relations [6]
 (8)
(8)
The value of real ![]() and
and  imaginary dielectric constants at
 ![]() were estimated as 1.892 and 6.9502 × 10⁻⁵, respectively. The moderate values of refractive index and optical band gap suggest that the material has the required transmission range for NLO application. The lower value of dielectric constant and the positive value of the material are capable of producing induced polarization due to intense incident light radiation.
were estimated as 1.892 and 6.9502 × 10⁻⁵, respectively. The moderate values of refractive index and optical band gap suggest that the material has the required transmission range for NLO application. The lower value of dielectric constant and the positive value of the material are capable of producing induced polarization due to intense incident light radiation.
3.3. Refractive Index Measurements
The refractive index of the crystals can be determined by Brewster’s angle method using He-Ne laser of wavelength 632.8 nm. A polished flattened single crystal of is mounted on a rotating mount at an angle varying from 0 to 90 degrees. The angular readings on the rotary stage was observed, when the crystal is perfectly perpendicular to the intracavity beam. The crystal is rotated until the laser oscillates and the angle has been set for maximum power output. Brewster’s angle (qp) for the crystal is measured. The refractive index is calculated using the equation, n = tanqp, where qp is the polarizing angle.
In the present work, finely polished crystals of the as grown PTPT were used for refractive index measurements. These crystals were cleaved and are placed on a rotating mount at an angle varying from 0 to 90 degrees. He-Ne laser of wavelength 632.8 nm was used as the source. Brewster’s angle (qp) for PTPT was measured to be 59.68 degrees. The refractive index has been calculated using the equation n = tanqp, where qp is the polarizing angle and it is found to be 1.71.
3.4. Vickers Hardness Studies
Hardness is a physicochemical property that characterizes the state of the material under test and gives information on some specific features of the material such as the character of the chemical bonding. It is the resistance which the material offers to indentation by a much harder body and may be termed as a measure of the resistance against lattice destruction or permanent deformation or damage. As the hardness properties are basically related to the crystal structure of the material and the bond strength, microhardness studies have been applied to understand the plasticity of the crystals. Hardness tests are commonly carried out to determine the mechanical strength of materials and it correlates with other mechanical properties like elastic constants and yield stress [7] . Hardness measurements can be defined as macro, micro and nano according to the forces applied and displacement obtained [8] .
Vickers hardness method is the reliable and most common among the various methods of hardness measurement discussed above. In this method, microindentation is made on the surface of a specimen with the help of diamond pyramidal indenter. Smith et al., [9] have proposed that a pyramid be substituted for a ball in order to provide geometrical similitude under different values of load. The Vickers pyramid indenter where opposite faces contain an angle (a = 136˚) is the most widely accepted pyramid indenter. A pyramid indenter is suited for hardness tests due to the following reasons [10] .
1) The contact pressure for a pyramid indenter is independent of indent size and 2) Pyramid indenters are less affected by elastic release than other indenters.
The base of the Vickers pyramid is a square and the depth of indentation corresponds to (1/7)th of the indentation diagonal. Hardness is generally defined as the ratio of the load applied to the surface area of the indentation. The Vickers hardness number Hv of Diamond Pyramid Number (DPN) is defined as
 (9)
(9)
where “a” is the apex angle of the indenter (a = 136˚). The Vickers hardness number is thus calculated using the relation,
 (10)
(10)
where “p” is the applied load in “kg” and “d” is the diagonal length of the indentation mark in “mm”. Hardness values are always measured from the observed size of the impression remaining after a loaded indenter has penetrated and has been removed from the surface. Thus, the observed hardness behaviour is the summation of a number of effects involved in the materials response to the indentation pressure during loading, in the final measurement of the residual impression. The importance of microhardness study lies in the possibilities of making an indirect estimate of mechanical characteristics of materials such as yield strength and toughness having a specific correlation with the hardness. The hardness measurements may depend upon the orientation of the indented crystals. To study the hardness anisotropy present in crystals, the crystals are initially mounted on the stage of microscope properly and indented. The initial position is 0 degree. The stage of the microscope was then rotated keeping the indenter fixed and “Hv” was measured at every 30 degrees interval till the original position. No distortion in shape of indenter will be observed with crystal orientation. When the variation of “Hv” with angular displacement is periodic, then it brings the anisotropic nature of crystals.
In the present work, microhardness measurement is a general microprobe technique for assessing the bond strength, apart being a measure of bulk strength. The crystal slices are well polished with a thickness variation less than 10 μm to avoid the surface defects, which influence the hardness value strongly. Micro hardness studies are carried out at room temperature using Shimadzu HMV-2000 fitted with Vickers pyramidal indenter. The load P is varied between 10 - 50 g and the time of indentation is kept constant as 15 seconds for all trials. The diagonal lengths of indentation are measured. The variation of hardness with applied load is shown in Figure 6. It is evident from the plot that the microhardness of the crystal increases with increasing loads. The increases in the microhardness values of PTPT with increasing load are in agreement with the reverse indentation size effect (ISE). The work hardening coefficient (n) was found to be 3.57 by taking slope in the straight line portion of the graph drawn between logP and logd (Figure 7). According to Onitsch, if “n” is greater than 2 the microhardness will increase with an increase in the load. If “n” are less than 2 the microhardness will decrease with an increase in the load. The work hardening coefficient (n) for PTPT crystal is greater than 2 which confirm that the hardness increases with the increase of the load.
3.5. Dielectric Studies
Dielectric measurement is one of the useful characterizations of electrical response of solids. A study of the dielectric properties of solids gives information about the electric field distribution within the solid. The frequency dependence of these properties gives a great insight into the materials applications. The different polarization mechanisms in solids can be understood from the study of dielectric constant as a function of frequency and
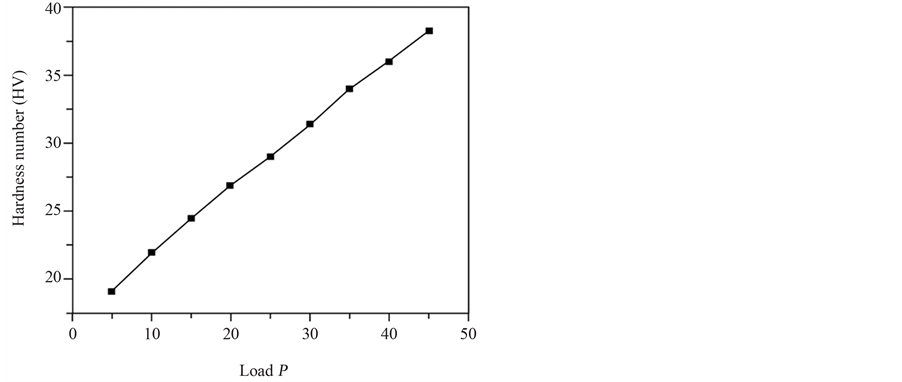
Figure 6. Variation of hardness versus P.

Figure 7. Plot of log P versus log d.
temperature. Polarization “P” of a dielectric is the numerical magnitude, which describes the phenomenon of polarization of a dielectric in an external electric field. In the absence of an external electric field, each element in the volume of a dielectric has no electric moment. The action of an electric field brings the charges of the molecules of the dielectric into a certain ordered arrangement in space. The study of dielectric constant of a material gives an insight into the nature of bonding in the material. The study of the electrical and other properties of dielectrics in relation to their chemical composition and structure will lay the basis for obtaining new materials with new properties. A lot of work had been carried out on dielectric measurement for a variety of materials including ceramics and single crystals by many authors yielding valuable information [11] -[13] . The relative dielectric constant (er) is defined as,
 (11)
(11)
It is known that,
 (12)
(12)
Hence,
 (13)
(13)
where, “A” is the area of the sample and “d” is the thickness of the sample. The relative permittivity (er) is usually known as permittivity. It is always greater than unity. The capacitance “C0” of a parallel plate condenser having a capacitance “C” in air can be given by,
 (14)
(14)
Thus,
 (15)
(15)
“er” can be found by the measurement of capacitance. The dielectric constant of a substance is a property of the constituent ions. Major contributions to the dielectric constant are fromThe extrinsic nature of the material2) The electronic polarizability 3) The ionic polarizability and 4) The deformation of the ions In the present work, the dielectric characteristics of the material are important to study the lattice dynamics in the crystal. Hence, the grown crystal was subjected to these studies using a HIOKI HITESTER model 3532-50 LCR meter in the frequency range from 50 Hz to 5 MHz for different temperatures. The surface of the sample was coated with silver paste for electrical contact. Figure 8 shows the plot of dielectric constant versus log frequency. The dielectric constant has high values in the lower frequency region and then it decreases with the increase in frequency. The very high value of dielectric constant at low frequencies may be due to the presence of all the four polarizations, namely, space charge, orientational, electronic and ionic polarization and its low value at higher frequencies may be due to the loss of these significant polarizations gradually. From the plot, it is also observed that dielectric constant increases with an increase in temperature and this is attributed to the presence of space charge polarization near the grain boundary interfaces, which depends on the purity and perfection of the sample [14] . The variations of dielectric loss with frequency are shown in Figure 9. The characteristics of low dielectric loss with high frequency for the sample suggest that it possesses enhanced optical quality with lesser defects and this parameter is of vital importance for nonlinear optical applications [15] . This behaviour is useful for the fabrication of microelectronic and nonlinear optical devices.
3.6. NLO Test—Kurtz Powder SHG Method
Growth of large single crystal is a slow and difficult process. Hence, it is highly desirable to have some technique of screening crystal structures to determine whether they are noncentrosymmetric and it is also equally

Figure 8. Variation of dielectric constant of PTPT single crystal.
important to know whether they are better than those currently known. Such a preliminary test should enable us to carry out the activity without requiring oriented samples. Kurtz and Perry proposed a powder SHG method for comprehensive analysis of the second order nonlinearity. Employing this technique, Kurtz surveyed a very large number of compounds. The nonlinear optical property of the grown single crystal is tested by passing the output of Nd:YAG Quanta ray laser through the crystalline powder sample. The schematic of the experimental setup used for SHG studies is shown in Figure 10. A Q-switched, mode locked Nd: YAG laser was used to generate about 6 mJ/pulse at the 1064 nm fundamental radiation. This laser can be operated in two modes. In the single shot mode, the laser emits a single 8 ns pulse. In the multishot mode, the laser produces a continuous train of 8 ns pulses at a repetition rate of 10 Hz. In the present study, a single shot mode of 8 ns laser pulse with a spot radius of 1mm was used. This experimental setup used a mirror and a 50/50 beam splitter (BS) to generate a beam with pulse energies about 6 mJ. The input laser beam was passed through an IR reflector and then directed on the microcrystalline powdered sample packed in a capillary tube of diameter 0.154 mm. The photodiode detector and oscilloscope assembly measure the light emitted by the sample. Microcrystalline powder of urea or KDP is taken in a similar capillary tube sealed at one end for comparison. The intensity of the second harmonic output from the sample is compared with that of either KDP or urea. Thus, the figure of merit of SHG of the sample is estimated.
In order to confirm the NLO property, the grown specimen was subjected to Kurtz powder test using a
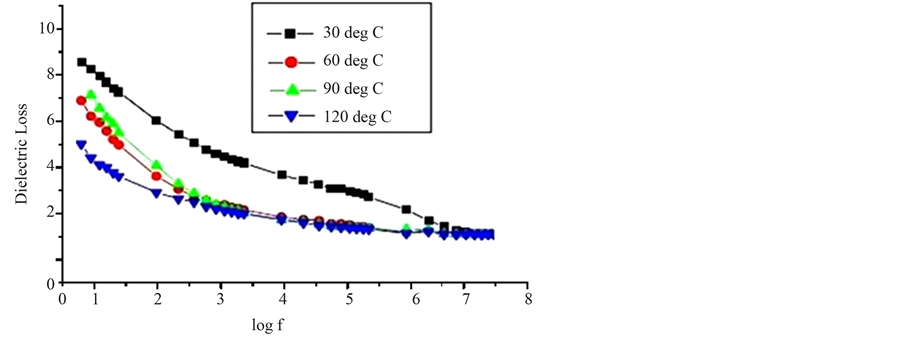
Figure 9. Variation of dielectric loss of PTPT single crystal.

Figure 10. Schematic experimental setup for SHG efficiency measurement.
Q-switched, mode locked Nd: YAG laser of 106.4 nm and pulse width of 8 ns (spot radius of 1 mm) on the powder sample of PTPT The input laser beam was directed on the as grown crystal powder to get maximum powder SHG. The emitted light passed through an IR filter was measured by means of a photo multiplier tube and oscilloscope assembly. The SHG efficiency of the PTPT crystal was evaluated by taking the microcrystalline powder of KDP as the reference material. The output light was passed through a monochromator which detected green light at 532 nm. This confirms the NLO behaviour of the material. The green light intensity was registered by a photomultiplier tube and converted into an electrical signal. This signal was displayed on the oscilloscope screen. The sample was replaced by potassium dihydrogen orthophosphate (KDP) and the signal was displayed in the oscilloscope screen. SHG conversion efficiency was computed by the ratio of signal amplitude of the PTPT sample to that of the KDP signal amplitude recorded for the same input powder. The SHG efficiency of the grown PTPT crystal was found to be twice than that of KDP. The increased SHG efficiency is due to higher polarizability of the material than that of KDP.
4. Conclusion
The single crystal of PTPT has been grown by slow evaporation technique. Single crystal XRD analysis confirms that the crystal belongs to monoclinic system. UV-Visible absorption spectrum shows excellent transmission in the entire visible region. The band gap, refractive index, reflectance, extinction coefficient and electrical susceptibility were calculated to analyze the optical property. The refractive index of the grown crystal has been determined using the Brewster angle method. The dielectric constant and dielectric loss have been studied as a function of frequency at different temperatures. The higher value of polarizability indicates that the second harmonic generation efficiency is more than that of standard material KDP. However, this material can be used in photonic and optoelectronic devices which more stability.
Acknowledgements
The author thanks the Management and Principal of Sree Sastha Institute of Engineering and Technology, Chembarambakkam, Chennai-600123 for their encouragements throughout this work.
References
- Prasad, P.N. and Williams, D.J. (1991) Introduction to Nonlinear Optical Effects in Molecules and Polymers. John Wiley & Sons, New York.
- Munn, R.W. and Ironside, C.N. (1993) Principles and Applications of Nonlinear Optical Materials. Chapman and Hall, London. http://dx.doi.org/10.1007/978-94-011-2158-3
- Bardan, J., Hierle, R., Perigaud, A., Zyss, J. and Williams, D.J. (1993) Nonlinear Optical Properties of Organic Molecules and Polymeric Materials, Vol. 223 of ACS Series. American Chemical Society, Washington.
- Xu, R.J. (2010) 4-Methoxyanilinium Iodide. Acta Crystallographica E, 66, Article ID: o1794.
- Gupta, V. and Mansingh, A. (1996) Influence of Post Deposition Annealing on the Structural and Optical Properties of Sputtered Zinc Oxide Film. Journal of Applied Physics, 80, 1063-1073. http://dx.doi.org/10.1063/1.362842
- Gaffar, M.A., Abu El-Fadl, A. and Bin Anooz, S., (2003) Influence of Strontium Doping on the Indirect Band Gap and Optical Constants of Ammonium Zinc Chloride Crystals. Physica B, 327, 43-54. http://dx.doi.org/10.1016/S0921-4526(02)01700-3
- Taber, D. (1951) The Hardness of Materials. Clarendon Press, Oxford.
- Pethica, J.B. and Taber, D. (1979) Contact of Characterized Metal Surface at Very Low Loads: Deformation and Adhesion. Surface Science, 89, 182-190. http://dx.doi.org/10.1016/0039-6028(79)90606-X
- Smith, R.L. and Sandland, G.E. (1923) An Accurate Method of Determining the Hardness of Metals with Reference to those of a High Degree of Hardness. Proceedings of the Institution of Mechanical Engineers, 1, 623-641.
- Batta Calleja, F.J., Rueda, D.R., Poster, R.S. and Mead, W.T. (1980) New Aspects of the Microhardness of Ultra Oriented Polyethiline. J. Master Science, 15, 762-765.
- Matthias, B.T. and Remeika, J.P. (1951) Dielectric Properties of Sodium and Potassium Niobate. Physical Review, 82, 727-729. http://dx.doi.org/10.1103/PhysRev.82.727
- Triebwasser, S. (1959) Study of Ferroelectric Transitions of Solid-Solution Single Crystals of KNbO3-KTaO3. Physical Review, 114, 63-70. http://dx.doi.org/10.1103/PhysRev.114.63
- Govinda, S. and Rao, K.V. (1975) Dielectric Properties of Single Crystals of Al2O3 and Al2O3 Doped with Chromium and Vanadium. Physica Status Solidi (A), 27, 639-644. http://dx.doi.org/10.1002/pssa.2210270237
- Smyth, C.P. (1965) Dielectric Behavior and Structure. McGraw-Hill, New York.
- Balarew, C. and Duhlew, R. (1984) Application of the Hard and Soft Acids and Bases Concept to Explain Ligand Coordination in Double Salt Structures. Journal of Solid State Chemistry, 55, 1-6. http://dx.doi.org/10.1016/0022-4596(84)90240-8
NOTES

*Corresponding author.