X. Z. Zhang et al.
reaction and high fineness, silica fume can make cement-based materials denser and improve their mechanical
property and durability [3].
On the other hand, silica fume containing a lot of the amorphous silica owns low permittivity and loss tangent
values. Therefore, compared with cement, silica fume has more excellent wave-transparent performance. So it
can be used to adjust electromagnetic properties of cement based materials [4]. Tan [5] found that electromag-
netic shielding of cement based materials was increased after adding silica fume. Zhang [6] used silica fume to
improve impedance matching between cement based absorbing materials and free space. Compared with the
single-layer structure, the reflectivity of the double-layer decreased by 6 - 8 dB. Although above-mentio ne d re-
searches referred to applications of silica fume in cement-based shielding and absorbing materials, influence of
silica fume on the reflectivity and transmission efficiency of cement-based materials has not been studied. So
cement based materials mixed with silica fume was prepared, and their properties were tested and analyzed
combined with its micro structure in this study.
2. Experimental Programs
2.1. Raw Materials
In this study, P.O 42.5 with 7.3 MPa flexural strength and 46.2 MPa compressive strength at 28 d was used. Its
chemical compositions are shown in Table 1. Chemical compositions of silica fume with 0.2 μm average par-
ticles size and 25,000 m2/kg specific surface areas are shown in Table 1. In addition, polycarboxylate superplas-
ticizer produced by Shandong Academy of Building Research and standard sand produced by China ISO Stan-
dard Sand Co., LTD. was also used in this study.
2.2. Sample Preparation
The cementitious materials/sand/water ratio by weight of mortar was selected as 1:3:0.5, and superplastiser was
used by cement mass 1.0%. Firstly, the water and polycarboxylate superplasticizer were poured into a mixer,
and then cement and silica fume were added. The mixture was slowly stirred for one minute, followed by rapid
stirring for 30 s before sand was added. After resting for 90 s, the mixture was rapidly stirred for another 60 s.
After completing the mixing, mortar was poured into models and vibrated to remove bubbles. The size of the
specimens is 180 mm × 180 mm × 10 mm. Then samples were put into standard curing box and specimens were
removed from their models 24 h later. Samp les were cured for 28 days at 20˚C ± 2˚C and 95% relative humidity.
2.3. Test Method
PNA E8363B vector network analyzer produced by Agilent Technologies was used to test reflectivity of speci-
mens by using the method of RCS (Radar Cross-Section). The measurement was carried out in the frequency
ranges of 6 - 18 GHz and 26.5 - 40 GHz; the measurement of transmission efficiency was carried out in the fre-
quency ranges of 8 - 12.4 GHz, 12.4 - 18 GHz and 26.5 - 40 GHz; PM60GT-18 mercury intrusion porosimeter
produced by QUANTATECH was used to test pore structure.
3. Results and Discussion
3.1. Effect of Silica Fume on the Pore Structure
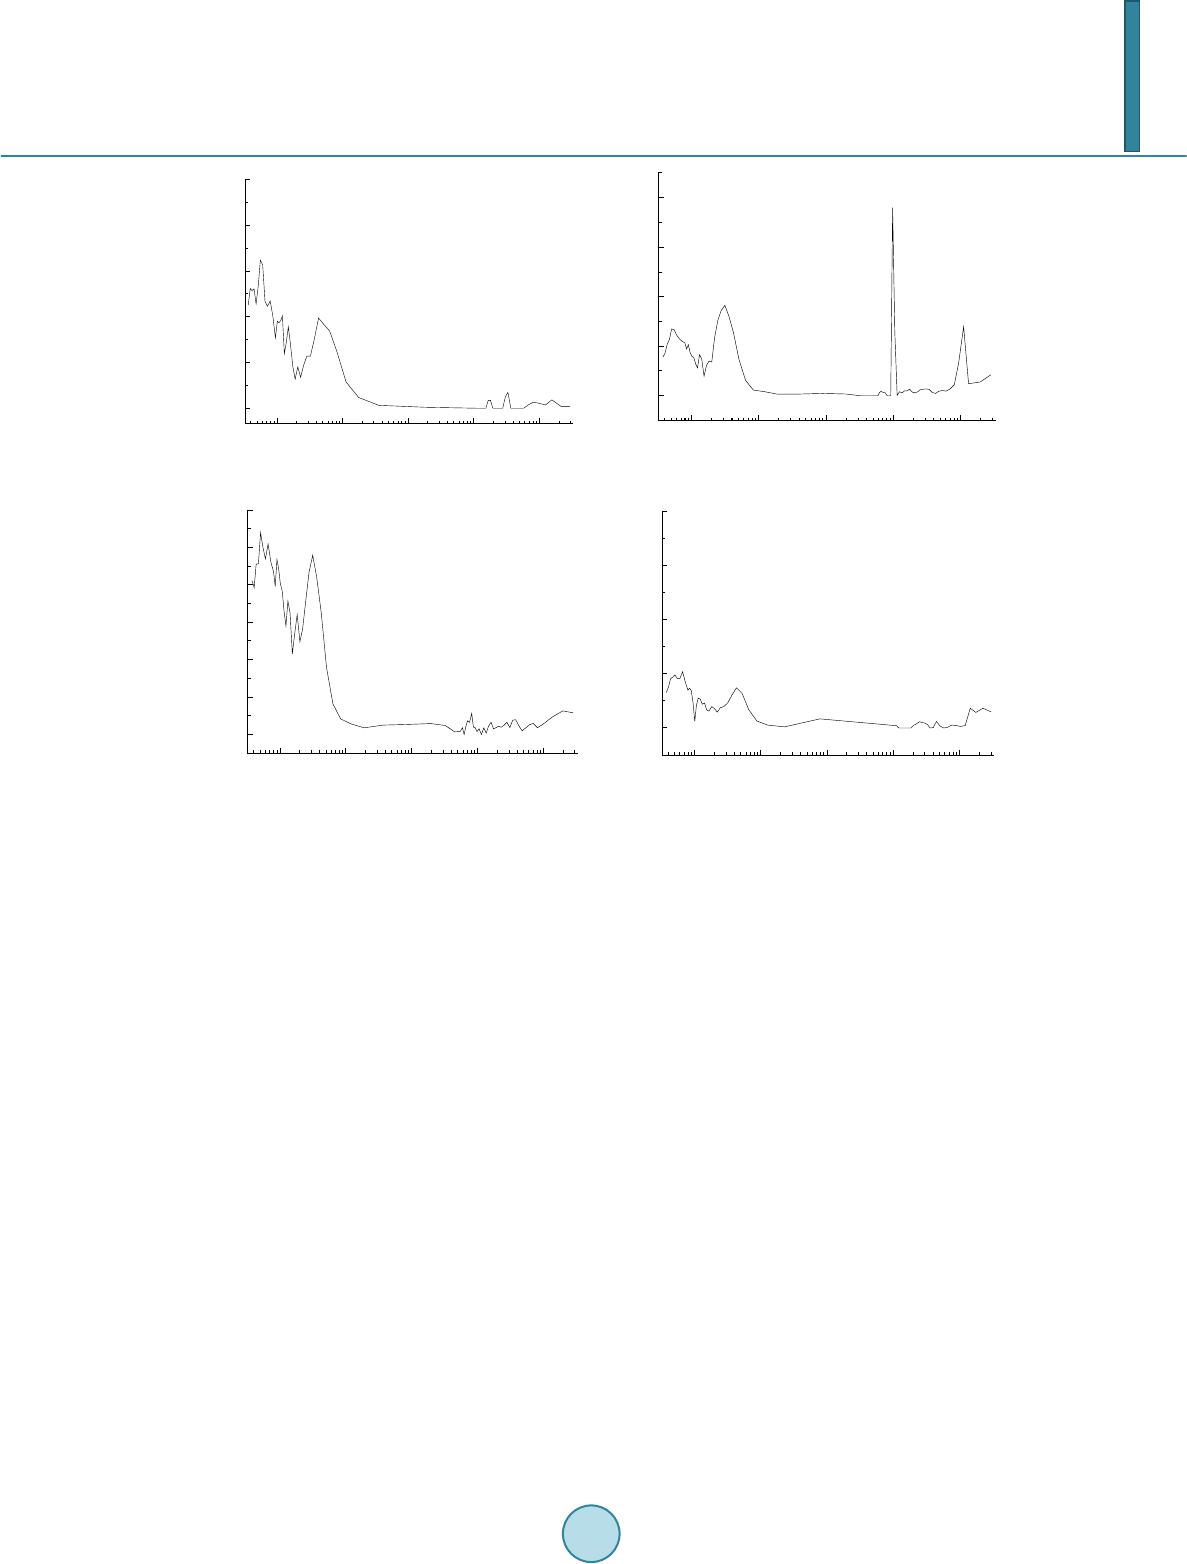
Figure 1 shows the pore size distribution of specimens with different content of silica fume.
In Figure 1(a), pore size distribution of ordinary mortar is mainly less than 0.1 μm and pore size distribution
of ordinary mortar greater than 0.1 μm is almost zero. In Figur es 3(b)-(d), except for specimens with 6% con-
tent of silica fume, pore smaller than 0.1 μm of other specimens reduces significantly after adding silica fume. It
Table 1. Chemical compositions (%).
Materials SiO2 Al2O3 Fe2O3 CaO MgO SO3 K2O Na2O TiO2 P2O5 MnO SrO
Cement 22.89 6.98 3.11 55.64 4.51 2.21 0.61 0.27 0.41 0.15 0.29 0.034
Silica fume 96.62
0.21
0.06 1.26 0.40 0.17 0.84 0.21 / 0.14 0.01 0.01