 Vol.3, No.5, 379-387 (2011) Natural Science http://dx.doi.org/10.4236/ns.2011.35051 Copyright © 2011 SciRes. OPEN ACCESS New mutational trends in the HA protein of 2009 H1N1 pandemic influenza virus from May 2010 to February 2011 Wei Hu Department of Computer Science, Houghton College, Houghton, USA; wei.hu@houghton.edu Received 2 March 2011; revised 5 April 2011; accepted 21 April 2011. ABSTRACT As we enter the year of 2011, the 2009 H1N1 pandemic influenza virus is in the news again. At least 20 people have died of this virus in China since the beginning of 2011 and it is now the predominant flu strain in the country. Al- though this novel virus was quite stable during its run in the flu season of 2009-2010, a genetic variant of this virus was found in Singapore in early 2010, and then in Australia and New Zea- land during their 2010 winter influenza season. Several critical mutations in the HA protein of this variant were uncovered in the strains col- lected from January 2010 to April 2010. More- over, a structural homology model of HA from the A/Brisbane/10/2010(H1N1) strain was made based on the structure of A/California/04/2009 (H1N1). The purpose of this study was to inves- tigate mutations in the HA protein of 2009 H1N1 from sequence data collected worldwide from May 2010 to February 2011. A fundamental problem in bioinformatics and biology is to find the similar gene sequences for a given gene sequence of interest. Here we proposed the in- verse problem, i.e., finding the exemplars from a group of related gene sequences. With a clus- tering algorithm affinity propagation, six exem- plars of the HA sequences were identified to represent six clusters. One of the clusters con- tained strain A/Brisbane/12/2010(H1N1) that only differed from A/Brisbane/10/2010 in the HA se- quence at position 449. Based on the sequence identity of the six exemplars, nine mutations in HA were located that could be used to distin- guish these six clusters. Finally, we discovered the change of correlation patterns for the HA and NA of 2009 H1N1 as a result of the HA re- ceptor binding specificity switch, revealing the balanced interplay between these two surface proteins of the virus. Keywords: 2009 H1N1; Affinity Propagation; Clustering Algorithms; Entropy; Exemplars; Hemagglutinin; Influenza; Informational Spectrum Method; Mutation; Mutual Information; Receptor Binding Specificity 1. INTRODUCTION A report on February 10, 2011 indicated that 2009 H1N1 has become the predominant strain of influenza virus in China and caused at least twenty deaths in the country since the beginning of 2011 [1]. As the 2010- 2011 flu season continues, this virus remains a public health concern. This novel swine-origin virus maintained its genetic stability during its run in the 2009-2010 flu season for the most part. However, a genetic variant of this virus was found first in Singapore, and then in Oce- ania including Australia and New Zealand during the southern hemisphere 2010 winter. Several vaccine break- throughs and fatal cases might be linked to this variant [2]. These new developments call for a continued sur- veillance of its circulation and evolution, even though extensive research on 2009 H1N1 has been conducted including a series of studies in [3-13]. Several critical mutations including D94N, N125D, and V250A in the HA protein of this variant were dis- covered in the strains collected from January 2010 to April 2010. Furthermore, structural homology model of HA from the A/Brisbane/10/2010 strain was created based on the A/California/04/2009 structure. Interest- ingly, two mutations D94N and V250A tended to occur in pairs [2,14]. The bioinformatics analysis in [13] sug- gested that the reason for this pairing was to allow the virus to maintain HA binding to human type receptor, so the virus could replicate in humans efficiently. Using this interpretation as guide, a new mutation V30A was  W. Hu / Natural Science 3 (2011) 379-387 Copyright © 2011 SciRes. OPEN ACCESS 380 uncovered in the strains from Singapore that could compensate for N125D as V250A did for D94N. These mutations were found to cause the HA receptor binding specificity shift from A/California/07/2009, a strain used in the vaccine for 2009 H1N1. After the discovery of this new variant, the natural question is what happened next to this virus. Our interest in this study was to expand the work started in [13] to examine the HA mutations in the strains of 2009 H1N1 collected after 05-01-2010 and compared them to those collected before 05-01-2010. Due to the enormous global efforts, large number of 2009 H1N1 sequences have been collected. One chal- lenge facing us today is how to extract useful informa- tion and knowledge for this virus from this huge data- base of sequences. A fundamental problem in bioinfor- matics and biology is to find the similar gene sequences for a given gene sequence of interest. Here we asked the inverse problem: given a collection of related gene se- quences, what are the exemplars of these sequences. In the present study, a clustering strategy affinity propaga- tion [15] was employed to find exemplars of the HA sequences of 2009 H1N1 collected between 05-01-2010 and 02-22-2011. These exemplars served as the starting point to uncover the mutations in the HA protein of 2009 H1N1 after 05-01-2010. The HA protein of 2009 H1N1 exhibits dual receptor binding preference [11,16], which prompted us to ex- plore the effects of binding preference change on NA because the balance between host cell binding and sialic acid receptor destruction needs to be maintained by HA and NA. With the large number of 2009 H1N1 se- quences collected to date, it is now possible to conduct bioinformatics analysis to probe this kind of interactions between HA and NA. Therefore, another task of our study is to investigate the cooperation between the HA and NA of 2009 H1N1 in the process of HA receptor binding affinity shift. 2. MATERIALS AND METHODS 2.1. Sequence Data Protein sequences of influenza were retrieved from the EpiFlu Database (http://platform.gisaid.org) of GI- SAID. Only the full length and unique sequences were selected. All sequences used in this study were aligned with MAFFT [17]. 2.2. Affinity Propagation At present, several clustering algorithms such as K- means use data to find centers of clusters. The novelty of affinity propagation clustering algorithm [15,18] lies in the search of exemplars from data to represent clusters through message passing. The data points in a cluster connects to the exemplar that best represents it. Affinity propagation (AP) was designed to searches for a set of exemplars from n data points so the minima of the following energy function could be achieved 1, ,0 n ii i Eesie sie where i e represents the exemplar of data point i, and ,i ie is the similarity between data point i and its exemplar i e. In general, finding an optimal set of ex- emplars from data is a computationally intensive en- deavor. However, the identification of these exemplars in AP were accomplished with an efficient algorithm that employs real-valued messages exchanged among data points. There were two types of messages, respon- sibility and availability. The responsibility ,rik , sent from data point i to candidate exemplar point k, re- flects the suitability for point k to be the exemplar for point i. The availability ,aik, sent from candidate exemplar point k to point i, represents the propensity for point i to choose point k as its exemplar. In this study, the similarity used as input to AP is the Hamming distance between two sequences. At the beginning of affinity propagation the availability matrix is set to zero, and then repeat the following iteration until a stopping criterion is satisfied: .. ,,max ,, kstk k r iks ika iks ik .. , ,min0,, max0,, isti ik aikrkkri k .. ,max0,, istik akkrik At each iteration, the messages indicate the current af- finity between data points and their exemplars. After this original AP model, a binary variable model for affinity propagation was proposed in [19], and several applica- tions of AP could be found in [20-22]. 2.3. Informational Spectrum Method The informational spectrum method (ISM) is a bioin- formatics technique that can be used to analyze protein sequences [23-27]. The idea is to translate the protein sequences into numerical sequences based on elec- tron-ion interaction potential (EIIP) of each amino acid. Then the Discrete Fourier Transform (DFT) can be ap- plied to these numerical sequences, and the resulting DFT coefficients are used to produce the energy density spectrum. The informational spectrum (IS) comprises the frequencies and the amplitudes of this energy density spectrum. According to the ISM theory, the peak fre- quencies of IS of a protein sequence reflect its biological or biochemical functions. The ISM was successfully  W. Hu / Natural Science 3 (2011) 379-387 Copyright © 2011 SciRes. OPEN ACCESS 381 applied to quantify the effects of HA mutations on the receptor binding preference in [8] and reveal the change of receptor binding selection caused by the mutations identified in [13]. Table 1 shows several common IS frequencies identified in [23,24]. It was observed in [11,16] that some of the strains of 2009 H1N1 displayed dual HA receptor binding prefer- ence. Consequently, in this study we used top two IS frequencies, one primary and one secondary, to describe the HA receptor selection. 2.4. Entropy and Mutual Information In information theory [28,29], entropy is a measure of the uncertainty associated with a random variable. Let x be a discrete random variable that has a set of possible values 123 ,,,, n aaa a with probabilities 123 ,,,, n ppp p where ii Px ap. The entropy H of x is log ii i xpp The mutual information of two random variables is a quantity that measures the mutual dependence of the two variables or the average amount of information that x conveys about y, which can defined as ,, xyH xHyH xy where x is the entropy of x, and , xy is the joint entropy of x and y. ,0Ixy if and only if x and y are independent random variables. In the current study, each of the n columns in a multi- ple sequence alignment of a set of influenza protein se- quences of length N is considered as a discrete random variable xi (1 ≤ i ≤ N) that takes on one of the 20 (n = 20) amino acid types with some probability. i x has its minimum value 0 if all the amino acids at position i are the same, and achieves its maximum if all the 20 amino acid types appear with equal probability at position i, which can be verified by the Lagrange multiplier tech- nique. A position of high entropy means that the amino acids are often varied at this position. While i x measures the genetic diversity at position i in our current study, , ii xy measures the correlation between amino acid substitutions at positions i and j. 3. RESULTS 3.1. Mutations in HA and NA of 2009 H1N1 after 05-01-2011 With a clustering technique affinity propagation [15], we were able to find six exemplars of the HA sequences of 2009 H1N1 collected between 05-01-2010 and 02-22- 2011, representing six different clusters (Table 2). Mu- tations at nine positions 97, 125, 134, 183, 185, 295, 374, 441, and 451 in the HA protein were identified, which could be used to distinguish these exemplars and clusters. One of them happened to be N125D (Figure 1), a muta- tion found in the genetic variant of 2009 H1N1 in Sin- gapore, Australia and New Zealand [2]. The HA active site is located in a cleft, which is lined by several con- served residues 91, 150, 152, 180, 187, 191, and 192, and the cleft is formed by its right edge (131_GVTAA) and left edge (221_RGQAGR) [30]. It was worth noting that three of the nine mutation sites, 134, 183, and 185, were close to some of these critical sites in HA. Cluster 1 contained a strain A/Brisbane/12/2010, which is dif- ferent from the model strain A/Brisbane/10/2010 in [2] Table 1. Characteristic IS frequencies of HA proteins in 2009 H1N1, swine H1N1/H1N2, avian H1N1, and A/South Caro- lina/1/18 (H1N1). Subtype 2009 H1N1 Swine H1N2/H1N1 Avian H1N1 A/South Carolina/1/18 (H1N1) Frequency F(0.295) F(0.055) F(0.282) F(0.258) Table 2. Meta information for the six exemplars and six clusters from the HA sequences of 2009 H1N1 between 05-01-2010 and 02-22-2011. Cluster Number Primary Frequency Secondary Frequency Cluster Size Exemplar Strain ID Cluster 1 0.258 0.295 21 A/Navarra/RR6914/10 Cluster 2 0.295 0.055 44 A/Bangladesh/5557/2010 Cluster 3 0.295 0.258 12 A/Guatemala/287/2010 Cluster 4 0.295 0.055 15 A/Madrid/SO8034/10 Cluster 5 0.295 0.282 17 A/Pennsylvania/34/2010 Cluster 6 0.295 0.258 30 A/Vaxjo/2/2010  W. Hu / Natural Science 3 (2011) 379-387 Copyright © 2011 SciRes. OPEN ACCESS 382 Figure 1. Amino acid logo at positions 97, 125, 134, 183, 185, 295, 374, 441 and 451 in the HA sequences of the six clusters after 05-01-2010 and the HA sequences before 05-01-2010. These nine positions are ordered as 1, 2, 3, 4, 5, 6, 7, 8 and 9 in the figure. by only one amino acid at position 449, and this cluster carried the signature mutation N125D. The different HA binding preferences of the six clus- ters as primary IS frequency and secondary frequency were calculated, manifesting the impact of the nine mu- tations on receptor selection (Table 2). The analysis in [13] studied the HA receptor specificity of 2009 H1N1 as a function of time, which showed that the virus dem- onstrated swine receptor preference in the early months of its course, and this preference gradually disappeared in the late months as a whole group. But there were strains, those in clusters 2 and 4, collected after 05-01- 2010 that still displayed swine receptor selection at fre- quency F(0.055) (Table 2). It is well-known that HA and NA depend on each other. To reveal the influence of the nine mutations in HA on the NA protein, we also looked into the corre- sponding NA sequences. There were four positions 241, 366, 369, and 394 in the consensus NA sequences of the six clusters that had different amino acids, implying less variation in NA compared to HA (Figure 2). The Ham- ming distances of the six consensus HA amino acid se- quences after 05-01-2010 from that before 05-01-2010 were in the range of 1 to 4, whereas the same Hamming distances for NA were in the range of 0 to 2 (Figures 1 and 2). The amino acid logos in Figures 1 and 2 illus- trated the consensus and variation of the amino acids at these selected positions in HA and NA. The active site of NA is lined by several conserved re- sidues (117-119, 133-138, 146-152, 156, 179, 180, 196-200, 223-228, 243-247, 277, 278, 293, 295, 344-347, 368, 401, 402, and 426-441) that participate in recogni- tion of its substrate [31]. Three of the four mutations in NA, 241, 366, and 369, were near some of these key residues. In [32] the role of second active site in NA was assessed. It found that in avian NA the interaction be- tween this second site and the primary site is essential for NA function, and the NA of 2009 H1N1 has retained some of the important features of the second site. Fol- lowing [32], we listed the amino acids at the positions that are lined with the second site (N2 numbering) (Ta- ble 3). It appeared that the major difference in amino acids occurred at position 372 for the six clusters and A/California/04/2009(H1N1) (Cal_04_09). The entropy at a position in an alignment of protein sequences measures the propensity of amino acids to change at that position. To gain a global perspective of HA and NA sequence variation before and after 05-01- 2010, the entropy of these proteins was calculated (Fig- ure 3). Furthermore, top 25 entropy positions in each protein were selected (Figure 4). As a general trend, the number of positive entropy positions before 05-01-2010 was larger than after 05-01-201. However, the magni- 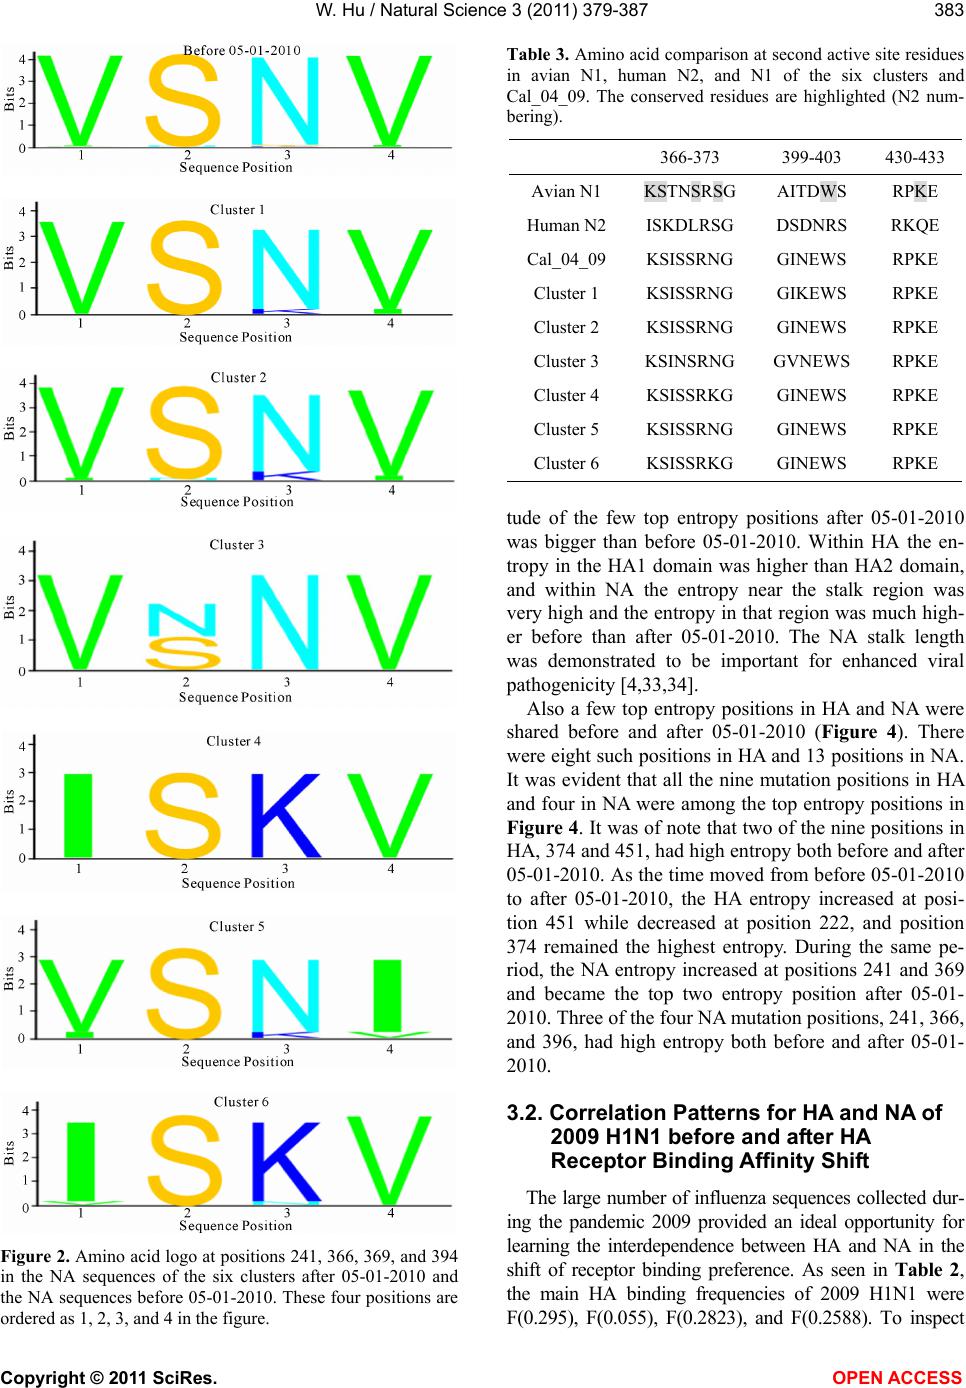 W. Hu / Natural Science 3 (2011) 379-387 Copyright © 2011 SciRes. OPEN ACCESS 383 Figure 2. Amino acid logo at positions 241, 366, 369, and 394 in the NA sequences of the six clusters after 05-01-2010 and the NA sequences before 05-01-2010. These four positions are ordered as 1, 2, 3, and 4 in the figure. Table 3. Amino acid comparison at second active site residues in avian N1, human N2, and N1 of the six clusters and Cal_04_09. The conserved residues are highlighted (N2 num- bering). 366-373 399-403 430-433 Avian N1 KSTNSRSG AITDWS RPKE Human N2 ISKDLRSG DSDNRS RKQE Cal_04_09 KSISSRNG GINEWS RPKE Cluster 1 KSISSRNG GIKEWS RPKE Cluster 2 KSISSRNG GINEWS RPKE Cluster 3 KSINSRNG GVNEWS RPKE Cluster 4 KSISSRKG GINEWS RPKE Cluster 5 KSISSRNG GINEWS RPKE Cluster 6 KSISSRKG GINEWS RPKE tude of the few top entropy positions after 05-01-2010 was bigger than before 05-01-2010. Within HA the en- tropy in the HA1 domain was higher than HA2 domain, and within NA the entropy near the stalk region was very high and the entropy in that region was much high- er before than after 05-01-2010. The NA stalk length was demonstrated to be important for enhanced viral pathogenicity [4,33,34]. Also a few top entropy positions in HA and NA were shared before and after 05-01-2010 (Figure 4). There were eight such positions in HA and 13 positions in NA. It was evident that all the nine mutation positions in HA and four in NA were among the top entropy positions in Figure 4. It was of note that two of the nine positions in HA, 374 and 451, had high entropy both before and after 05-01-2010. As the time moved from before 05-01-2010 to after 05-01-2010, the HA entropy increased at posi- tion 451 while decreased at position 222, and position 374 remained the highest entropy. During the same pe- riod, the NA entropy increased at positions 241 and 369 and became the top two entropy position after 05-01- 2010. Three of the four NA mutation positions, 241, 366, and 396, had high entropy both before and after 05-01- 2010. 3.2. Correlation Patterns for HA and NA of 2009 H1N1 before and after HA Receptor Binding Affinity Shift The large number of influenza sequences collected dur- ing the pandemic 2009 provided an ideal opportunity for learning the interdependence between HA and NA in the shift of receptor binding preference. As seen in Ta ble 2, the main HA binding frequencies of 2009 H1N1 were F(0.295), F(0.055), F(0.2823), and F(0.2588). To inspect 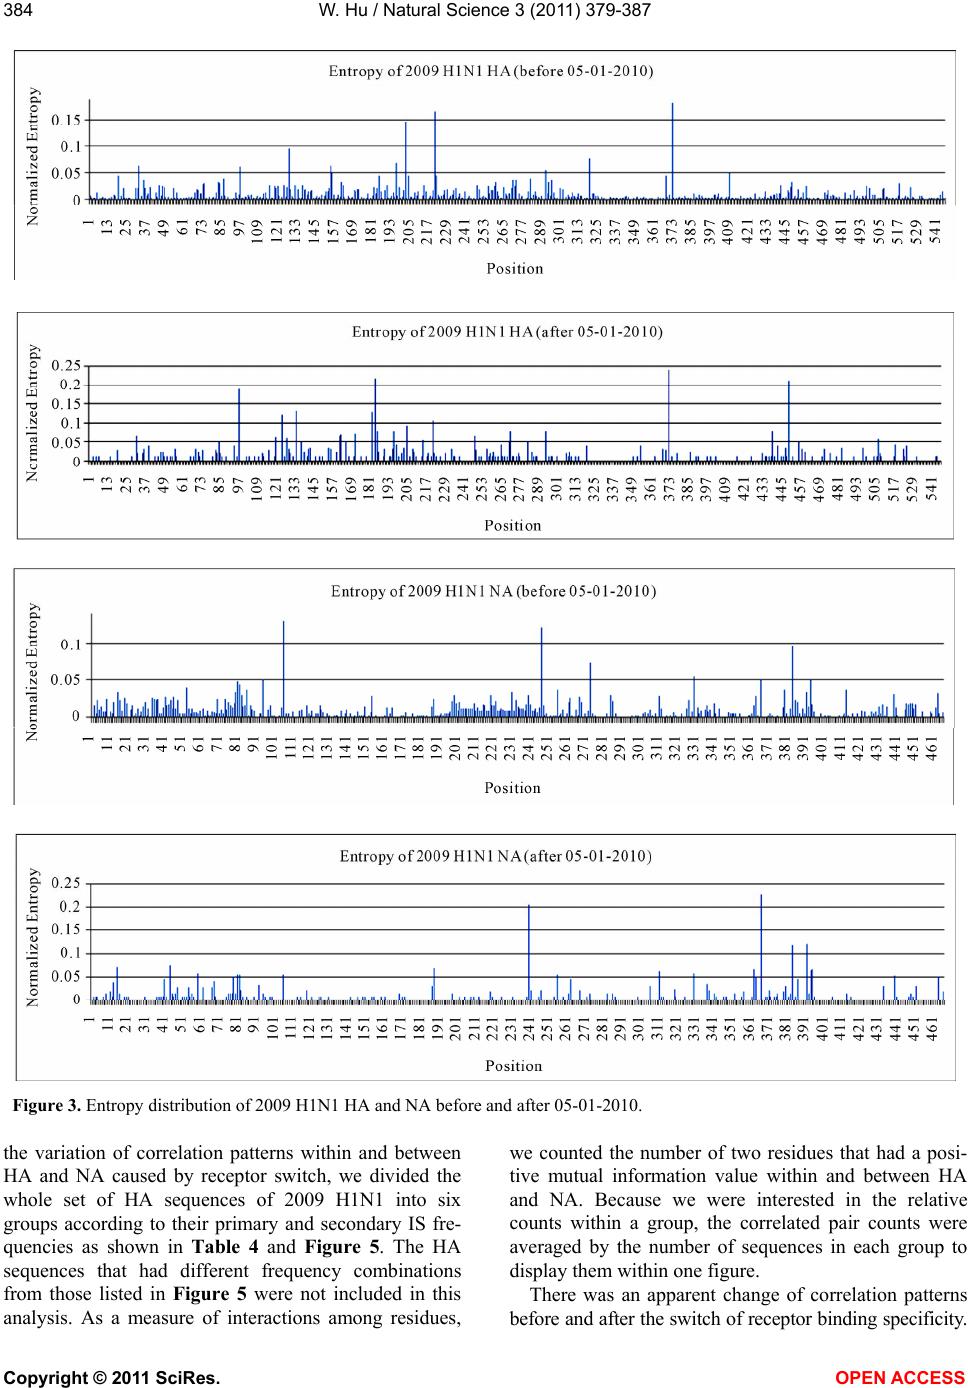 W. Hu / Natural Science 3 (2011) 379-387 Copyright © 2011 SciRes. OPEN ACCESS 384 Figure 3. Entropy distribution of 2009 H1N1 HA and NA before and after 05-01-2010. the variation of correlation patterns within and between HA and NA caused by receptor switch, we divided the whole set of HA sequences of 2009 H1N1 into six groups according to their primary and secondary IS fre- quencies as shown in Table 4 and Figure 5. The HA sequences that had different frequency combinations from those listed in Figure 5 were not included in this analysis. As a measure of interactions among residues, we counted the number of two residues that had a posi- tive mutual information value within and between HA and NA. Because we were interested in the relative counts within a group, the correlated pair counts were averaged by the number of sequences in each group to display them within one figure. There was an apparent change of correlation patterns before and after the switch of receptor binding specificity. 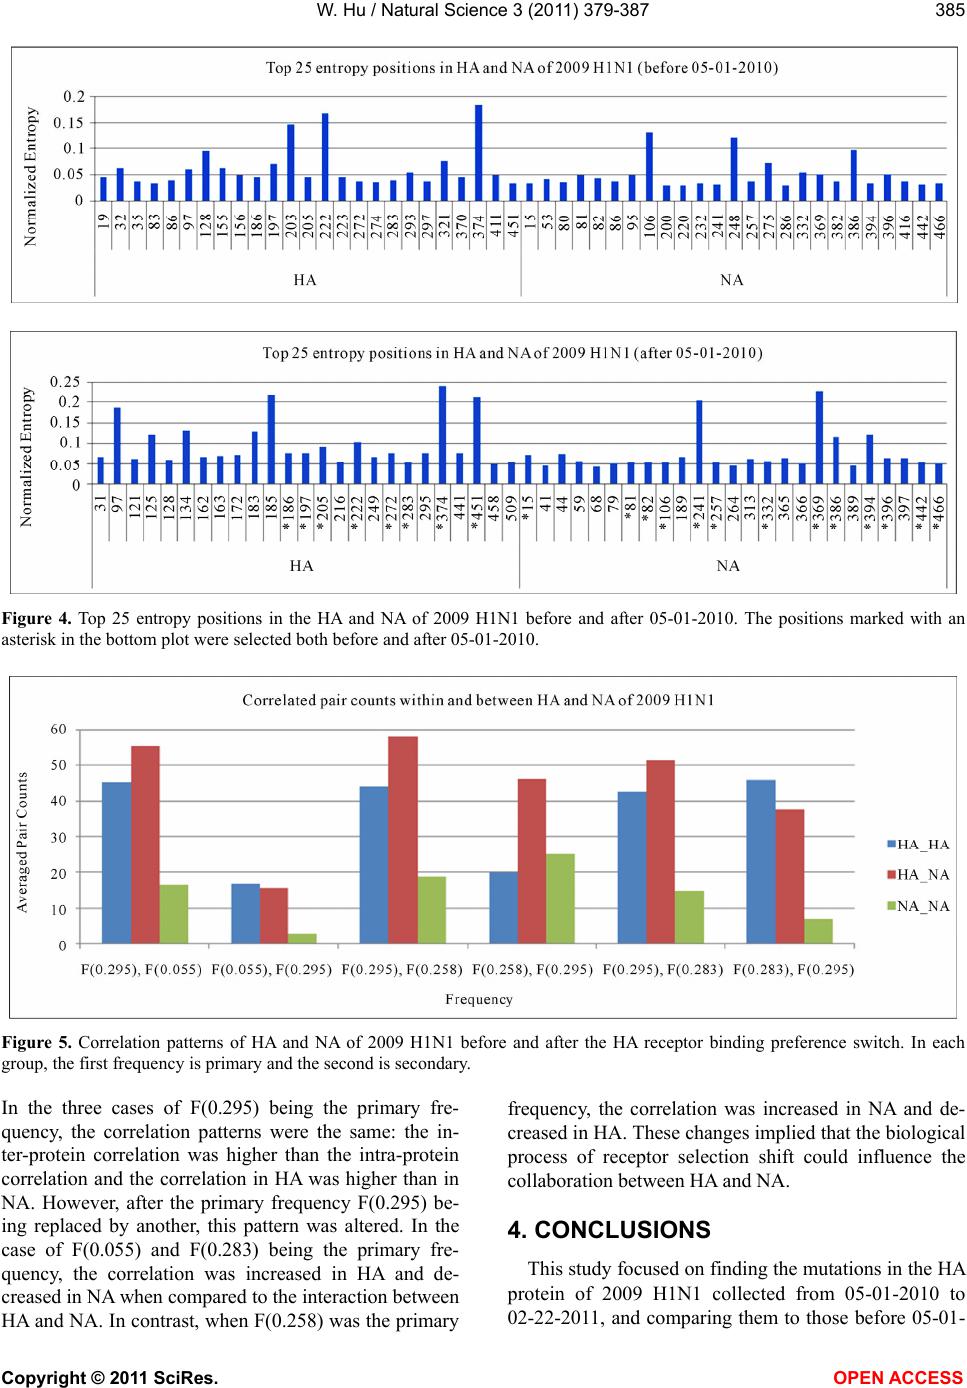 W. Hu / Natural Science 3 (2011) 379-387 Copyright © 2011 SciRes. OPEN ACCESS 385 Figure 4. Top 25 entropy positions in the HA and NA of 2009 H1N1 before and after 05-01-2010. The positions marked with an asterisk in the bottom plot were selected both before and after 05-01-2010. Figure 5. Correlation patterns of HA and NA of 2009 H1N1 before and after the HA receptor binding preference switch. In each group, the first frequency is primary and the second is secondary. In the three cases of F(0.295) being the primary fre- quency, the correlation patterns were the same: the in- ter-protein correlation was higher than the intra-protein correlation and the correlation in HA was higher than in NA. However, after the primary frequency F(0.295) be- ing replaced by another, this pattern was altered. In the case of F(0.055) and F(0.283) being the primary fre- quency, the correlation was increased in HA and de- creased in NA when compared to the interaction between HA and NA. In contrast, when F(0.258) was the primary frequency, the correlation was increased in NA and de- creased in HA. These changes implied that the biological process of receptor selection shift could influence the collaboration between HA and NA. 4. CONCLUSIONS This study focused on finding the mutations in the HA protein of 2009 H1N1 collected from 05-01-2010 to 02-22-2011, and comparing them to those before 05-01- 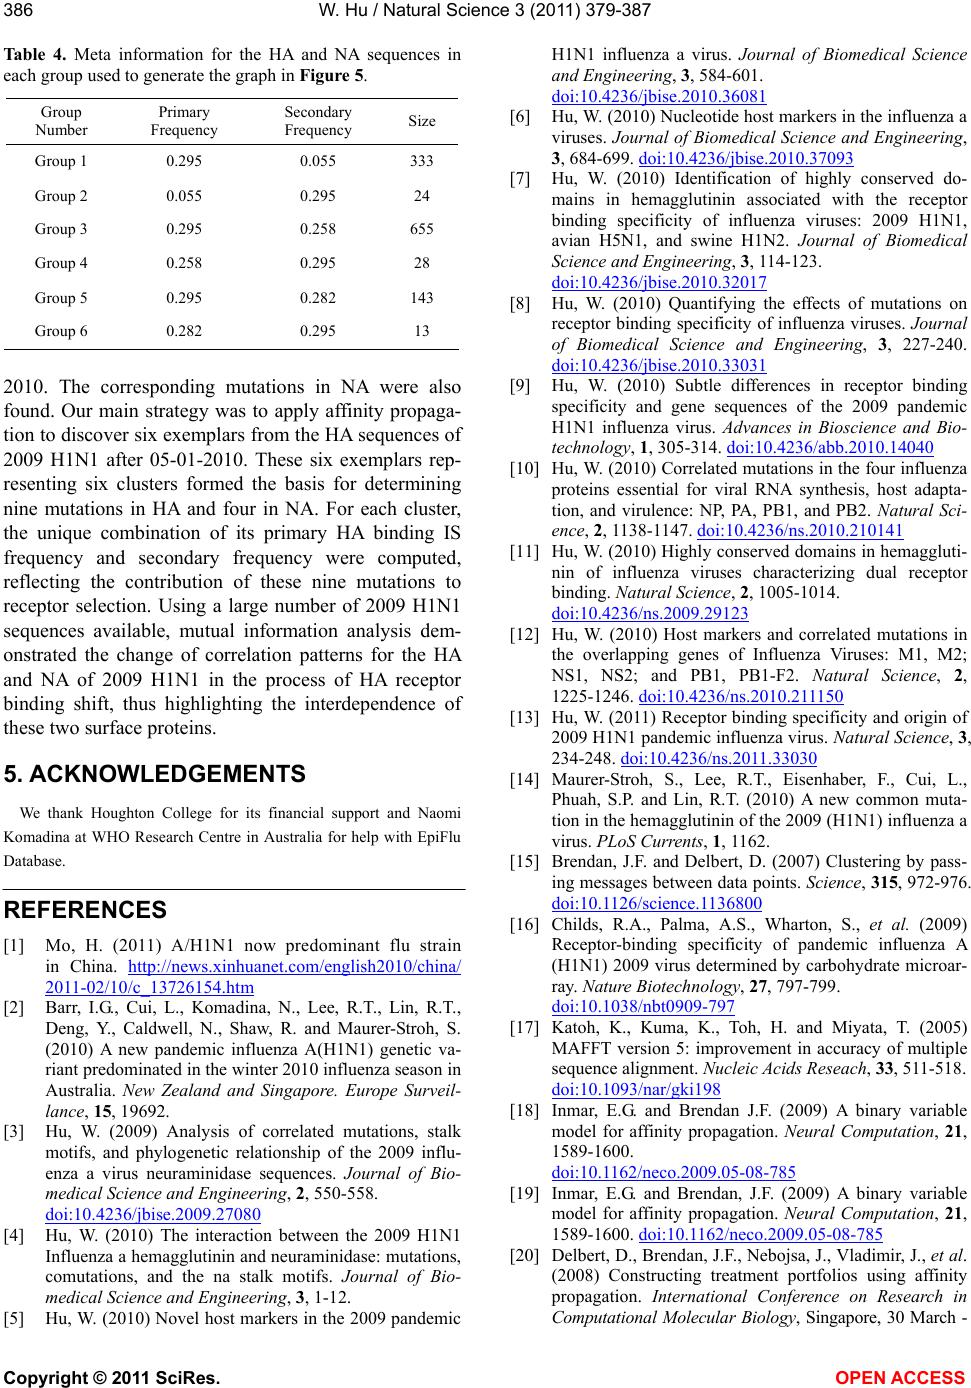 W. Hu / Natural Science 3 (2011) 379-387 Copyright © 2011 SciRes. OPEN ACCESS 386 Table 4. Meta information for the HA and NA sequences in each group used to generate the graph in Figure 5. Group Number Primary Frequency Secondary Frequency Size Group 1 0.295 0.055 333 Group 2 0.055 0.295 24 Group 3 0.295 0.258 655 Group 4 0.258 0.295 28 Group 5 0.295 0.282 143 Group 6 0.282 0.295 13 2010. The corresponding mutations in NA were also found. Our main strategy was to apply affinity propaga- tion to discover six exemplars from the HA sequences of 2009 H1N1 after 05-01-2010. These six exemplars rep- resenting six clusters formed the basis for determining nine mutations in HA and four in NA. For each cluster, the unique combination of its primary HA binding IS frequency and secondary frequency were computed, reflecting the contribution of these nine mutations to receptor selection. Using a large number of 2009 H1N1 sequences available, mutual information analysis dem- onstrated the change of correlation patterns for the HA and NA of 2009 H1N1 in the process of HA receptor binding shift, thus highlighting the interdependence of these two surface proteins. 5. ACKNOWLEDGEMENTS We thank Houghton College for its financial support and Naomi Komadina at WHO Research Centre in Australia for help with EpiFlu Database. REFERENCES [1] Mo, H. (2011) A/H1N1 now predominant flu strain in China. http://news.xinhuanet.com/english2010/china/ 2011-02/10/c_13726154.htm [2] Barr, I.G., Cui, L., Komadina, N., Lee, R.T., Lin, R.T., Deng, Y., Caldwell, N., Shaw, R. and Maurer-Stroh, S. (2010) A new pandemic influenza A(H1N1) genetic va- riant predominated in the winter 2010 influenza season in Australia. New Zealand and Singapore. Europe Surveil- lance, 15, 19692. [3] Hu, W. (2009) Analysis of correlated mutations, stalk motifs, and phylogenetic relationship of the 2009 influ- enza a virus neuraminidase sequences. Journal of Bio- medical Science and Engineering, 2, 550-558. doi:10.4236/jbise.2009.27080 [4] Hu, W. (2010) The interaction between the 2009 H1N1 Influenza a hemagglutinin and neuraminidase: mutations, comutations, and the na stalk motifs. Journal of Bio- medical Science and Engineering, 3, 1-12. [5] Hu, W. (2010) Novel host markers in the 2009 pandemic H1N1 influenza a virus. Journal of Biomedical Science and Engineering, 3, 584-601. doi:10.4236/jbise.2010.36081 [6] Hu, W. (2010) Nucleotide host markers in the influenza a viruses. Journal of Biomedical Science and Engineering, 3, 684-699. doi:10.4236/jbise.2010.37093 [7] Hu, W. (2010) Identification of highly conserved do- mains in hemagglutinin associated with the receptor binding specificity of influenza viruses: 2009 H1N1, avian H5N1, and swine H1N2. Journal of Biomedical Science and Engineering, 3, 114-123. doi:10.4236/jbise.2010.32017 [8] Hu, W. (2010) Quantifying the effects of mutations on receptor binding specificity of influenza viruses. Journal of Biomedical Science and Engineering, 3, 227-240. doi:10.4236/jbise.2010.33031 [9] Hu, W. (2010) Subtle differences in receptor binding specificity and gene sequences of the 2009 pandemic H1N1 influenza virus. Advances in Bioscience and Bio- technology, 1, 305-314. doi:10.4236/abb.2010.14040 [10] Hu, W. (2010) Correlated mutations in the four influenza proteins essential for viral RNA synthesis, host adapta- tion, and virulence: NP, PA, PB1, and PB2. Natural Sci- ence, 2, 1138-1147. doi:10.4236/ns.2010.210141 [11] Hu, W. (2010) Highly conserved domains in hemaggluti- nin of influenza viruses characterizing dual receptor binding. Natural Science, 2, 1005-1014. doi:10.4236/ns.2009.29123 [12] Hu, W. (2010) Host markers and correlated mutations in the overlapping genes of Influenza Viruses: M1, M2; NS1, NS2; and PB1, PB1-F2. Natural Science, 2, 1225-1246. doi:10.4236/ns.2010.211150 [13] Hu, W. (2011) Receptor binding specificity and origin of 2009 H1N1 pandemic influenza virus. Natural Science, 3, 234-248. doi:10.4236/ns.2011.33030 [14] Maurer-Stroh, S., Lee, R.T., Eisenhaber, F., Cui, L., Phuah, S.P. and Lin, R.T. (2010) A new common muta- tion in the hemagglutinin of the 2009 (H1N1) influenza a virus. PLoS Currents, 1, 1162. [15] Brendan, J.F. and Delbert, D. (2007) Clustering by pass- ing messages between data points. Science, 315, 972-976. doi:10.1126/science.1136800 [16] Childs, R.A., Palma, A.S., Wharton, S., et al. (2009) Receptor-binding specificity of pandemic influenza A (H1N1) 2009 virus determined by carbohydrate microar- ray. Nature Biotechnology, 27, 797-799. doi:10.1038/nbt0909-797 [17] Katoh, K., Kuma, K., Toh, H. and Miyata, T. (2005) MAFFT version 5: improvement in accuracy of multiple sequence alignment. Nucleic Acids Reseach, 33, 511-518. doi:10.1093/nar/gki198 [18] Inmar, E.G. and Brendan J.F. (2009) A binary variable model for affinity propagation. Neural Computation, 21, 1589-1600. doi:10.1162/neco.2009.05-08-785 [19] Inmar, E.G. and Brendan, J.F. (2009) A binary variable model for affinity propagation. Neural Computation, 21, 1589-1600. doi:10.1162/neco.2009.05-08-785 [20] Delbert, D., Brendan, J.F., Nebojsa, J., Vladimir, J., et al. (2008) Constructing treatment portfolios using affinity propagation. International Conference on Research in Computational Molecular Biology, Singapore, 30 March -  W. Hu / Natural Science 3 (2011) 379-387 Copyright © 2011 SciRes. OPEN ACCESS 387 2 February 2008, 360-371. [21] Delbert, D. and Brendan, J.F. (2007) Non-metric affinity propagation for unsupervised image categorization. In- ternational Conference on Computer Vision, Rio de Ja- neiro, 14-20 October 2007, 1-8. [22] Nevena, L., Inmar, E.G., Parham, A. and Brendan, J.F. (2009) Facility location for subspace segmentation. 12th International Conference on Computer Vision, Kyoto, 29 September - 2 October, 2009, 825-832. [23] Veljko, V., Henry, L.N., Sanja, G., Nevena, V., Vladimir, P. and Claude, P.M. (2009) Identification of hemaggluti- nin structural domain and polymorphisms which may modulate swine H1N1 interactions with human receptor. BMC Structural Biology, 9, 62. doi:10.1186/1472-6807-9-62 [24] Veljkovic, V., Veljkovic, N., Muller, C.P., Müller, S., SGlisic, S., Perovic, V. and Köhler, H. (2009) Charac- terization of conserved properties of hemagglutinin of H5N1 and human influenza viruses: Possible conse- quences for therapy and infection control. BMC Struc- tural Biology, 7, 9-21. [25] Veljkovic, N., Glisic, S., Prljic, J., Perovic, V., Botta, M. and Veljkovic, V. (2008) Discovery of new therapeutic targets by the informational spectrum method. Current Protein Peptide Science, 9, 493-506. doi:10.2174/138920308785915245 [26] Cosic, I. (1997) The resonant recognition model of mac- romolecular bioreactivity: Theory and application. Birk- hauser Verlag, Berlin. [27] Veljkovic, V., Veljkovic, N., Este, J.A., Huther, A. and Dietrich, U. (2007) Application of the EIIP/ISM bioin- formatics concept in development of new drugs. Current Medicinal Chemistry, 14, 441-453. doi:10.2174/092986707779941014 [28] Cover, T.A. and Thomas, J.A. (1991) Elements of infor- mation theory. John Wiley and Sons, New York. doi:10.1002/0471200611 [29] David, M. (2003) Information theory, inference, and learning algorithms. Cambridge University Press, Cam- bridge. [30] Andrea, K., Gabriel, R.N., Ivan, K.H. and Sccarontefan, J. (2002) Sequence similarities and evolutionary relation- ships of influenza virus A hemagglutinins. Virus Genes, 24, 57-63. doi:10.1023/A:1014038120979 [31] Le, L., Lee, E.H., Hardy, D.J., Truong, T.N. and Schulten, K. (2010) Molecular dynamics simulations suggest that electrostatic funnel directs binding of Tamiflu to influ- enza N1 neuraminidases. PLoS Computational Biology, 6, e1000939. doi:10.1371/journal.pcbi.1000939 [32] Sung, J.C., Van Wynsberghe, A.W., Amaro, R.E., Li, W.W. and McCammon, J.A. (2010) Role of secondary sialic acid binding sites in influenza N1 neuraminidase. Journal of American Chemical Society, 132, 2883-2885. doi:10.1021/ja9073672 [33] Zhou, H., Yu, Z., Hu, Y., Tu, J., Zou, W., et al. (2009) The special neuraminidase stalk-motif responsible for increased virulence and pathogenesis of H5N1 influenza A virus. PLoS One, 4, 6277. doi:10.1371/journal.pone.0006277 [34] Matsuoka, Y., Swayne, D.E., Thomas, C., Rameix-Welti, M.A., Naffakh, N., et al. (2009) Neuraminidase stalk length and additional glycosylation of the hemagglutinin influence the virulence of influenza H5N1 viruses for mice. Journal of Virology, 83, 4704-4708. doi:10.1128/JVI.01987-08
|