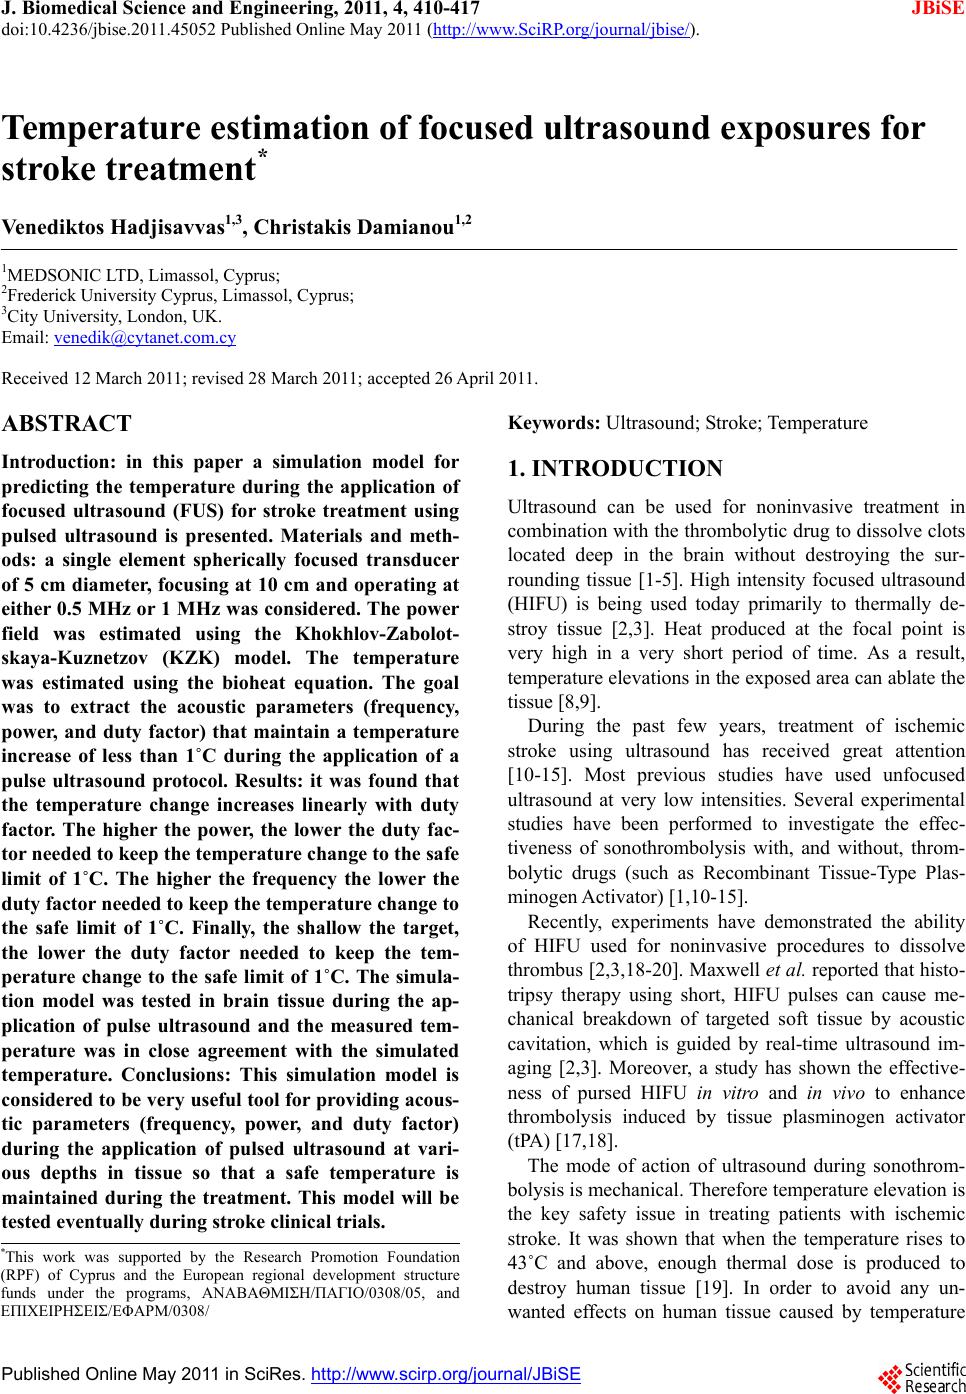
 J. Biomedical Science and Engineering, 2011, 4, 410-417 doi:10.4236/jbise.2011.45052 Published Online May 2011 (http://www.SciRP.org/journal/jbise/ JBiSE ). Published Online May 2011 in SciRes. http://www.scirp.org/journal/JBiSE Temperature estimation of focused ultrasound exposures for stroke treatment* Venediktos Hadjisavvas1,3, Christakis Damianou1,2 1MEDSONIC LTD, Limassol, Cyprus; 2Frederick University Cyprus, Limassol, Cyprus; 3City University, London, UK. Email: venedik@cytanet.com.cy Received 12 March 2011; revised 28 March 2011; accepted 26 April 2011. ABSTRACT Introduction: in this paper a simulation model for predicting the temperature during the application of focused ultrasound (FUS) for stroke treatment using pulsed ultrasound is presented. Materials and meth- ods: a single element spherically focused transducer of 5 cm diameter, focusing at 10 cm and operating at either 0.5 MHz or 1 MHz was considered. The power field was estimated using the Khokhlov-Zabolot- skaya-Kuznetzov (KZK) model. The temperature was estimated using the bioheat equation. The goal was to extract the acoustic parameters (frequency, power, and duty factor) that maintain a temperature increase of less than 1˚C during the application of a pulse ultrasound protocol. Results: it was found that the temperature change increases linearly with duty factor. The higher the power, the lower the duty fac- tor needed to keep the temperature change to the safe limit of 1˚C. The higher the frequency the lower the duty factor needed to keep the temperature change to the safe limit of 1˚C. Finally, the shallow the target, the lower the duty factor needed to keep the tem- perature change to the safe limit of 1˚C. The simula- tion model was tested in brain tissue during the ap- plication of pulse ultrasound and the measured tem- perature was in close agreement with the simulated temperature. Conclusions: This simulation model is considered to be very useful tool for providing acous- tic parameters (frequency, power, and duty factor) during the application of pulsed ultrasound at vari- ous depths in tissue so that a safe temperature is maintained during the treatment. This model will be tested eventually during stroke clinical trials. Keywords: Ultrasound; Stroke; Temperature 1. INTRODUCTION Ultrasound can be used for noninvasive treatment in combination with the thrombolytic drug to dissolve clots located deep in the brain without destroying the sur- rounding tissue [1-5]. High intensity focused ultrasound (HIFU) is being used today primarily to thermally de- stroy tissue [2,3]. Heat produced at the focal point is very high in a very short period of time. As a result, temperature elevations in the exposed area can ablate the tissue [8,9]. During the past few years, treatment of ischemic stroke using ultrasound has received great attention [10-15]. Most previous studies have used unfocused ultrasound at very low intensities. Several experimental studies have been performed to investigate the effec- tiveness of sonothrombolysis with, and without, throm- bolytic drugs (such as Recombinant Tissue-Type Plas- minogen Activator) [1,10-15]. Recently, experiments have demonstrated the ability of HIFU used for noninvasive procedures to dissolve thrombus [2,3,18-20]. Maxwell et al. reported that histo- tripsy therapy using short, HIFU pulses can cause me- chanical breakdown of targeted soft tissue by acoustic cavitation, which is guided by real-time ultrasound im- aging [2,3]. Moreover, a study has shown the effective- ness of pursed HIFU in vitro and in vivo to enhance thrombolysis induced by tissue plasminogen activator (tPA) [17,18]. The mode of action of ultrasound during sonothrom- bolysis is mechanical. Therefore temperature elevation is the key safety issue in treating patients with ischemic stroke. It was shown that when the temperature rises to 43˚C and above, enough thermal dose is produced to destroy human tissue [19]. In order to avoid any un- wanted effects on human tissue caused by temperature *This work was supported by the Research Promotion Foundation (RPF) of Cyprus and the European regional development structure funds under the programs, ΑΝΑΒΑΘΜΙΣΗ/ΠΑΓΙΟ/0308/05, and ΕΠΙΧΕΙΡΗΣΕΙΣ/ΕΦΑΡΜ/0308/ 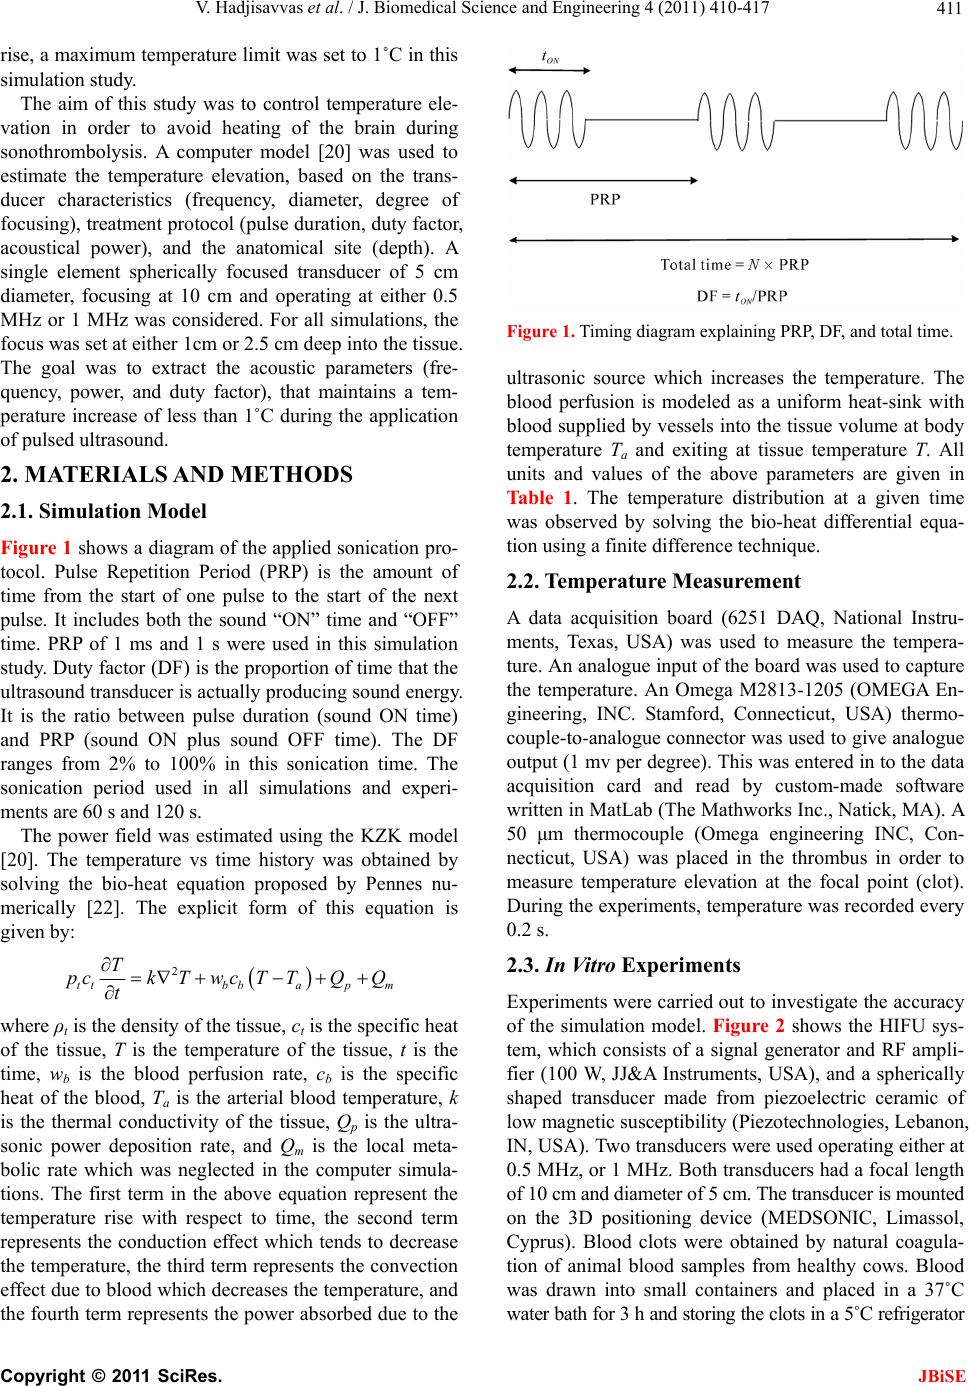 V. Hadjisavvas et al. / J. Biomedical Science and Engineering 4 (2011) 410-417 411 rise, a maximum temperature limit was set to 1˚C in this simulation study. The aim of this study was to control temperature ele- vation in order to avoid heating of the brain during sonothrombolysis. A computer model [20] was used to estimate the temperature elevation, based on the trans- ducer characteristics (frequency, diameter, degree of focusing), treatment protocol (pulse duration, duty factor, acoustical power), and the anatomical site (depth). A single element spherically focused transducer of 5 cm diameter, focusing at 10 cm and operating at either 0.5 MHz or 1 MHz was considered. For all simulations, the focus was set at either 1cm or 2.5 cm deep into the tissue. The goal was to extract the acoustic parameters (fre- quency, power, and duty factor), that maintains a tem- perature increase of less than 1˚C during the application of pulsed ultrasound. 2. MATERIALS AND METHODS 2.1. Simulation Model Figure 1 shows a diagram of the applied sonication pro- tocol. Pulse Repetition Period (PRP) is the amount of time from the start of one pulse to the start of the next pulse. It includes both the sound “ON” time and “OFF” time. PRP of 1 ms and 1 s were used in this simulation study. Duty factor (DF) is the proportion of time that the ultrasound transducer is actually producing sound energy. It is the ratio between pulse duration (sound ON time) and PRP (sound ON plus sound OFF time). The DF ranges from 2% to 100% in this sonication time. The sonication period used in all simulations and experi- ments are 60 s and 120 s. The power field was estimated using the KZK model [20]. The temperature vs time history was obtained by solving the bio-heat equation proposed by Pennes nu- merically [22]. The explicit form of this equation is given by: 2 ttbbap m T pckTwc TTQQ t where ρt is the density of the tissue, ct is the specific heat of the tissue, T is the temperature of the tissue, t is the time, wb is the blood perfusion rate, cb is the specific heat of the blood, Ta is the arterial blood temperature, k is the thermal conductivity of the tissue, Qp is the ultra- sonic power deposition rate, and Qm is the local meta- bolic rate which was neglected in the computer simula- tions. The first term in the above equation represent the temperature rise with respect to time, the second term represents the conduction effect which tends to decrease the temperature, the third term represents the convection effect due to blood which decreases the temperature, and the fourth term represents the power absorbed due to the Figure 1. Timing diagram explaining PRP, DF, and total time. ultrasonic source which increases the temperature. The blood perfusion is modeled as a uniform heat-sink with blood supplied by vessels into the tissue volume at body temperature Ta and exiting at tissue temperature T. All units and values of the above parameters are given in Table 1. The temperature distribution at a given time was observed by solving the bio-heat differential equa- tion using a finite difference technique. 2.2. Te mperatur e Measurement A data acquisition board (6251 DAQ, National Instru- ments, Texas, USA) was used to measure the tempera- ture. An analogue input of the board was used to capture the temperature. An Omega M2813-1205 (OMEGA En- gineering, INC. Stamford, Connecticut, USA) thermo- couple-to-analogue connector was used to give analogue output (1 mv per degree). This was entered in to the data acquisition card and read by custom-made software written in MatLab (The Mathworks Inc., Natick, MA). A 50 μm thermocouple (Omega engineering INC, Con- necticut, USA) was placed in the thrombus in order to measure temperature elevation at the focal point (clot). During the experiments, temperature was recorded every 0.2 s. 2.3. In Vitro Experiments Experiments were carried out to investigate the accuracy of the simulation model. Figure 2 shows the HIFU sys- tem, which consists of a signal generator and RF ampli- fier (100 W, JJ&A Instruments, USA), and a spherically shaped transducer made from piezoelectric ceramic of low magnetic susceptibility (Piezotechnologies, Lebanon, IN, USA). Two transducers were used operating either at 0.5 MHz, or 1 MHz. Both transducers had a focal length of 10 cm and diameter of 5 cm. The transducer is mounted on the 3D positioning device (MEDSONIC, Limassol, Cyprus). Blood clots were obtained by natural coagula- tion of animal blood samples from healthy cows. Blood was drawn into small containers and placed in a 37˚C water bath for 3 h and storing the clots in a 5˚C refrigerator C opyright © 2011 SciRes. JBiSE 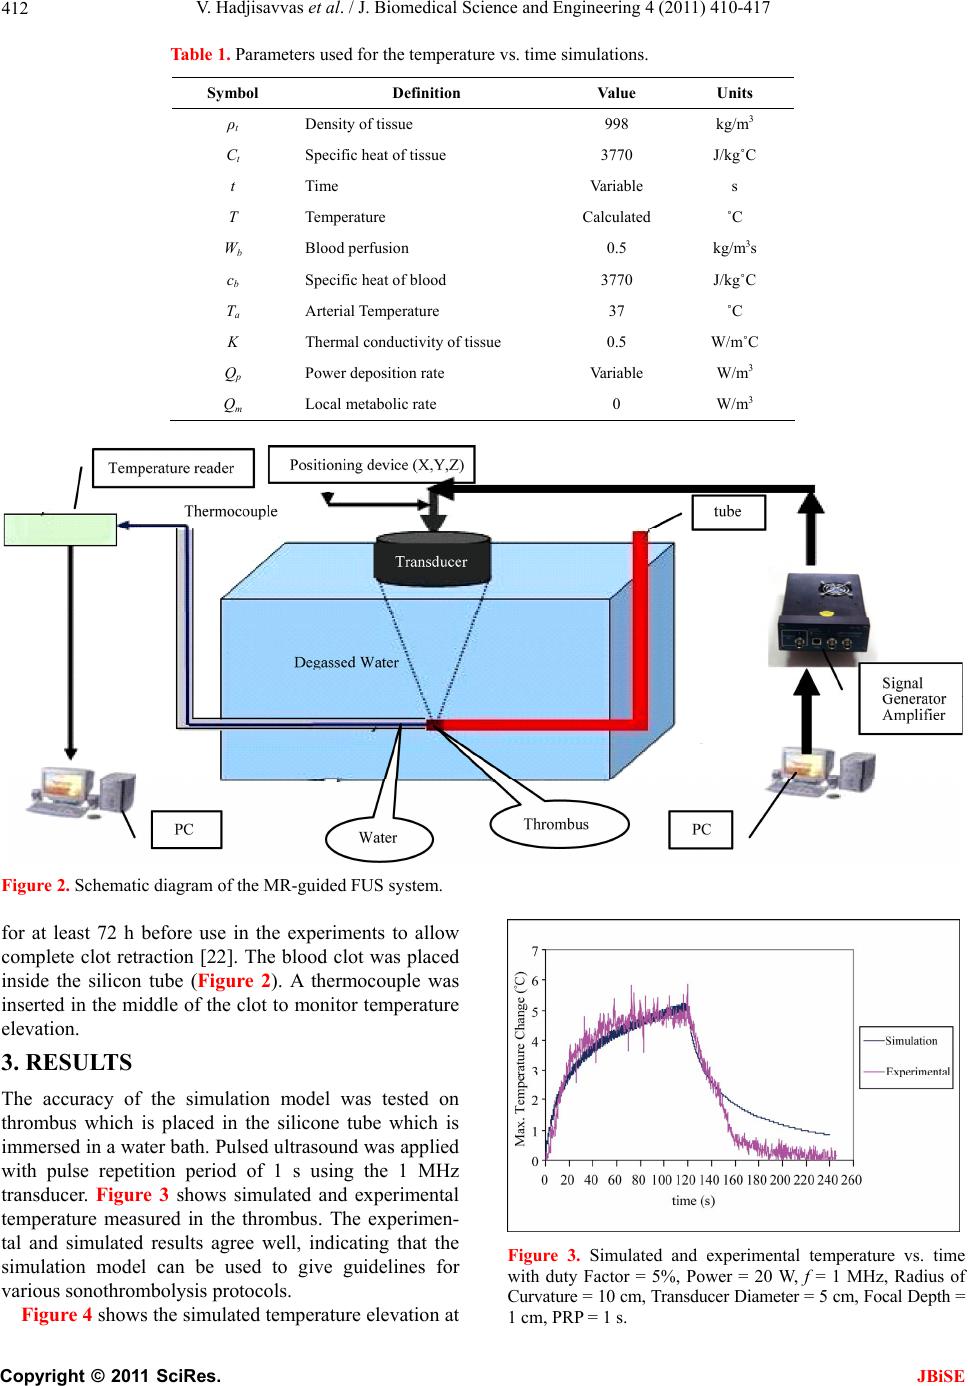 V. Hadjisavvas et al. / J. Biomedical Science and Engineering 4 (2011) 410-417 Copyright © 2011 SciRes. 412 Table 1. Parameters used for the temperature vs. time simulations. Symbol Definition Value Units ρt Density of tissue 998 kg/m3 Ct Specific heat of tissue 3770 J/kg˚C t Time Variable s T Temperature Calculated ˚C Wb Blood perfusion 0.5 kg/m3s cb Specific heat of blood 3770 J/kg˚C Ta Arterial Temperature 37 ˚C K Thermal conductivity of tissue 0.5 W/m˚C Qp Power deposition rate Variable W/m3 Qm Local metabolic rate 0 W/m3 Figure 2. Schematic diagram of the MR-guided FUS system. for at least 72 h before use in the experiments to allow complete clot retraction [22]. The blood clot was placed inside the silicon tube (Figure 2). A thermocouple was inserted in the middle of the clot to monitor temperature elevation. 3. RESULTS The accuracy of the simulation model was tested on thrombus which is placed in the silicone tube which is immersed in a water bath. Pulsed ultrasound was applied with pulse repetition period of 1 s using the 1 MHz transducer. Figure 3 shows simulated and experimental temperature measured in the thrombus. The experimen- tal and simulated results agree well, indicating that the simulation model can be used to give guidelines for various sonothrombolysis protocols. Figure 3. Simulated and experimental temperature vs. time with duty Factor = 5%, Power = 20 W, f = 1 MHz, Radius of Curvature = 10 cm, Transducer Diameter = 5 cm, Focal Depth = cm, PRP = 1 s. Figure 4 shows the simulated temperature elevation at 1 JBiSE 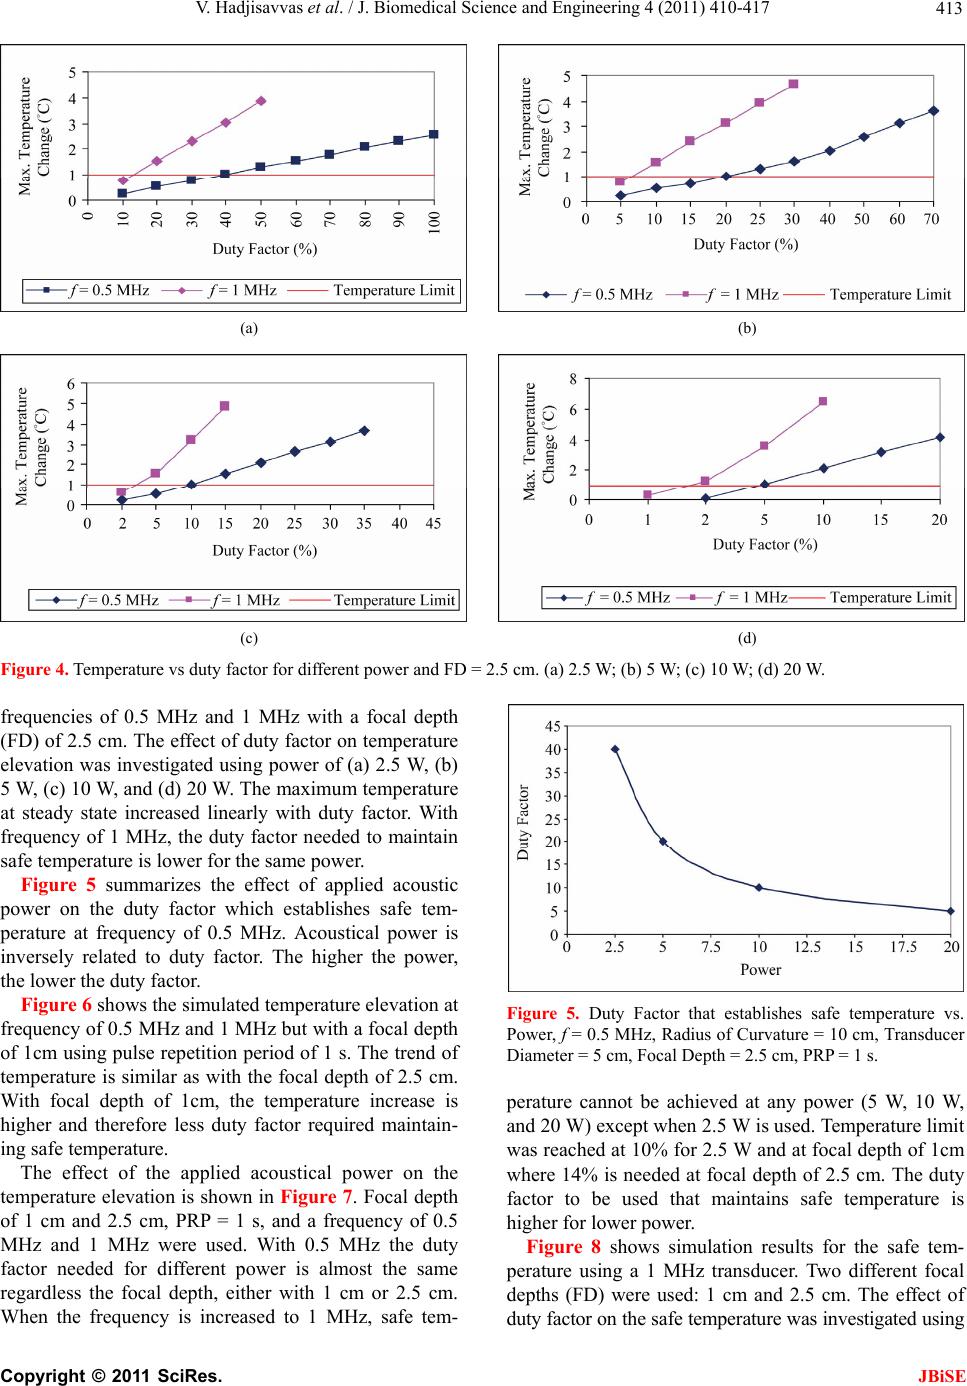 V. Hadjisavvas et al. / J. Biomedical Science and Engineering 4 (2011) 410-417 413 (a) (b) (c) (d) Figure 4. Temperature vs duty factor for different power and FD = 2.5 cm. (a) 2.5 W; (b) 5 W; (c) 10 W; (d) 20 W. frequencies of 0.5 MHz and 1 MHz with a focal depth (FD) of 2.5 cm. The effect of duty factor on temperature elevation was investigated using power of (a) 2.5 W, (b) 5 W, (c) 10 W, and (d) 20 W. The maximum temperature at steady state increased linearly with duty factor. With frequency of 1 MHz, the duty factor needed to maintain safe temperature is lower for the same power. Figure 5 summarizes the effect of applied acoustic power on the duty factor which establishes safe tem- perature at frequency of 0.5 MHz. Acoustical power is inversely related to duty factor. The higher the power, the lower the duty factor. Figure 6 shows the simulated temperature elevation at frequency of 0.5 MHz and 1 MHz but with a focal depth of 1cm using pulse repetition period of 1 s. The trend of temperature is similar as with the focal depth of 2.5 cm. With focal depth of 1cm, the temperature increase is higher and therefore less duty factor required maintain- ing safe temperature. The effect of the applied acoustical power on the temperature elevation is shown in Figure 7. Focal depth of 1 cm and 2.5 cm, PRP = 1 s, and a frequency of 0.5 MHz and 1 MHz were used. With 0.5 MHz the duty factor needed for different power is almost the same regardless the focal depth, either with 1 cm or 2.5 cm. When the frequency is increased to 1 MHz, safe tem- Figure 5. Duty Factor that establishes safe temperature vs. Power, f = 0.5 MHz, Radius of Curvature = 10 cm, Transducer Diameter = 5 cm, Focal Depth = 2.5 cm, PRP = 1 s. perature cannot be achieved at any power (5 W, 10 W, and 20 W) except when 2.5 W is used. Temperature limit was reached at 10% for 2.5 W and at focal depth of 1cm where 14% is needed at focal depth of 2.5 cm. The duty factor to be used that maintains safe temperature is higher for lower power. Figure 8 shows simulation results for the safe tem- perature using a 1 MHz transducer. Two different focal depths (FD) were used: 1 cm and 2.5 cm. The effect of duty factor on the safe temperature was investigated using C opyright © 2011 SciRes. JBiSE 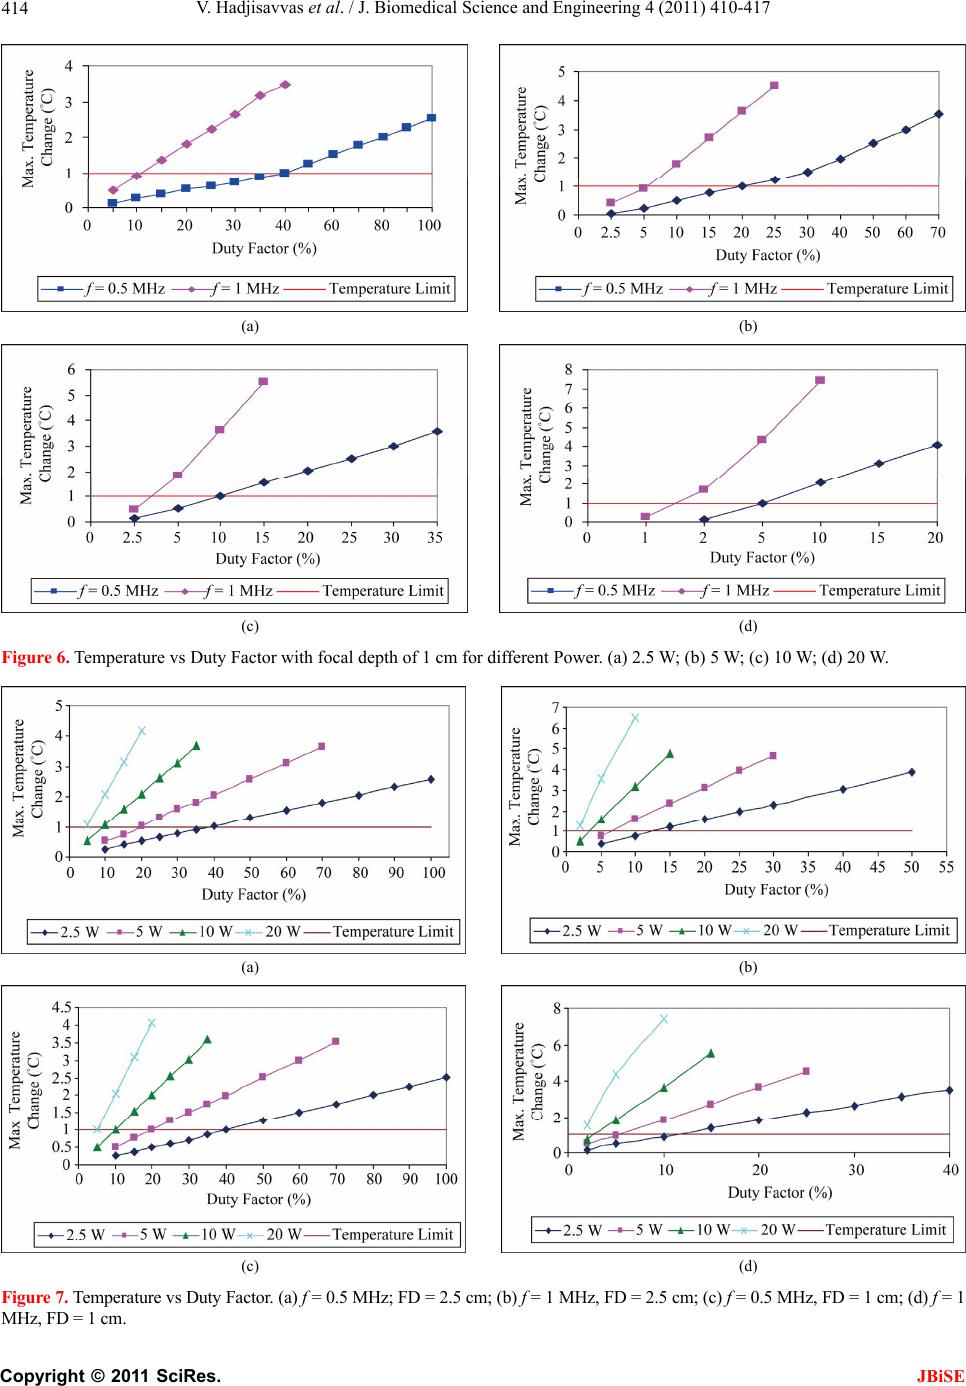 V. Hadjisavvas et al. / J. Biomedical Science and Engineering 4 (2011) 410-417 414 (a) (b) (c) (d) Figure 6. Temperature vs Duty Factor with focal depth of 1 cm for different Power. (a) 2.5 W; (b) 5 W; (c) 10 W; (d) 20 W. (a) (b) (c) (d) Figure 7. Temperature vs Duty Factor. (a) f = 0.5 MHz; FD = 2.5 cm; (b) f = 1 MHz, FD = 2.5 cm; (c) f = 0.5 MHz, FD = 1 cm; (d) f = 1 MHz, FD = 1 cm. C opyright © 2011 SciRes. JBiSE 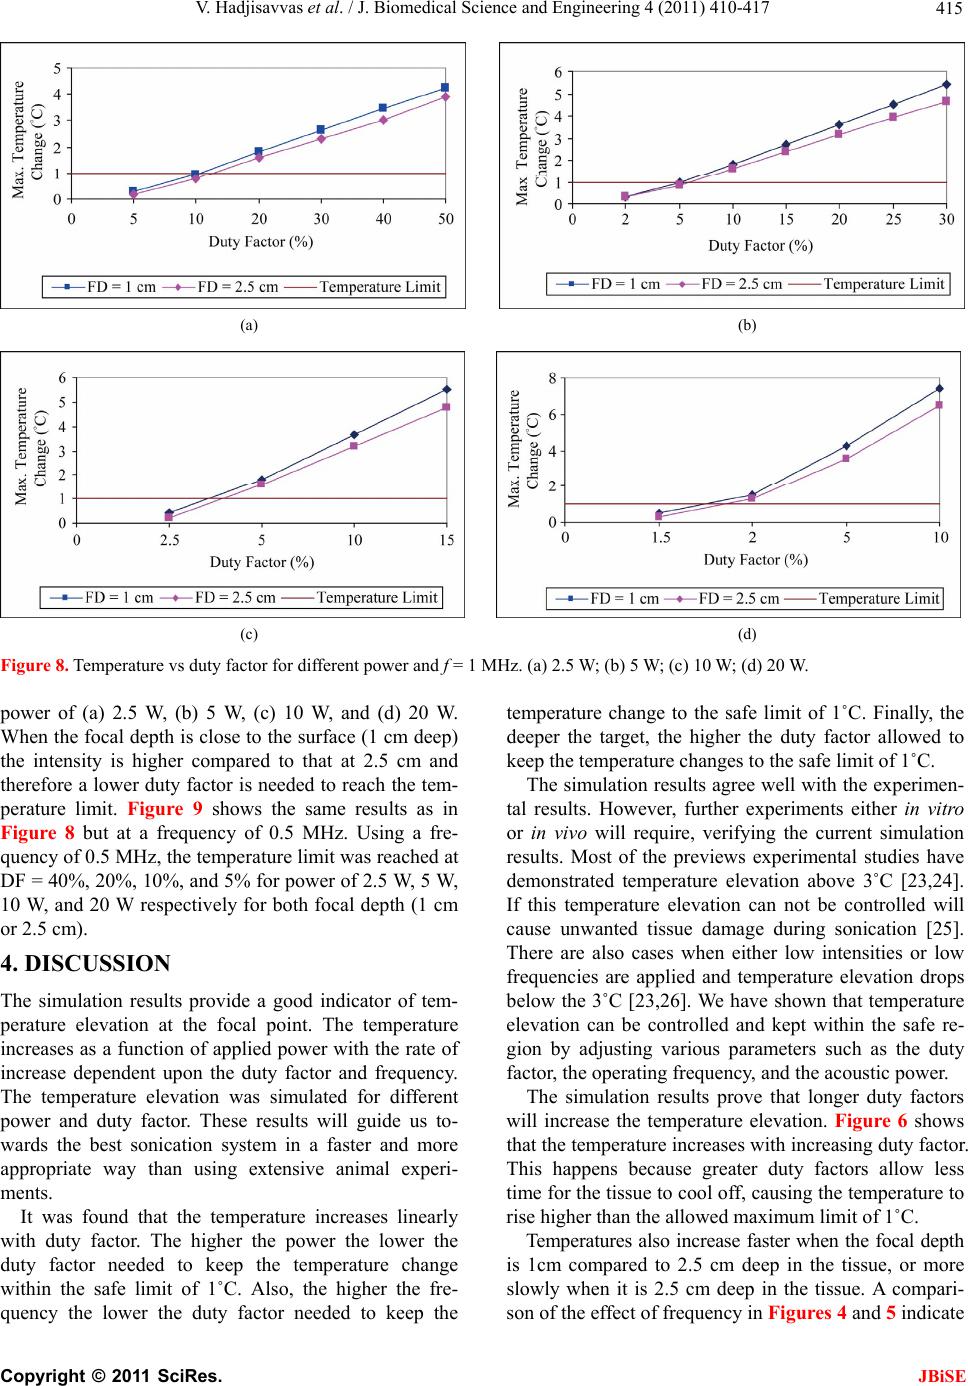 V. Hadjisavvas et al. / J. Biomedical Science and Engineering 4 (2011) 410-417 415 (a) (b) (c) (d) Figure 8. Temperature vs duty fa0 W. ower of (a) 2.5 W, (b) 5 W, (c) 10 W, and (d) 20 W. SSION provide a good indicator of tem- s found that the temperature increases linearly wi temperature change to the safe limit of 1˚C. Finally, the ro or th ore sl ctor for different power and f = 1 MHz. (a) 2.5 W; (b) 5 W; (c) 10 W; (d) 2 p When the focal depth is close to the surface (1 cm deep) the intensity is higher compared to that at 2.5 cm and therefore a lower duty factor is needed to reach the tem- perature limit. Figure 9 shows the same results as in Figure 8 but at a frequency of 0.5 MHz. Using a fre- quency of 0.5 MHz, the temperature limit was reached at DF = 40%, 20%, 10%, and 5% for power of 2.5 W, 5 W, 10 W, and 20 W respectively for both focal depth (1 cm or 2.5 cm). 4. DISCU The simulation results perature elevation at the focal point. The temperature increases as a function of applied power with the rate of increase dependent upon the duty factor and frequency. The temperature elevation was simulated for different power and duty factor. These results will guide us to- wards the best sonication system in a faster and more appropriate way than using extensive animal experi- ments. It wa th duty factor. The higher the power the lower the duty factor needed to keep the temperature change within the safe limit of 1˚C. Also, the higher the fre- quency the lower the duty factor needed to keep the deeper the target, the higher the duty factor allowed to keep the temperature changes to the safe limit of 1˚C. The simulation results agree well with the experimen- tal results. However, further experiments either in vit in vivo will require, verifying the current simulation results. Most of the previews experimental studies have demonstrated temperature elevation above 3˚C [23,24]. If this temperature elevation can not be controlled will cause unwanted tissue damage during sonication [25]. There are also cases when either low intensities or low frequencies are applied and temperature elevation drops below the 3˚C [23,26]. We have shown that temperature elevation can be controlled and kept within the safe re- gion by adjusting various parameters such as the duty factor, the operating frequency, and the acoustic power. The simulation results prove that longer duty factors will increase the temperature elevation. Figure 6 shows at the temperature increases with increasing duty factor. This happens because greater duty factors allow less time for the tissue to cool off, causing the temperature to rise higher than the allowed maximum limit of 1˚C. Temperatures also increase faster when the focal depth is 1cm compared to 2.5 cm deep in the tissue, or m owly when it is 2.5 cm deep in the tissue. A compari- son of the effect of frequency in Figures 4 and 5 indicate C opyright © 2011 SciRes. JBiSE 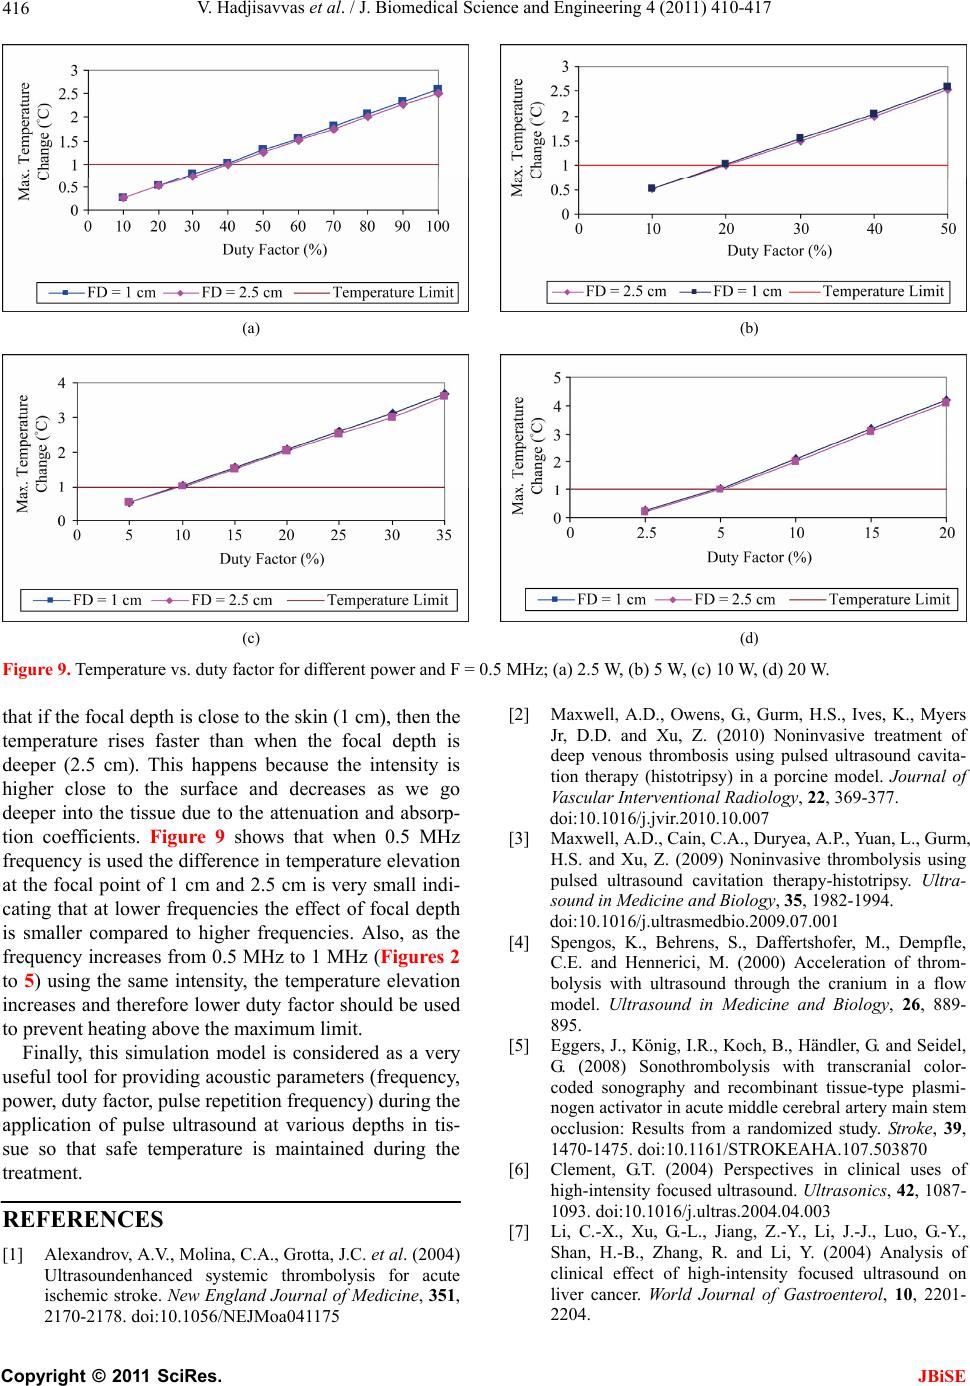 V. Hadjisavvas et al. / J. Biomedical Science and Engineering 4 (2011) 410-417 416 (a) (b) (c) (d) Figure 9. Temperature vs. duty f) 20 W. at if the focal depth is close to the skin (1 cm), then the NCES Molina, C.A., Grotta, J.C. et al. (2004) s, K., Myers Ultra- a flow actor for different power and F = 0.5 MHz; (a) 2.5 W, (b) 5 W, (c) 10 W, (d [2] Maxwell, A.D., Owens, G., Gurm, H.S., Ive th temperature rises faster than when the focal depth is deeper (2.5 cm). This happens because the intensity is higher close to the surface and decreases as we go deeper into the tissue due to the attenuation and absorp- tion coefficients. Figure 9 shows that when 0.5 MHz frequency is used the difference in temperature elevation at the focal point of 1 cm and 2.5 cm is very small indi- cating that at lower frequencies the effect of focal depth is smaller compared to higher frequencies. Also, as the frequency increases from 0.5 MHz to 1 MHz (Figures 2 to 5) using the same intensity, the temperature elevation increases and therefore lower duty factor should be used to prevent heating above the maximum limit. Finally, this simulation model is considered as a very useful tool for providing acoustic parameters (frequency, power, duty factor, pulse repetition frequency) during the application of pulse ultrasound at various depths in tis- sue so that safe temperature is maintained during the treatment. REFERE [1] Alexandrov, A.V., [7] Ultrasoundenhanced systemic thrombolysis for acute ischemic stroke. New England Journal of Medicine, 351, 2170-2178. doi:10.1056/NEJMoa041175 Jr, D.D. and Xu, Z. (2010) Noninvasive treatment of deep venous thrombosis using pulsed ultrasound cavita- tion therapy (histotripsy) in a porcine model. Journal of Vascular Interventional Radiology, 22, 369-377. doi:10.1016/j.jvir.2010.10.007 [3] Maxwell, A.D., Cain, C.A., Duryea, A.P., Yuan, L., Gurm, H.S. and Xu, Z. (2009) Noninvasive thrombolysis using erapy-histotripsy. pulsed ultrasound cavitation th sound in Medicine and Biology, 35, 1982-1994. doi:10.1016/j.ultrasmedbio.2009.07.001 [4] Spengos, K., Behrens, S., Daffertshofer, M., Dempfle, C.E. and Hennerici, M. (2000) Acceleration of throm- nium inbolysis with ultrasound through the cra model. Ultrasound in Medicine and Biology, 26, 889- 895. [5] Eggers, J., König, I.R., Koch, B., Händler, G. and Seidel, G. (2008) Sonothrombolysis with transcranial color- coded sonography and recombinant tissue-type plasmi- nogen activator in acute middle cerebral artery main stem occlusion: Results from a randomized study. Stroke, 39, 1470-1475. doi:10.1161/STROKEAHA.107.503870 [6] Clement, G .T. (2004) Perspectives in clinical uses of high-intensity focused ultrasound. Ultrasonics, 42, 1087- 1093. doi:10.1016/j.ultras.2004.04.003 Li, C.-X., Xu, G.-L., Jiang, Z.-Y., Li, J.-J., Luo, G.-Y., Shan, H.-B., Zhang, R. and Li, Y. (2004) Analysis of clinical effect of high-intensity focused ultrasound on liver cancer. World Journal of Gastroenterol, 10, 2201- 2204. C opyright © 2011 SciRes. JBiSE  V. Hadjisavvas et al. / J. Biomedical Science and Engineering 4 (2011) 410-417 417 nd monitored by MRI. IEEE Transactions on Ul- Furuhata, H. 07-0163-x 09) Enhanced -1792. lysis for stologic evalua- e middle cerebral artery main stem oc- eng, C., . 3rd and Li, K.C. n in cancer therapy. International Journal of Ra- n repre- ultrasound beams. in the resting human forearm. Journal of denhanced tissue plas- nd acceler- chel, N., Kempski, O., nd Schenck, J. sound surgery. oue, H., Abe, T. and Fu- n transcranial ultrasonication in- [8] Damianou, C., Ioannides, K., Hadjisavvas, V., Milonas, N., Couppis, A. and Iosif, D. (2009) In vitro and in vivo brain ablation created by high intensity focused ultra- sound a trasonics, Ferroelectrics and Frequency Control, 56, 1189-1198. doi:10.1109/TUFFC.2009.1160 [9] Kennedy, J.E. (2005) High-intensity focused ultrasound in treatment of solid tumors. Nature Reviews Cancer, 5, 321-327. doi:10.1038/nrc1591 [10] Zenitani, T., Suzuki, R., Maruyama, K. and (2008) Accelerating effects of ultrasonic thrombolysis with bubble liposomes. Journal of Medical Ultrasonics, 35, 5-10. doi:10.1007/s10396-0 [11] Soltani, A., Prokop, A. and Vaezy, S. (2008) Stability of alteplase in presence of cavitation. Ultrasonics, 48, 109-116. doi:10.1016/j.ultras.2007.10.003 [12] Eggers, J., Ossadnik, S. and Seidel, G. (20 clot dissolution in vitro by 1.8-mhz pulsed ultrasound. Ultrasound in Medicine and Biology, 35, 523-526. doi:10.1016/j.ultrasmedbio.2008.09.009 [13] Shaw, G., Meunier, J., Lindsell, C. and Holland, C. (2008) Tissue plasminogen activator concentration dependence of 120 khz ultrasound-enhanced thrombolysis. Ultra- sound in Medicine and Biology, 34, 1783 doi:10.1016/j.ultrasmedbio.2008.03.020 [14] Saguchi, T., Onoue, H., Urashima, M., Ishibashi, T., Abe, T. and Furuhata, H. (2008) Effective and safe conditions of low-frequency transcranial ultrasonic thrombo acute ischemic stroke: Neurologic and hi tion in a rat middle cerebral artery stroke model. Stoke, 39, 1007-1011. [15] Eggers, J., König, I.R., Koch, B., Händler, G. and Seidel, G. (2008) Sonothrombolysis with transcranial color-coded sonography and recombinant tissue-type plasminogen activator in acut clusion: Results from a randomized study. Stroke, 39, 1470-1475. doi:10.1161/STROKEAHA.107.503870 [16] Kim, Y.S., Rhim, H., Choi, M.J., Lim, H.K. and Choi, D. (2008) High-intensity focused ultrasound therapy: An overview for radiologists. Korean Journal of Radiology, 9, 291-302. [17] Stone, M.J., Frenkel, V., Dromi, S., Thomas, P., Lewis, R.P., Li, K.C., Horne, M. 3rd and Wood, B.J. (2007) Pulsed-high intensity focused ultrasound enhanced tPA mediated thrombolysis in a novel in vivo clot model, a pilot study. Thrombosis Research, 121, 193-202. doi:10.1016/j.thromres.2007.03.023 [18] Frenkel, V., Oberoi, J., Stone, M.J., Park, M., D Wood, B.J., Neeman, Z., Horne, M (2006) Pulsed high-intensity focused ultrasound en- hances thrombolysis in an in vitro model. Radiology, 239, 86-93. [19] Sapareto, S. and Dewey, W. (1984) Thermal dose deter- minatio diation Oncology Biology Physics, 10, 787-800. doi:10.1016/0360-3016(84)90379-1 [20] Soneson, J.E. and Myers, M.R. (2007) Gaussia sentation of high-intensity focused Journal of the Acoustical Society of America, 122, 2526-2531. [21] Pennes, M. (1948) Analysis of tissue and arterial blood temperature Applied Physiology, 1, 93-122. [22] Holland, C.K., Vaidya, S.S., Datta, S., Coussios, C.-C. and Shaw, G.J. (2007) Ultrasoun minogen activator thrombolysis in an in vitro porcine clot model. Thrombosis Research, 121, 663-673. [23] Kornowski, R., Meltzer, R.S., Chernine, A., Vered, Z. and Battler, A. (1994) Does external ultrasou ate thrombolysis? Results from a rabbit model. American Heart Association, 89, 339-344. [24] Nedelmann, M., Reuter, P., Walberer, M., Sommer, C., Alessandri, B., Schiel, D., Rits Kaps, M., Mueller, C., Bachmann, G. and Gerriets, T. (2008) Detrimental effects of 60 Khz Sonothrombolysis in rats with middle cerebral artery occlusion. Ultrasound in Medicine and Biology, 34, 2019-2027. doi:10.1016/j.ultrasmedbio.2008.06.003 [25] Hynynen, K., Darkazanli, A., Unger, E. a (1993) MRI-guided non-invasive ultra Medical Physics, 20, 107-115. doi:10.1118/1.597093 [26] Ishibashi, T., Akiyama, M., On ruhata, H. (2002) Ca crease recanalization flow with tissue plasminogen acti- vator? Stroke, 33, 1399-1404. doi:10.1161/01.STR.0000013789.15436.42 C opyright © 2011 SciRes. JBiSE
|