 Journal of Geoscience and Environment Protection, 2014, 2, 1-8 Published Online July 2014 in SciRes. http://www.scirp.org/journal/gep http://dx.doi.org/10.4236/gep.2014.24001 How to cite this paper: Hern, T. K., Hin, L. S., Ibrahim, S., Sulaiman, N. M. N., Sharifi, M., & Abe, S. (2014). Impact of Fine Sediment on TSS and Turbidity in Retention Structure. Journal of Geoscience and Environment Protection, 2, 1-8. http://dx.doi.org/10.4236/gep.2014.24001 Impact of Fine Sediment on TSS and Turbidity in Retention Structure Tan Kah Hern1, Lai Sai Hin1, Shaliza Ibrahim1, Nik Meriam Nik Sulaiman2, Mona Sharifi1, Sandra Abe1 1Department of Civil Engineering, Faculty of Engineering, University of Malaya , Kuala Lumpur, Malaysia 2Department Chemical Engineering , Faculty of Engineering, University of Malaya, Kuala Lumpur, Malaysia Email: laish@um.edu. my Received April 2014 Abstract A study of the impact of fine sediment on vari ou s water quality parameters in retenti on structure such as sediment basin was conducted on stagnant and flowing con di ti on. 7 water quality par a- meters (pH, TSS, turb id i ty, DO, BOD, COD, ammonium nitro gen) w e re measured and classi fi ed ac- cording to the Inte ri m Natio nal Wa ter Qu ality S tandard (INWQS) for Malaysia. Res ults s how hi gher fine sediment concentration causes higher TSS and turbidity. Besides, results show TSS and tur- bidity were influe nced by soil type for the same amount of fine sediment. Soil Sir i Rasau 1 showed highest TSS and turbidity value followed by soi l Si ri Bungor and soil alluviu m. A good positive correlation of TSS versus turbidity and has been investigated in this study. Multip le nonlinear re- gressio n analys is r eve aled th at parameter TSS is dependent on time , total soil m ass , fine soil mass and flow rate. Keywords Fine Se dimen t, TSS , Turbi di ty, Wate r Quality 1. Introduction Nowadays, Malaysia faces many challenges in contro lling th e quantity and quality of stormwater runo f f. Stormwater runof f is the major contributor to river pollution (Nazahiyah et al., 2007). One way of controlling increased runoff due to urbanization and social-econo mic development is to build stormwater management fa- cilities, s uch as retention/detention pond s . A retention basin is a p art of drainage system to control water flow and trap tho s e con taminated solid particles along with the water flow (Lee et al., 1997). The primary removal mechanism of the retention ponds gravitational settling of those contaminated solid par- ticle especially those with nutrients will affect the biological activity in the pond. Previous study showed that freshwater wetland interaction with sediment affect surface water quality (Johnston, 1991). Most of th e r eten- tions ponds are suffered from water pollution problems such as siltation, sed imentati on, accumulation of toxic material, algae bloom and so o n. Su ch a condition can also cause a number of social, health and environmental problems, such as odour smell, d isease, poor aesthe tic value in the surrounding area. 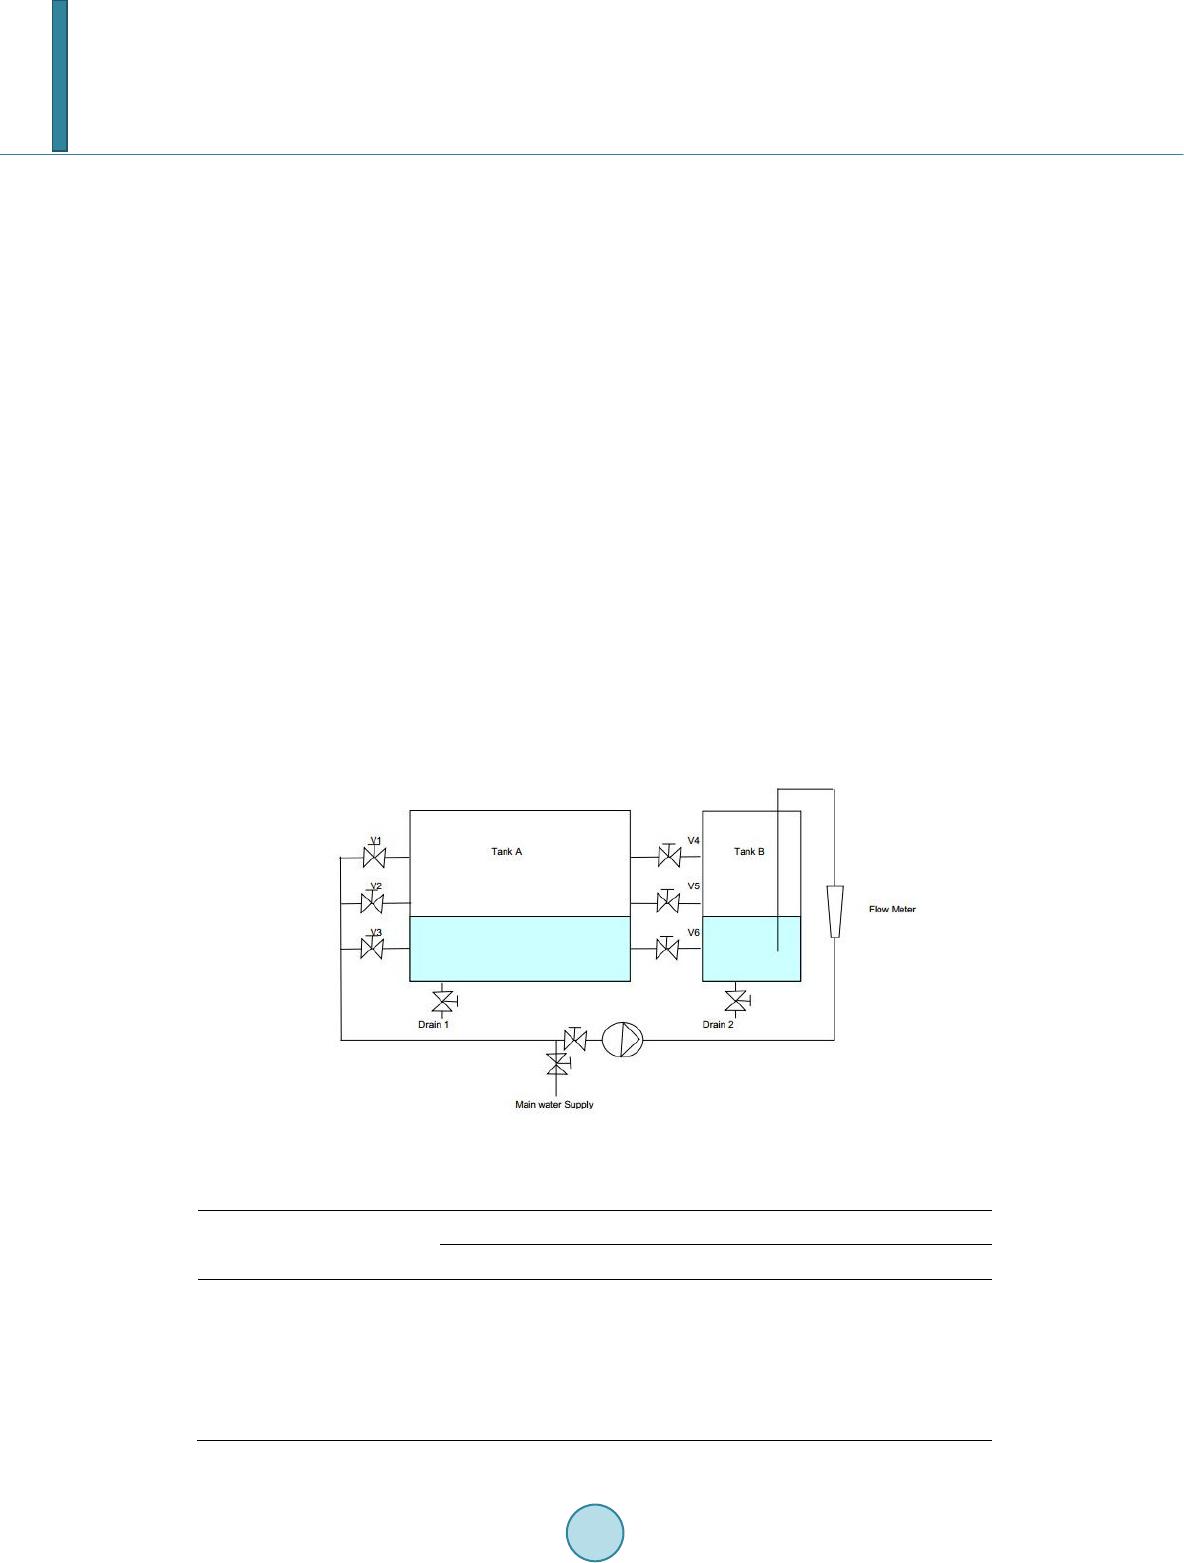 T. K. Hern et al. Nevertheless, it is hard to monitor all water quality parameters regularly even if adequate manpower and laboratory facilities are provided. Therefore an alternative approach based on statistical correlation and analysis has been used to study the relationship of the water parameters (Bhandari et al., 2008; Shrestha et al., 2007). In this s tud y the parameters pH, TSS, turbidity, DO, BOD , COD and ammonium nitrogen of different con- centration of fine sediment were measured. The effect of soil typ e on TSS and turbidity has been investigated and the correlation of TSS and turbidity has been studied. Multiple nonlinear regression analysis has been ap- plied. 2. Experimental Considerations The samples of 4 different types of commonly found soil series were collected for this experimental investiga- tion. The characteristics of soil samples are shown in Table 1. A special design experiment tank was designed to investigate the impact of fine sediment on water quality in retention structure. The sediment basin consisting two glass tanks named Tank A and Tank B with dimension of 120 cm × 90 cm × 75 cm and 75 cm × 90 cm × 75 cm respectively, water pump, valves and flow meter as shown in Figure 1. For stagnant condition, different weight of soil (0.5 kg, 1 kg and 1.5 kg) were mixed with 50 cm height of clean water in Tank A. Parameters pH, dissolved oxygen (DO) were measured in-situ by Water Quality Model whereas TSS was measured by TSS meter and turbidity measured by spectrometer for different time interval (initial time, 15 minutes, 30 minutes, 1 hour, 3 hours, 6 hours, 1 day, 2 days and 7 days). Standard procedures were used for water collection and water sample analysis for parameter BOD, COD and ammonium nitrogen (APHA, 1995). For moving condition, 1 kg of soil was well mixed with 70 cm height of clean water in tank A and allowed to circulate into tank B with different flow rate (2 LPM, 7.5 LPM and 13 LPM) until equilibrium of height of both tanks were achieved. Figure 1. Schematic diagram of the laboratory model. Table 1. Soil type description. Soil properties Soil samples Sample 1 Sample 2 Sample 3 Sample 4 Sand% Silt% Clay% Texture Bulk density g/cm3 USDA SOIL TAXONOMY 1992 80 8 12 Loamy sand 1.348 Aluvium 63 19 18 Sandy clay loam 1.274 Siri Bungau 35 11 54 Clay 1.222 Siri Rasau 1 35 31 44 Clay 1.214 Siri Rasau 2  T. K. Hern et al. Different weight of fine sediments (0.5 g, 1 g, 2 g, 3 g, 4 g, 5 g, 6 g, 8 g, 10 g and 12 g) of different soil type (Sample 1, 2 and 3) were mixed with 2 litre of distilled water and parameters TSS and turbidity were measured. Statistical analysis of data was investigated using SPSS version 2 0. Karl-Pearson correlation coeffi cient was calculated. Multiple nonlinear regression analysis is used to analyse the correlation of TSS to time, to tal so il mass, fine soil mass and flow rate. Several models of different combination of parameters have been tested to study the best model for analysis. P ow er function (Equations (1) and (2)) is used to analyze the correlation and relationship between TSS and other parameters. General equation used is as shown in Equation (1). ( ) 1 b 0 YbXfor function of X = (1) where b0, b1 are constant. For multiple variables of function, the general equation is shown in Equation (2). ( )() () ( ) 3 12 n b bb b 01 2 3n YbX XXX = … (2) where b0, b1, b2, b3 and bn are constant. 3. Results and Discussion From the result obtained, concentr a tion of fine sediment in water is found greatly influence the TSS and turbid- ity. However, the impact of fine sediments on pH, DO, BOD, COD and ammonium nitrogen is not obvious. The condition and the amount of fine sediments in each type of testing samples are shown in Table 2. pH of the aq- uatic systems is a crucial indicator of the water quality and pollution (Jonnalagadda et al., 2001). The pH value range for samples are 6.89 - 7.4 for TW, 6.77 - 7.40 for S1, 6.74 - 7.11 for S2, 6.50 - 6.88 for S3, 6 .55 - 7.40 for F1, 6.56 - 7.12 for F2 and 6.81 to 6.97 for F3. The var iations of pH values of all samples throughout the experimental works (in 7 days) are within 6.5 - 8.5. pH value is determined by the amount of dissolved carbon dioxide. It forms carbonic acid when dissolves in water (Sawyer et al., 2007). The pH value of all samples was observed to have minute change within 7 days (Table 3). It is observed th at all samples containing fine sediment have slightly lower pH value range compared to tap water, TW. Table 2. Experimental and sample description. Sample name Description Flow rate (LPM) Total amount of sediment TS, (g) Amount of fine sediment in TS (g) TW S1 S2 S3 F1 F2 F3 0 0 0 0 2 7.5 13 0 500 1000 1500 1000 1000 1000 0 47 87 174 100 133 181 Table 3. pH range of samples. Sample name Descriptions Soil series pH TW S1 S2 S3 F1 F2 F3 Nil Siri Rasau 2 Siri Rasau 2 Siri Rasau 2 Siri Rasau 2 Siri Rasau 2 Siri Rasau 2 6.89 - 7.40 6.77 - 7.40 6.74 - 7.11 6.50 - 6.88 6.55 - 7.40 6.56 - 7.12 6.81 - 6.97 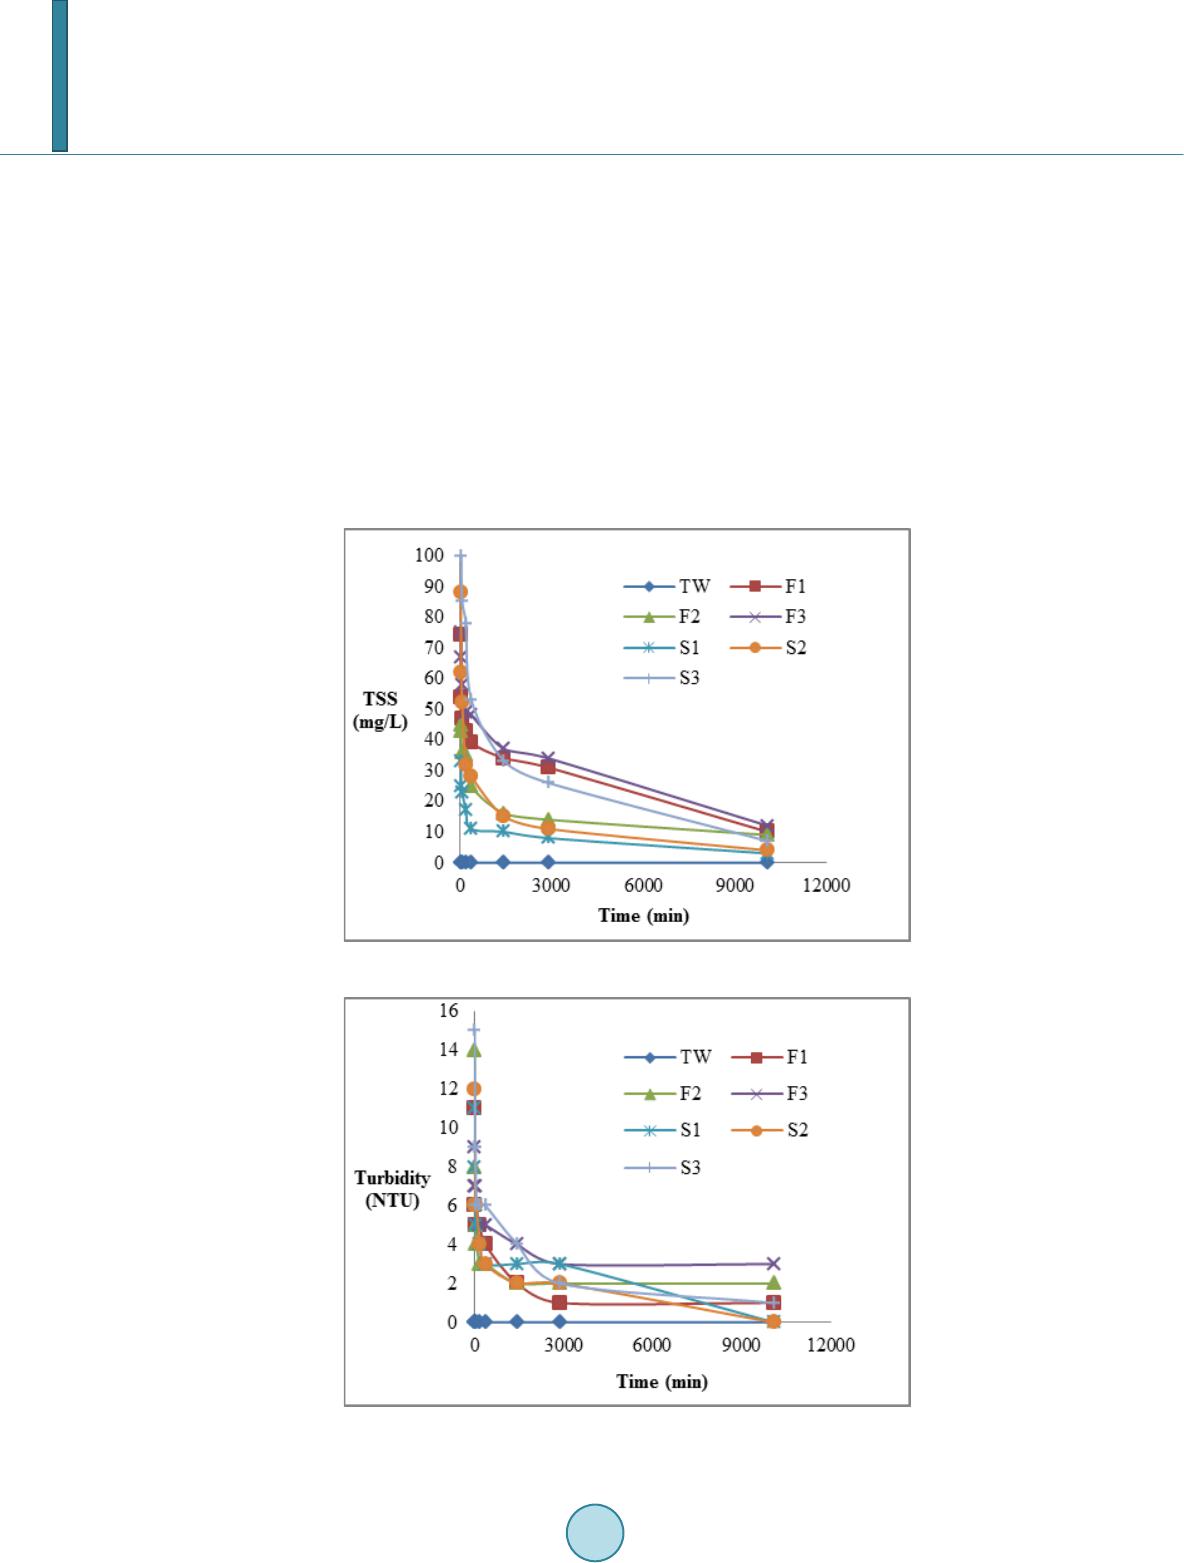 T. K. Hern et al. TSS indicates the concentration of suspended particles in a liquid effluent (Queenan et al., 1978). Land ero- sion is one of the contributors of suspended sediments and siltation (Eisakhani et al., 2009). Figure 2 revealed that the higher the Soil sample content, the higher the TSS value at initial concentration. Samples S3 has the highest initial TSS value that is 180 mg/L followed by S2 with 11 8mg/L and S1 with 55 mg/L. The higher the soil content, the higher the turbidity value. For flowing water, F3 has higher TSS compared to F2 and F1. All samples had great reduction of TSS value within 60 minutes and the T SS values had reduced to almost h alf of their initial concentration due to settling of the large particles in sample wh ich is more than 63 µm. Particles in stagnant water are settling faster than moving water when the time increased. At the day 7, a ll samples had low TSS value rang e from 3 to 12 mg/L. Suspended solid is one of natural pollutant which contains organic matter and transported by urban s torm runoff (Gandaseca et al., 2011). Suspended particles like silt, clay, organic matter and so on decrease clarity of water and result the turbidity. The murkier water means the higher amount of sediment (Yisa et al., 2010). Generally, siltation increases the turbidity of the water and deterio r ates water q ua lity significan tly (Astel et al., 2006). Turbid ity of all the samples is obser ved to have the similar trend with the TSS over time (Figure 3). For stagnant water, sample S3 is shown Figure 2. Total suspended solid (TSS) over time. Figure 3. Turbidity over time. 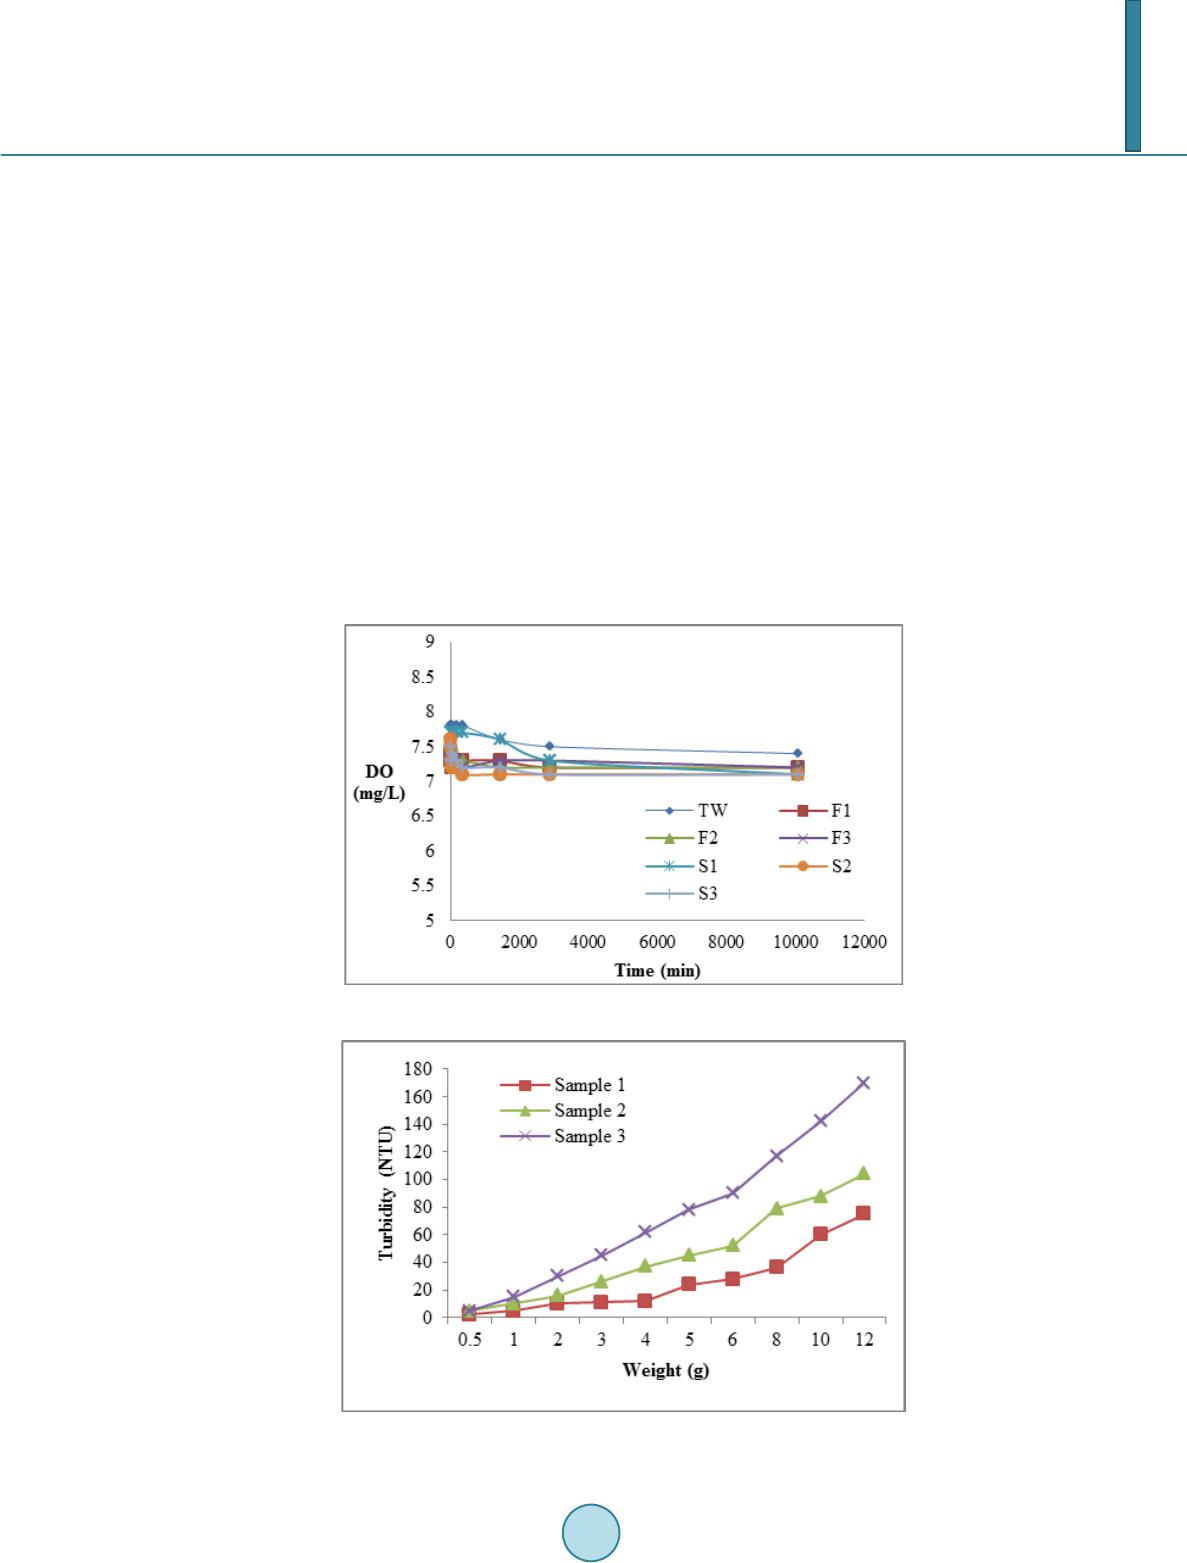 T. K. Hern et al. to have the highest initial turbidity of 15 NTU followed by S2 with 12 N TU, S1 with 11 NTU. For flowing wa- ter, F3 has higher turbidity compared to F2 and F1. Initial turbidity is higher when the flow rate is higher. For the first hour, all the samples had reduction of turbidity for about 50% compared to initial turbidity. At day 7, all samples had low value of turbidity range 0 - 3 NTU. Oxygen from the atmosphere and photosynthesis by the aquatic plants becomes dissolved in surface water and it is consumed by the decay of organic particles in water (Astel et al., 2006). The concentration of DO over time is shown in Figure 4. The initial DO concentration for samples are 7.8 mg/L for tap water, 7.7 for S1, 7.6 fo r S2, 7.5 for S3 and 7.4 for F1, F2 and F3. It is observed that tap water has the highest value of DO concentration. All the samples had the slightly lower value of DO concentration compared to tap water. Nonetheless, fine sediment does not cause the water to have low DO concentra tion as fine sediment does not provide nutrient for the de- caying of organic matter in water. At day 7, it is observed that samples in flowing condition had 7.2 mg/L of DO concentration, which is slightly higher than the samples in stagnant condition. The increasing in low of water results a great mixing of the atmospheric oxygen with water (APEC, 2011). Therefore flowing water is having higher DO concentration relative to the stagnant water. It is investigated that parameters of BOD, COD and ammonium nitrogen is similar with drinking water and it is within the range for safe drinking water. Total suspended solid (TSS) and turbidity were observed for different soil type. The impact of fine sediment on TSS and turbidity are not fixed but depend on proportion of clay content. From Figure 5, it showed that TSS Figure 4. DO over time. Figure 5. Total suspended solid (TSS) at varying weight of the fine sediment. 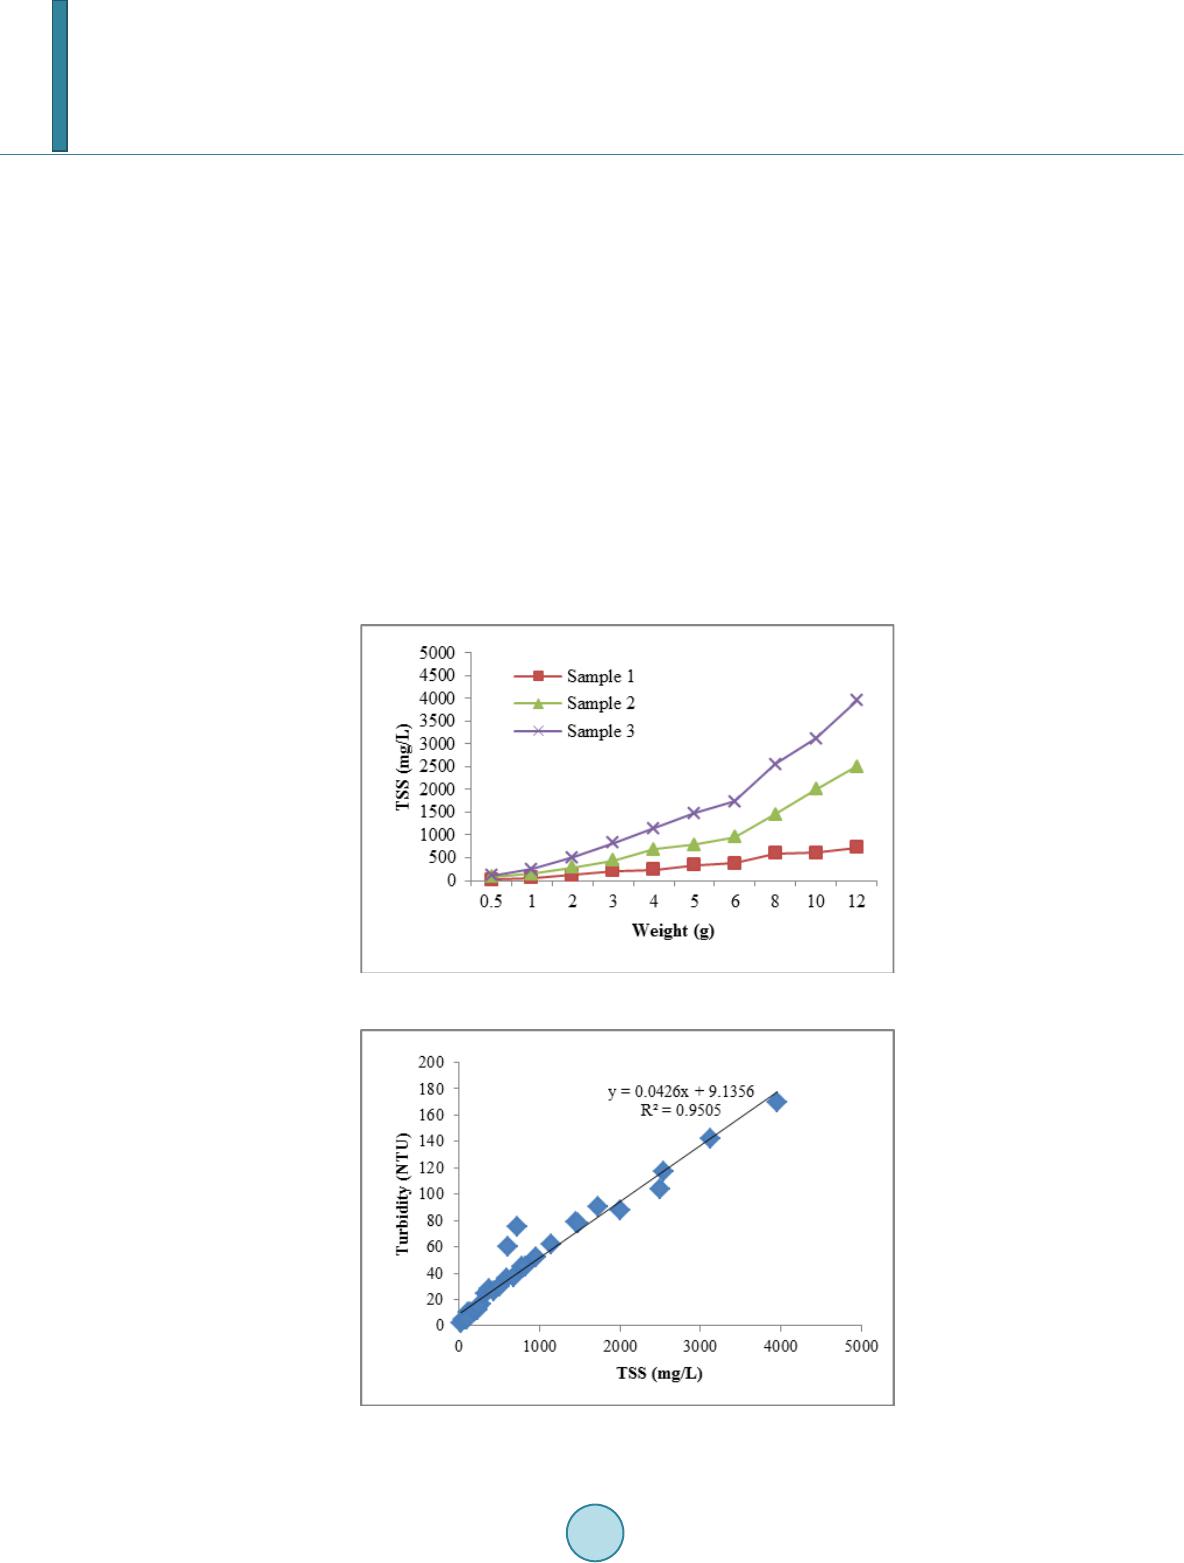 T. K. Hern et al. increased with the weight of fine sediments for all types of soil sample. Sample 1 with clay content of 54% had the highest TSS value at varying weight of fine sediment, followed by Siri Bungor and Aluvium with clay con- tent of 18% and 12% of clay content respectively. It is because the higher the content of clay, the higher the value of TSS and turbidity. TSS for all types of soil sample increased steadily from 0.5 g until 6.0 g and in- creased rapidly from 6.0 g until 12.0 g. At 8.0 g, the TSS rapidly increased to 593 mg/L, 1450 mg/L and 2550 mg/L for soil sample type 1, 2 and 3 respectively. The highest value of TSS achieved was 721 mg/L, 250 0 mg/L and 3950 mg/L for Sample 1, 2 and 3 respectively. The effect of weight of fine sediments on the turbidity was also investigated. Previous study has shown that suspended silt concentration gr avimetrically gives a linear relationship with tu rb idity (Divakaran et al., 2011). The results are shown in Figure 6. Turbidity increased wi th th e increasing of the weight of fine sediments for all types of soil sample. It is observed that turbidity at varying weight of fine sediment had the similar trend with the TSS. Soil sample type 3 has the highest turbidity achieved at varying weight of fine sediment followed by type 2 and type 1. All soil samples achieved highest turbidity value at 12 g weight of fine sediment i.e. 75 NTU, 104 NTU and 170 NTU for soil Sample 1, 2 and 3 resp ectively. Past studies had been conducted and consistently showed a good correlation between TSS and turbidity (Ali et al., 2 013 ) . Relations hip between TSS and turbidity is show n in Figure 7. Generally the plo tted data showed a good positive co rr elatio n relation ship b etween TS S a nd tu rbid ity with a coefficien t of deter mination , R2 = 0.9505. Figure 6. Turbidity at varying weight of the fine sediment. Figure 7. Correlation between TSS and turbidity.  T. K. Hern et al. Statistical Analysis Statistical analysis has been wid ely used in analyzing the correlation of TSS to other parameters (Ali et al., 2013 ; Bhandari et al., 2008; Shrestha et al., 2007). Referring to the result above, TSS value is decreasing for time and the early stag e settlement is due to coarse sediment settled down and later stage is due to the settlement of fine sediment. Therefore time, total sediment mass, fine sediment mass and flow rate in all cases. Corr elatio n value between TSS with time, total sediment mass, fine sediment mass and flow rate is shown in Table 4. A negative correlation was found between TSS and time (r = −0.503) . This shows that the increasing of time will cause the TSS to exhibit a decrease in value. Positive correlation was found between TSS and total soil mass (r = 0.439), TSS and fin e soil mass (r = 0.419) and TSS and flow rate (r = 0.009) . Value of TSS will increase or decrease with the increase or decrease or total soil mass, fine soil mass and flow rate. Multiple nonlinear regression anal- ysis has been used to analyze the correlation between TSS with time, total sediment mass, fine sediment mass and flow r ate. The equation of estimated TSS is shown is equ ation 3 with coefficient of determination, R2 = 0.908. 0.20.803 0.2040.003 TSS 0.166tTSFSFR −− = (3) Therefore, positive correlation is observed from the multiple non-linear regression analysis and is shown in Figure 8. We can observe that the predicted TSS is almost similar to the observed TSS with R2 = 0.9098 . Th i s showed that parameter TSS is affected by time, total sediment mass, fine sediment mass and f low rate as w ell. 4. Conclusion This study showed the effect of fine sediment to the water quality in retention structure with clean water under stagnant and flowing condition. It is observed that water quality parameters are influenced by fine sediments. Fine sediment greatly affects the turbidity and TSS value whereas the effect on pH, DO, BOD, COD and am- monium nitrogen is not obvious. Higher silt and clay content in soil sample will have higher turbidity and TSS Figure 8. Correlation of predicted TSS versus observed TSS. Table 4. Coefficient of correlation for TSS. Parameter Parameters and coefficient of determination Parameters R TSS Time Total soil mass Fine soil mass Flow rate −0.503 0.493 0.419 0.009  T. K. Hern et al. value compared to those lower silt and clay content for the same amount of fine sediment. We investigated that settlement of fine sediments depends on time, total sediment mass, fine sediment mass and flow rate. A good positive correlation relationship between TSS and turbidity with a correlation coefficient of R2 = 0.9505. How- ever further study on fine sediment will be conducted for actual pond water. Acknowledgements The authors are grateful to the Government of Malaysia for the financial support through the UMRG grant no. RP008B-13SUS and FRGS grant n o. FP028-2012A. The authors thank also the faculty of engineering for the facilities provided for this research work. References Ali, Z. M., Ibrahim, N. A., Mengersen, K., Shitan, M., & Juahir, H. (2013). New Relative Importance of Water Quality Variables in Langat River. International Journal of Chemical & Environmental Engineering, 4. APEC (2011). APEC Water Systems: Free Drinking Water, Learn about Water Quality. http://www.freedrinkingwater.com/water_quality/quality1/1-how-dissolved-oxygen -affects-water-quality-htm APHA (2005). Standard Methods of Water and Wastewater (21st ed.). Washington DC: American Public Health Associa- tion. Astel, A., Biziuk, M., Przy jaz ny, A., & Namieśnik, J. (2006). Chemometrics in Monitoring Spatial and Temporal Variations in Drinking Water Quality. Water Research, 40, 1706-1716. http://dx.doi.org/10.1016/j.watres.2006.02.018 Bhandari, N. S., & Nayal, K. (2008). Correlation Study on Physico-Chemical Parameters and Quality Assessment of Kosi River Water, Uttarakhand. Journal of Chemistry, 5, 342-346. Divakaran, R., & Sivasankara Pillai, V. N. (2002). Flocculation of River Silt Using Chitosan. Water Research, 36, 2414- 2418. http://dx.doi.org/10.1016/S0043-1354(01)00436-5 Eisakhani, M., & Malakahmad, A. (2009). Water Quality Assessment of Bertam River and Its Tributaries in Cameron High- lands, Malaysia. World Applied Sciences Journal, 7, 769-776. Gandaseca, S., Rosli, N., Ngayop, J., & Arianto, C. I. (2011). Status of Water Quality Based on the Physico-Chemical As- sessment on River Water at Wildlife Sanctuary Sibuti Mangrove Forest, Miri Sarawak. American Journal of Environ- mental Sciences, 7. http://dx.doi.org/10.3844/ajessp.2011.269.275 Johnston, C. A. (1991). Sediment and Nutrient Retention by Freshwater Wetlands: Effects on Surface Water Quality. Criti- cal Reviews in Environmental Science and Technology, 21, 491-565. Jonnalagadda, S. B., & Mhere , G. (2001). Water Quality of the Odzi River in the Eastern Highlands of Zimbabwe. Water Research, 35, 2371-2376. http://dx.doi.org/10.1016/S0043-1354(00)00533-9 Lee, P. K., Touray, J. C., Baillif, P., & Ildefonse, J. P. (1997). Heavy Metal Contamination of Settling Particles in a Reten- tion Pond along the A-71 Motorway in Sologne, France. Science of the Total Environment, 201, 1-15. http://dx.doi.org/10.1016/S0048-9697(97)84048-X Nazahiyah, R., Yusop , Z., & Abustan, I. (2007). Stormwater Quality and Pollution Loading from an Urban Residential Catchment in Johor, Malaysia. Water Science & Technology, 56. http://dx.doi.org/10.2166/wst.2007.692 Sawyer, C. N., & McCarty, P. L. (1978). Chemistry for Environmental Engineering (3rd ed.). New York: McGraw-Hill Book Co. Yisa, J., & Jimoh, T. (2010). Analytical Studies on Water Quality Index of River Landzu. American Journal of Applied Sci- ences, 7. http://dx.doi.org/10.3844/ajassp.2010.453.458
|