Journal of Computer and Communications, 2014, 2, 32-37
Published Online July 2014 in SciRes. http://www.scirp.org/journal/jcc
http://dx.doi.org/10.4236/jcc.2014.29005
How to cite this paper: Karabulut, E.M. and Ibrikci, T. (2014) Analysis of Cardiotocogram Data for Fetal Distress Determina-
tion by Decision Tree Based Adaptive Boosting Approach. Journal of Computer and Communications, 2, 32-37.
http://dx.doi.org/10.4236/jcc.2014.29005
Analysis of Cardiotocogram Data for Fetal
Distress Determination by Decision Tree
Based Adaptive Boosting Approach
Esra Mahsereci Karabulut1, Turgay Ibrikci2
1Computer Programming Department, Gaziantep University, Gaziantep, Turkey
2Department of Electrical and Electronics Engineering, Cukurova University, Adana, Turkey
Email: mahs ere ci@ gant ep.ed u .tr
Received April 2014
Abstract
Cardiotocography is one of the most widely used technique for recording changes in fetal heart
rate (FHR) and uterine contractions. Assessing cardiotocography is crucial in that it leads to iden-
tifying fetuses which suffer from lack of oxygen, i.e. h ypoxia. This situation is defined as fetal dis-
tress and requires fetal intervention in order to prevent fetus death or other neurological disease
caused by hypoxia. In this study a computer-based approach for analyzing cardiotocogram in-
cluding diagnostic features for discriminating a pathologic fetus. In order to achieve this aim
adaptive boosting ensemble of decision trees and various other machine learning algorithms are
employed.
Keywords
Cardi o toc ogr am , Fetal Distress, Adaptive Boosting, Decision Tree
1. Introduction
Cardiotocography (also called as electronic fetal monitoring, EFM) is a worldwide technique for fetal monitor-
ing. Two transducers measuring fetal heart rate (FHR) and uterine contractions are placed on the abdomen of a
pregnant. Cardiotocogram (CTG) refers to simultaneous recording of both FHR and uterine contractions.
Many typical findings are included in a CTG and obstetricians make clinical decisions about the state of the
fetus considering these findings. However the interpretation of the information provided by CTG is not standar-
dized. The deficient interpretation of CTG leaded to unnecessary surgical intervention, e.g. increase in cesarean
births [1]. Therefore, computer-based approaches are presented recently. Huang and Hsu [2] proposed discrimi-
nant analysis (DA), decision tree (DT), and artificial neural network (ANN) in their study to evaluate fetal dis-
tress by the same CTG data used in this study. They reached the results showing that the accuracies of DA, DT
and ANN are 82.1%, 86.36% and 97.78% respectively, and 80%, 10%, and the remaining 10% of the whole da-
taset were randomly used for training, testing, and validation respectively. Sundar et al. [3] implemented a su-
pervised ANN which can classify the CTG data, the results are evaluated with respect to rand index, precision,
E. M. Karabulut, T. Ibrikci
33
recall and f-Score. The authors presented another related work in which neural network based classification
model has been compared with the most commonly used unsupervised clustering methods; Fuzzy C-mean and
k-mean clustering [4]. The arrived results show that the performance of the supervised ANN approach provided
outperformed the other compared unsupervised clustering methods significantly. In a study, least squares sup-
port vector machine (LS-SVM) is employed utilizing a binary decision tree is for classification of the same car-
diotocogram data to determine the fetal state [5]. Particle swarm optimization (PSO) is used for the optimization
of parameters of LS-SVM, they reached a classification accuracy rate of 91.62%.
In this study, CTG data is analyzed by an ensemble approach of adaptive boosting (AdaBoost). Each base
classifier of the system is a decision tree which contributes to the final decision of the system, by which 95.01%
accuracy is achieved. We also presented a performance comparison of classification algorithms with and without
incorporation of the AdaBoost ensemble. Therefore, contribution of AdaBoost to classification algorithms is
analyzed with respect to CTG data.
2. Material and Methodology
2.1. Dataset Descriptions
The cardiotocography data set used in this study is publicly available at “The Data Mining Repository of Uni-
versity of California Irvine (UCI)” [6]. By using 21 given attributes data can be classified according to FHR
pattern class or fetal state class code. In this study, fetal state class code is used as target attribute instead of FHR
pattern class code and each sample is classified into one of three groups normal, suspicious or pathologic.
The dataset includes a total of 2126 samples of which is 1655 normal, 295 suspicious and 176 pathologic
samples which indicate the existing of fetal distress. Attribute information is given as:
LBFHR baseline (beats per minute)
AC# of accelerations per second
FM—# of fetal movements per second
UC# of uterine contractions per second
DL# of light decelerations per second
DS# of severe decelerations per second
DP# of prolongued decelerations per second
ASTV—percentage of time with abnormal short term variability
MSTVmean value of short term variability
ALT Vpercentage of time with abnormal long term variability
MLT Vmean value of long term variability
Widthwidth of FHR histogram
Minminimum of FHR histogram
MaxMaximum of FHR histogram
Nmax# of histogram peaks
Nzeros# of histogram zeros
Modehistogram mode
Meanhistogram mean
Medianhistogram median
Variancehistogram variance
Te nde nc yhistogram tendency
CLASS FHR pattern class code (1 to 10)
NSP—fetal state class code (N = normal; S = suspect; P = pa thologic)
2.2. Decision Tree Based Adaptive Boosting (AdaBoost) Method
Adaptive boosting (AdaBoost) algorithm [7] is the most popular variant of boosting ensemble method. In an en-
semble system more than one classifier is trained and each classifier contributes to the final decision of the sys-
tem [8]. These contributing classifiers are called base classifiers. Boosting produces base classifiers one after
another. Each base classifier is dependent on the previous classifier, such that the training set chosen for a base
classifier includes the set of incorrectly classified instances by previous base classifier. Therefore, the ensemble
E. M. Karabulut, T. Ibrikci
34
is strengthened by a new base classifier that fixes previous errors. Differently, AdaBoost assigns a weight value
for each candidate training sample. The candidate training sample that is incorrectly classified by previous clas-
sifiers has greater weight [9]. These candidates are selected according to their weights for training set of next
base classifier to be added. Therefore, AdaBoost concentrates on samples which are difficult to classify correctly.
Base classifiers are added until a low ratio of error is reached. Unlike boosting algorithm’s decision strategy of
majority vote, AdaBoost decides with respect to weighted votes. Votes are weighted according to training accu-
racies of classifiers. In this study, decision trees are used as base classifiers as depicted in Figure 1.
A decision tree is a prediction method which can easily integrate with information technologies, and can be
used in clinical decision making, for example a type of decision tree C4.5 can be used to yield clinically useful
predictive values [10].
Data classification is a two-phase operation in a decision tree. First phase is training phase, and second is
classification phase. At training phase, a training data is used for construction of the tree. The rules of the tree
are determined according to this training data. C4.5 algorithm selects the attributes according to their entropy
quantities, while constructing a tree.
At the classification phase, a test data is used for validation of the constructed tree. If accuracy of the tree is at
an acceptable ratio, then the tree is used for new data samples. Decision process in a tree is from root node until
reaching a leaf, following consequent nodes. A path from root node to a leaf produces a decision rule of the tree.
Decision rules resemble rules in programming languages. To classify a new sample is started from the root and
queried among a top-down path until a leaf is reached. When a leaf is reached, it is determined as the class of
that sample.
3. Experimental Results
Mean absolute error (MAE), kappa statistics and accuracy are used as model evaluation metrics for experimental
results. MAE is the mean of the absolute values of the each classification errors on all samples.
1
MAE
n
ii
i
yp
n
=
=
(1)
Misclassified
weighted samples
Decision
Tree 1
Decision
Tree 2
Decision
Tree n
Misclassified
weighted samples
Sampling without
replacement
Figure 1. Training phase of the model used by em-
ploying decision tree based AdaBoost ensemble.
E. M. Karabulut, T. Ibrikci
35
Equation (1) denotes the calculation of MAE where yi is the actual value and pi is the predicted value, and n is
the total number of samples in the data.
Kappa statistics measures the agreement between classifier predictions with actual class values. It is used for
assessing how the predictions are far from the results produced by chance and expected to be as approximate to
1 as possible:
1
classifier chance
chance
pr pr
Kappa pr
=
(2)
prclassifier is the proportion of data samples that the classifier predictions and actual values agree. prchance is the
proportion of the agreement which may occur by chance. A kappa value of 0 indicates that the accuracy achiev-
ed by classifier is by chance and a kappa value of 1 indicates a perfect agreement.
Accuracy is a measurement of closeness of classification results to the actual values of class labels of samples,
and defined as the proportion of number of correctly classified samples to number of all samples.
In order to compare the performance of the classification algorithms without and with AdaBoost ensemble
technique, WEKA data mining tool [11] is used, which is a collection of machine learning algorithms written in
Java. The default parameters were used for each classification algorithm. 10-fold cross validation is utilized to
validate the performance of the classifier, data separated into 10 subsets, and the hold out operation is performed
10 times in each of which a subset is used for testing and the other subsets are used for training. Therefore, the
eventual accuracy is calculated by averaging 10 accumulated accuracies.
According to Table 1, by employing decision tree based AdaBoost ensemble method 1622 + 236 + 162 =
2020 of 2126 is perfectly predicted, a promising result. 26 samples are predicted as suspic io us, and 7 as “pa-
thologicwhereas they have actual values of nor mal . 55 norma land 4 pathologicclassified instances
have actual values of suspicious. Additionally, 7 normaland 7 suspiciousclassified samples have actual
values of “pathologic”.
Six classification models are evaluated with respect to metrics of MAE, kappa statistics and accuracy. Table
2 and Table 3 represent the classification results of various algorithms without AdaBoost and with AdaBoost
respectively.
Unlike Table 2, Table 3 includes the results of the algorithms produced by models which are used as base
classifiers in AdaBoost ensemble method. Compared to Table 2, the results of Table 3 are bolded if any im-
provement is achieved. That is, if there is a reduction in error quantity, MAE, and an increase in kappa statistics
and accuracy, the corresponding values of the classifier is bolded. Accordingly AdaBoost ensemble method
Table 1. Confusion matrix of classification by decision tree based AdaBoost ensemble.
Predicted values
Normal Suspicious Pathologic
Actual values
Normal 1622 26 7
Suspicious 55 236 4
Pathologic 7 7 162
Table 2. Evaluation results without AdaBoost.
No Algorithm MAE Kappa Acc. (%)
1 Naive Bayes 0.125 0.582 81.562
2 Radial Basis Function Network 0.123 0.642 85.983
3 Bayesian Network 0.091 0.670 86.783
4 Support Vector Machine 0.250 0.674 88.758
5 Neural Network 0.058 0.784 92.098
6 Decision Tree (C4.5) 0.059 0.793 92.427
E. M. Karabulut, T. Ibrikci
36
contributed to improvement of four of six models with respect to MAE, kappa statistics and accuracy.
In Table 2, the results of neural network and decision tree appear to be close to each other, approximately
92%. However, Table 3 shows that the contribution of AdaBoost ensemble is to C4.5 decision tree and accuracy
is improved up to 95.014%. Additionally, the maximum improvement is achieved by both Naive Bayes and
Bayesian network by approximately 6% advancement. One percent is even meaningful that is it means approx-
imately 21 patients in the data. AdaBoost isn’t able to contribute to support vector machine and neural network
results, but also a considerable inverse effect is not observed with respect to all three evaluation metrics.
The analysis results are very promising as for comparing with the related works. As stated earlier Huang and
Hsu [2] analyzed the same data and reached the results showing that the accuracies of DA, DT and ANN are
82.1%, 86.36% and 97.78% respectively, and 80%, 10%, and the remaining 10% of the whole dataset were ran-
domly used for training, testing, and validation respectively. ANN result of 97.78% accuracy doesn’t outperform
our decision tree based AdaBoost result of 95.01%, because in this study not a part of data is selected for test,
but 10-fold cross validation technique is used for stability. Another admirable study [5] analyzed the same data
by least squares support vector machine (LS-SVM) utilizing a binary decision tree, optimizing the parameters by
PSO, they reached a classification accuracy rate of 91.62%, again outperformed by AdaBoost ensemble with
base classifiers of decision tre es.
4. Conclusions
Computer based studies in medical area lead to great advance in clinical decision support systems. The progress
in machine learning area requires a simultaneous contribution to medical area with respect to quality and pre-
venting human supplied errors. However, a very successful computer based solution for a medical or some other
Table 3. Evaluation results with AdaBoost.
No Algorithm MAE Kappa Acc. (%)
1 Naive Bayes 0.112 0.673 87.394
2 Radial Basis Function Network 0.103 0.668 87.676
3 Bayesian Network 0.055 0.799 92.615
4 Support Vector Machine 0.098 0.673 88.664
5 Neural Network 0.069 0.783 92.051
6 Decision Tree (C4.5) 0.034 0.861 95.014
Figure 2. Representation of AdaBoost ensemble con-
tribution to classifiers.
E. M. Karabulut, T. Ibrikci
37
problem from different area, can fail for a different problem. Therefore, search should be broadened for a com-
puter solution especially for a medical decision. Therefore, the results of prior studies are considered in our
analysis of CTG. The determination of state of fetus is especially important for early intervention of required
cases, i.e. fetal distress or preventing unnecessary surgeries.
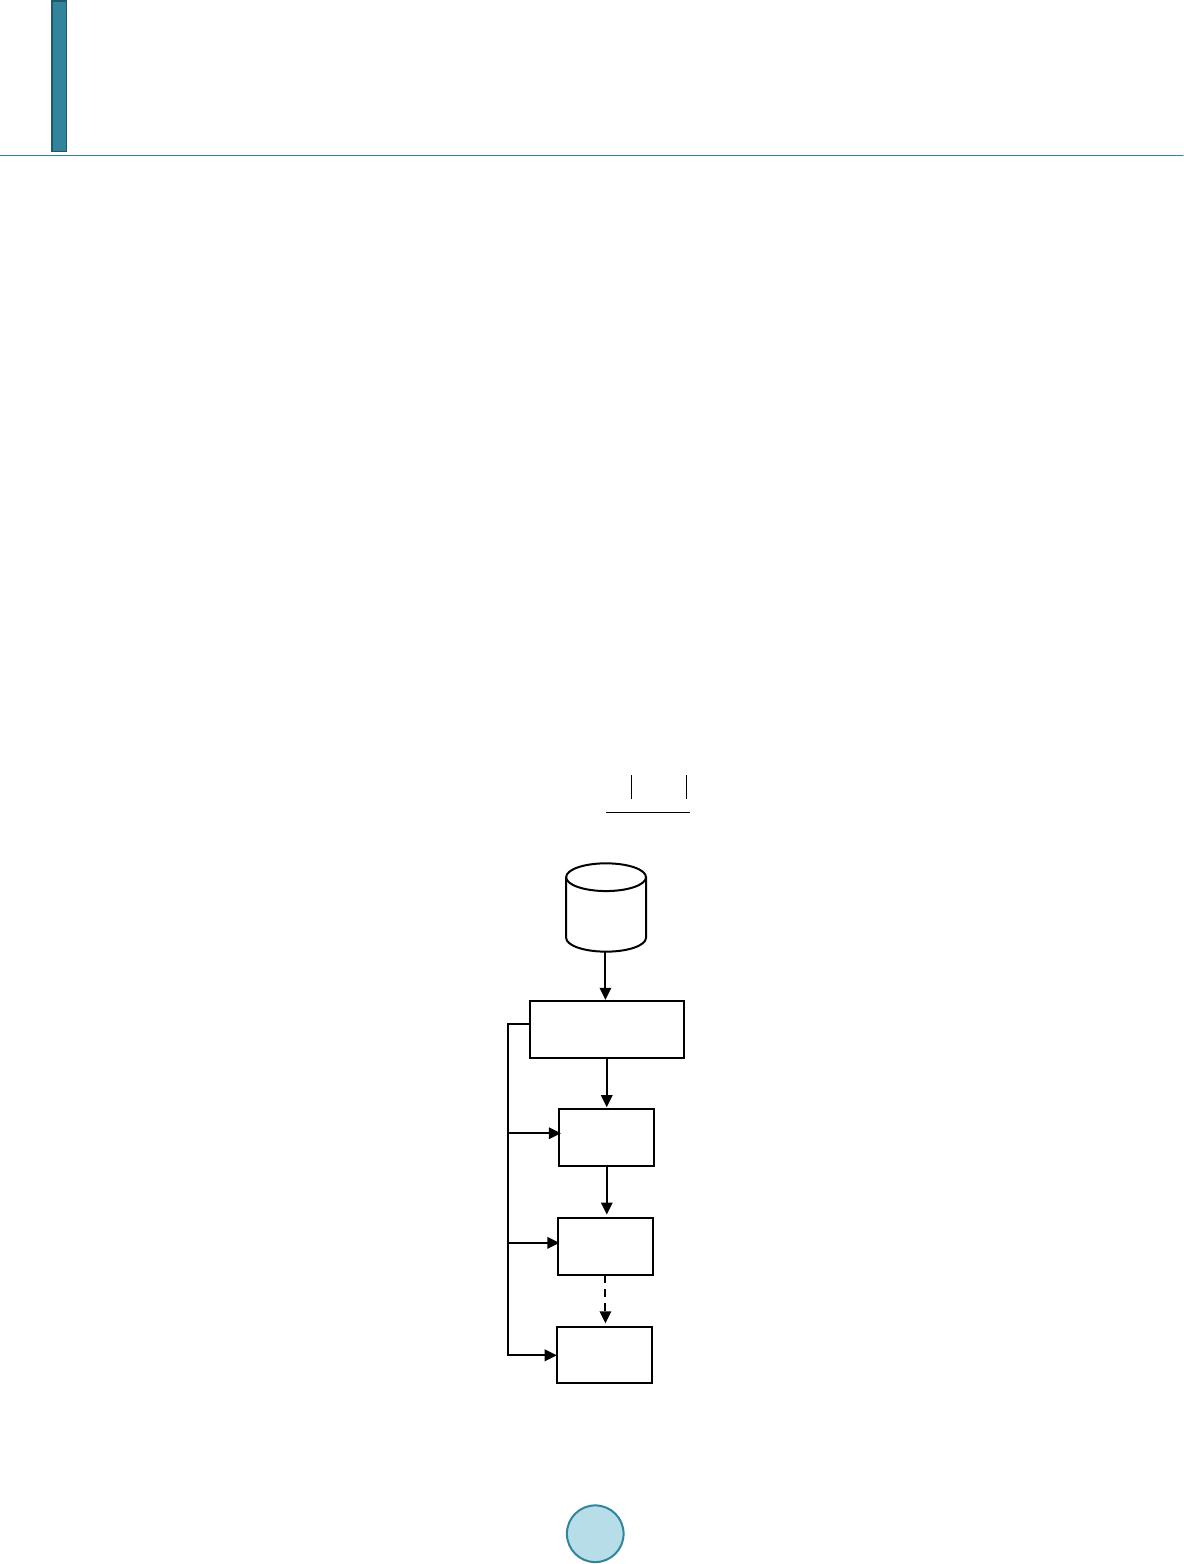
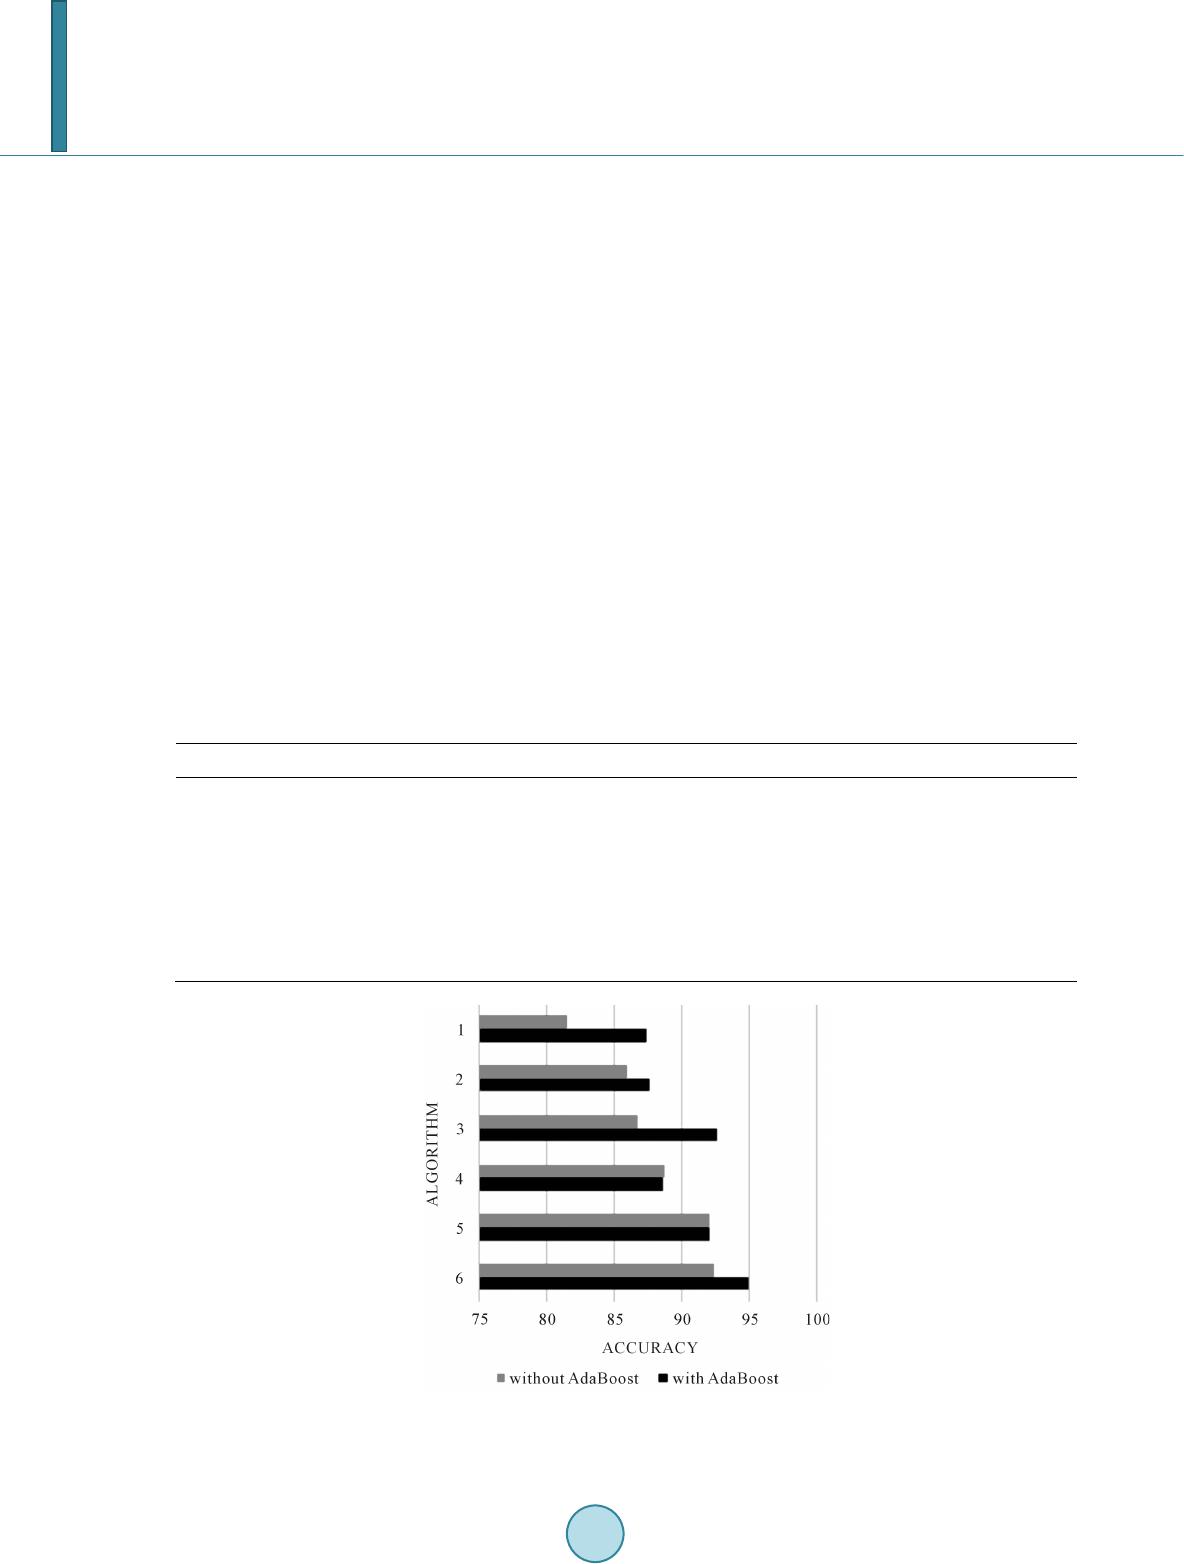
The effect of using AdaBoost ensemble on classifiers is investigated for perfect determination of fetal distress
from CTG data in this study. Figure 2 visually represents the promising results of experiments related to contri-
bution of AdaBoost ensemble on classifying machine learning algorithms, confirming the fact that ensemble
machine learning approaches often performs much better than single classifiers that make them up [12]. The
most prominent result belongs to decision tree based AdaBoost algorithm by 0.034 MAE, 0.861 kappa statistics
and 95.01% accuracy, meaning that 2020 of 2126 samples are perfectly predicted. These results are an improved
next step following the related studies carried out in literature.
References
[1] Steer, P.J. (2008) Has Electronic Fetal Heart Rate Monitoring Made a Difference? Seminars in Fetal and Neonatal Me-
dicine, 13, WB Saunders, 2-7.
[2] Huang, M. and Hsu, Y. (2012) Fetal Distress Prediction Using Discriminant Analysis, Decision Tree, and Artificial
Neural Network. Journal of Biomedical Science & Engineering, 5, 526-533.
http://dx.doi.org/10.4236/jbise.2012.59065
[3] Sundar, C., Chi tra devi , M. and Geetharamani, G. (2012) Classification of Cardiotocogram Data Using Neural Network
Based Machine Learning Technique. International Journal of Computer Applications, 47, 19-25.
http://dx.doi.org/10.5120/7256-0279
[4] Sundar, C., Chi trad evi, M. and Geetharamani, G. (2013) An Overview of Research Challenges for Classification of
Cardiotocogram Data. Journal of Computer Science, 9, 198-206. http://dx.doi.org/10.3844/jcssp.2013.198.206
[5] Yılmaz, E. and Kılıkçıer, Ç. (2013) Determination of Fetal State from Cardiotocogram Using LS-SVM with Particle
Swarm Optimization and Binary Decision Tree. Computational and Mathematical Methods in Medicine, 20 13, 2013.
http://dx.doi.org/10.1155/2013/487179
[6] Newman, D.J., Heittech, S., Blake, C.L. and Merz, C.J. (1998) UCI Repository of Machine Learning Datab ases. Uni-
versity California Irvine, Department of Information and Computer Science.
[7] Fr eu nd, Y. and Schapire, R. (1996) Experiments with a New Boosting Algorithm. Machine Learning: Proceedings of
the Thirteenth International Conference, 1996, 148-156.
[8] Kuncheva, L. (2004) Combining Pattern Classifiers Methods and Algorithms. Wiley-Interscience, 360.
http://dx.doi.org/10.1002/0471660264
[9] Duda, O.R., Hart, P.E. and Stork, D.G. (2006) Pattern Classification. John Wiley & Sons Inc.
[10] Tanner, L., et al. (2008) Decision Tree Algorithms Predict the Diagnosis and Outcome of Dengue Fever in the Early
Phase of Illness. PLoS Neglected Tropical Diseases, 2, e196. http://dx.doi.org/10.1371/journal.pntd.0000196
[11] Hall, M., Frank, E., Holmes, G., Pfahringer, B., Reutemann, P. and Witten, I.H. The WEKA Data Mining Software: An
Update. SIGKDD Explorations, 11, 1.
[12] Wang, C.W. (2006) New Ensemble Machine Learning Method for Classification and Prediction on Gene Expression
Data. Engineering in Medicine and Biology Society, 2006. EMBS06. 28th Annual International Conference of the
IEEE, 2006, 3478-34 81 .