 Journal of Geoscience and Environment Protection, 2014, 2, 8-15 Published Online June 2014 in SciRes. http://www.scirp.org/journal/gep http://dx.doi.org/10.4236/gep.2014.23002 How to cite this paper: Yang, J. W., & Joshi, S. D. (2014). Hydro-Geophysical Investigation of Contaminant Distribution at a Closed Landfill in Southwestern Ontario, Canada. Journal of Geoscience and Environment Protection, 2, 8-15. http://dx.doi.org/10.4236/gep.2014.23002 Hydro- Geophysical Investigation of Contaminant Distribution at a Closed Landfill in Southwestern Ontario, Canada Jianwen Yang1,2, Siddharth Dilip Joshi3 1College of Earth Sciences, Guilin University of Technology, Guilin, China 2Depart men t of Earth and Environmental Sciences, University of Windsor, Windsor, Canada 3Conestoga-Rovers & Associates, Waterloo, Canada Email: jianweny@uwindsor.ca Received February 2014 Abstract This paper presents a hydro-geophysical investigation into the landfill leachate distribution and subsurface geology at a closed site in southwestern Ontario, Canada, using geophysical mapping and hydrological modeling approaches. Conductivity mapping was first conducted over the study site using a frequency-domain EM terrain conductivity meter, revealing an anomalous high-con- ductivity zone of about 200 m (S-N) × 80 m (W-E) at the western half of the site. The DC resistivity survey was then carried out at this anomalous zone with eight S-N profiles and three W-E profiles measuring 200m in length using a Wenner-α configuration. Our resistivity survey results indicate that the landfill leachate travels mainly south-east wards over the upper aquifer, with a minor vertical component into the upper weathered portion of the silt/sand aquitard at some locations. No contamination seems to exist in the lower sand aquifer. The geophysical results were later used to develop two conceptualized models for hydrological modeling. Our numerical results pre- dict the leachate distribution at the study site in the future, confirming that the contaminant will occupy the entire upper aquifer and the most of the aquitard in a time of 1000 years, and that the barrier of the aquitard will protect the lower sand aquifer from the leachate pollution. These findings are critical in evaluating the current leachate conditions and the existing compliance monitoring plan for potential implementation at this study site and other sites in elsewhere. Keywords Geophysical Mapping, Hydrological Modeling, Landfill Leachate, Southwestern Ontario, Canada 1. Introduction Landfills are viewed as one of the most practical and economical methods of waste disposal if constructed prop- erly (El-Fadel et al., 1997; Scott et al., 2005). A major concern with landfilling is the mobilization of highly toxic fluid (liquid or gas) to areas outside the landfills, leading to possible groundwater, surface water, soil and air pollution (Farquhar, 1989; Kjeldsen et al., 2002). The scrupulous examination of contaminated sites necessi-  J. W. Yang, S. D. Joshi tates the setting up of boreholes around and within the confining areas of the sites (Reichard & Evans, 1989; Freeze et al., 1990). However, boreholes only provide a very limited and point-source typed information, disre- garding the areal extent of the contamination at the sites (Zume et al., 2006). Non-invasive geophysical methods, especially geo-electrical methods, have proven their credibility in landfill-related studies, and become standard tools over the past decades in the determination of internal landfill structure, leachate levels and cap material thickness (e.g., Loke, 1999; Osiensky, 1999; Bernstone et al., 2000; Radulescu, Valerian, & Yang, 2007; Zhu & Yang, 2008; Joshi, 2013). Targeting a closed municipal solid waste landfill in southwestern Ontario, Canada, this paper first presents geophysical mapping results of the underground leachate distribution and the subsurface structure using a fre- quency-domain EM terrain conductivity system and a DC resistivity system, and then predicts the groundwater flow and landfill leachate pathways in the future using hydrological modeling that is constrained by the geo- physical results. 2. Hydrogeological Setting of the Study Site The site covers an area of 34 hectares which comprises of the decommissioned landfill and a transfer station. The site stopped accepting waste in 1993, and sits on a beach ridge deposit of fine sand underlain by a glacial till deposit of sand and silt. The sand has been extensively mined in the area. The glacial till is exposed on the west- ern portion of the site, and this layer thins southwards and eventually disappears, forming a local groundwater divide. The upper sand unit and the upper portion of the silt/sand till form a shallow (upper) aquifer and the di- rection of water flow therein is mainly easterly to south-easterly, governed by the local variation in water level, sand pit construction and the presence of the leachate collection system. The average thickness of the upper sand aquifer is about 10 - 15 m with the waste occupying majority of the layer. Water levels fluctuate greatly during different times of the year: lower during the Summer and Fall and higher during the Spring. Underlying the up- per aquifer is the glacial till deposit comprising a mixture of primarily sand and silt. This layer has the hydro- geological properties of an aquitard and measures about 12 m in thickness. This silt/sand aquitard gradually thins and eventually disappears south of the landfill. There is a confined aquifer system associated with the lower sand unit underlying the silt/sand aquitard, and the direction of flow in this aquifer is north to north-ea st - erly with its thickness ranging from 8 - 10 m. The lower sand aquifer merges with the upper sand aquifer south of the landfill where the silt/sand aquitard disappears. Waste is located and occupies most of the upper aquifer with a thin layer of sand between the waste and the silt/sand aquitard. Due to extensive extraction activities the upper aquifer and the underlying silt/sand aquitard were accidently removed, leading to non-compliance issues with respect to drinking water standards. The leachate exhibits a higher concentration of chloride and chloro- vinyl on the western portion compared to the eastern portion of the site (EWSWA, 2011). Despite this general understanding, the areal and vertical extent of the landfill leachate, as well as the details of the subsurface geo- logical structure of the study site, remain unresolved. 3. Geophysical Surveys The landfill site consists of primarily industrial, commercial and institutional waste (EWSWA, 2011) that de- grades over time in the presence of water to form leachate. The anions and cations present in leachate make it electrically more conductive than the surrounding rock and soil, thus enabling geo-electrical methods ideal for mapping the extent of leachate distribution (Loke, 1999; Radulescu, Valerian, & Yang, 2007; Zhu & Yang, 2008). A frequency-domain terrain conductivity instrument DualEM 2S/4S (McNeill, 1980; Taylor, 1999) was first employed to determine the areal distribution of apparent conductivity over the study site. The instrument con- sists of dual coil geometries for the receiver, that is, the Horizontal Co-Planar (HCP) and the Perpendicular Pla- nar (PRP). The distance between the transmitter and receiver coils can be adjusted to either 2 m or 4 m, respec- tively corresponding to 3 m and 6 m penetration depth for the HCP configuration. The instrument requires no physical contact with the ground, thus it can measure the apparent conductivity as fast as the surveyor can walk. In this study, fifty five profile lines were setup in the north-south direction, 500 m long and 5 m apart with each other, covering the entire site. The apparent conductivity readings were matched with the respective GPS loca- tions in Excel and later transferred to ArcMap 10.1 for plotting. Figure 1 is the apparent conductivity obtained with the HCP-2 m configuration, illustrating the areal distribution of ‘averaged’ bulk conductivity of 3 m depth 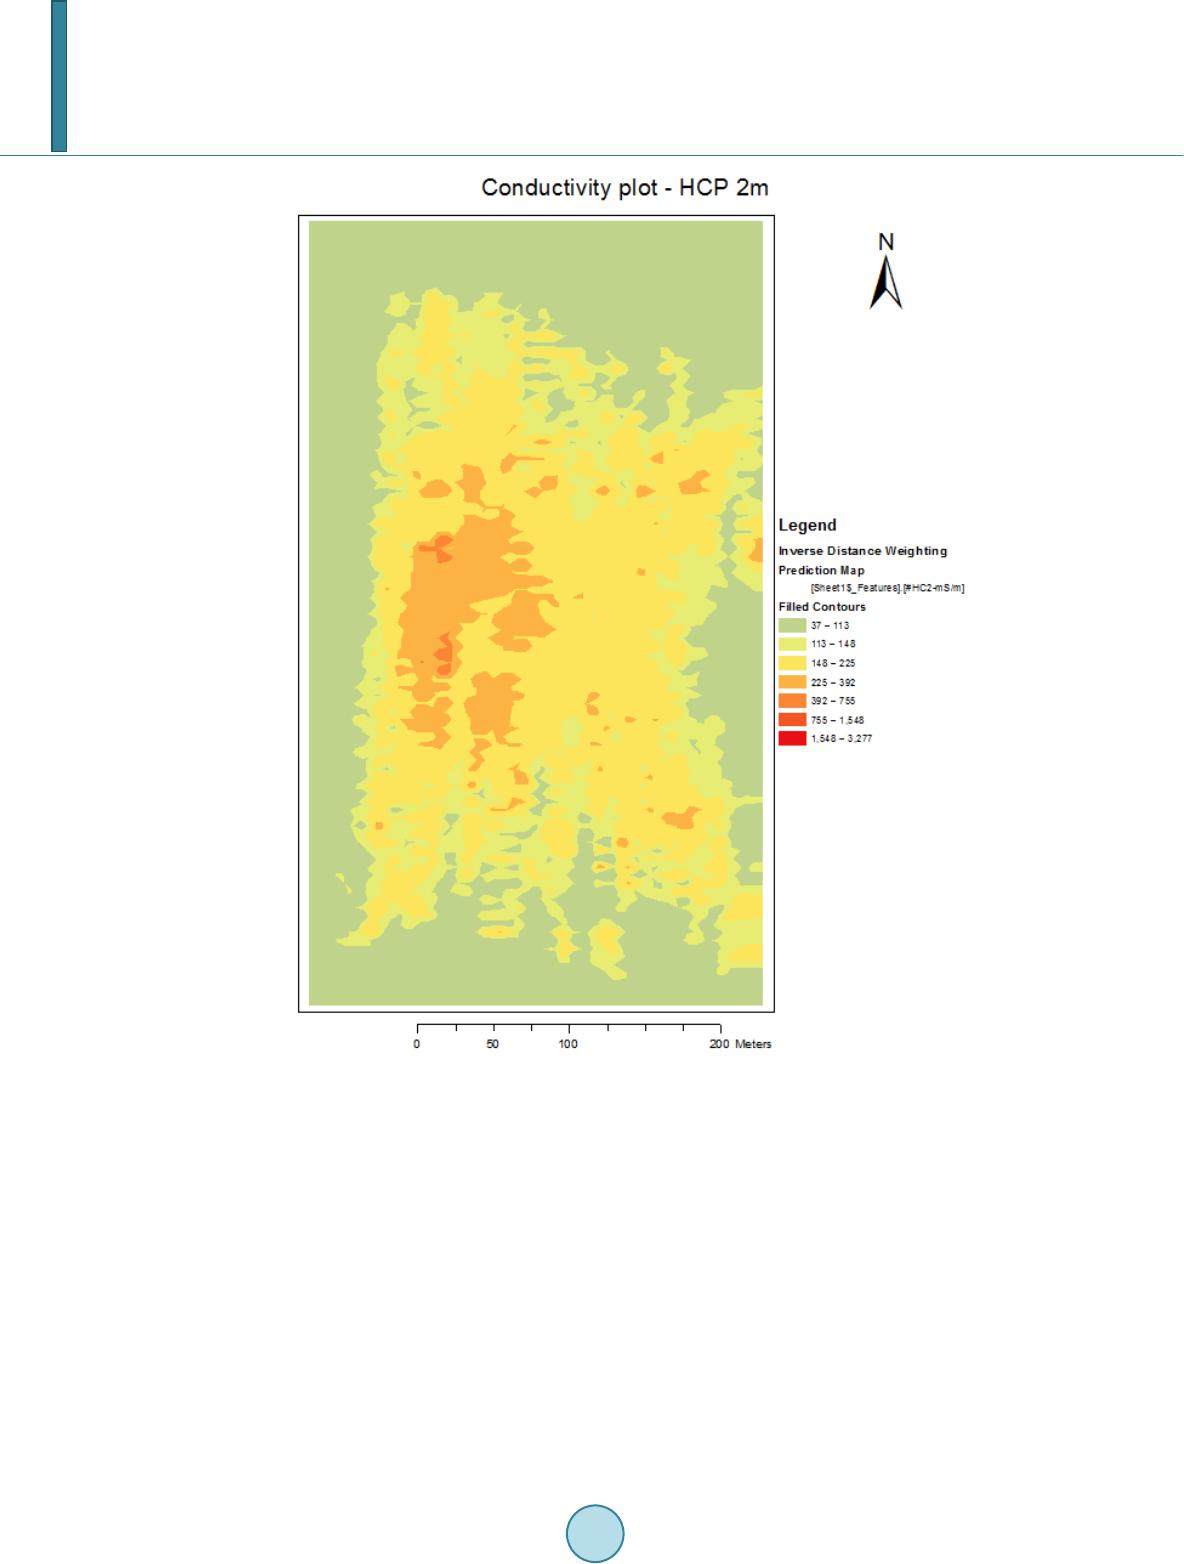 J. W. Yang, S. D. Joshi Figure 1. Conductivity map showing an anomalous zone for HCP-2 m configuration (mS/m). over the site. It can be seen that the western portion of the site has an anomalous conductive-zone covering an area of roughly 200 m (S-N) by 80 m (W-E) with majority of the conductivity values ranging between 225 - 392 mS/m. Two spots on the northern and southern portion of the anomalous zone show conductivity values ranging between 392 - 755 mS/m. A possible reason is that the buried waste in the eastern portion experiences more di- lutions as more groundwater tends to flow to the east due to the presence of the leachate collector system on the southeast. As a result the apparent terrain conductivity tends to decrease from west to east. Evidence from monitoring well 6 (eastern portion) and well 8 (western portion) agrees with the conductivity measurement. Figure 2 shows the areal apparent conductivity distribution when the transmitter-receiver distance increases to 4 m. It can be seen that with the increased penetration depth of 6 m, the bulk conductivities still have a higher value on the western side of the study site. The results obtained with the PRP configurations are very similar to those shown in F igure 1 and Figure 2, and therefore not included here. A DC resistivity instrument ABEM Terrameter SAS 4000 (ABEM, 2006) was next employed to assess the underground leachate distribution at the site. Eight profiles were set up in the south-north direction and three profiles in the west-east direction, each measuring 200m in length and covering the high-conductivity zone on  J. W. Yang, S. D. Joshi Figure 2. Conductivity map showing an anomalous zone for HCP-4 m configuration (mS/m). the western half of the study site, as identified from the terrain conductivity mapping. The Continuous Vertical Electric Sounding (CVES) configuration was employed to measure the subsurface resistivity. The CVES confi- guration is a combination of profiling and sounding surveys, where the electrodes are strategically placed on the ground depending on the type of array (ABEM, 2006). The electrode selector automatically selects two pairs of electrodes (two current and two potential electrodes) at each time and measures the apparent resistivity between them. The Wenner-α array with a unit electrode spacing of 5 m was adopted in this study, leading to a maximum penetration depth of 30 m. The DC resistivity readings taken in the field were processed and inversed by the software RES2DINV to produce the subsurface geo-electrical structure (RES2DINV manual, 2006). Figure 3 shows an interpreted subsurface geo-electrical structure in the south-north direction, exhibiting three localized low resistivity zones between horizontal distances of 40 - 200 m with a resistivity of 1.15 - 5.73 Ωm occurring at a depth of approximately 13.5 m. These low resistivity zones provide good evidence that the landfill leachate is distributed mainly within the shallow sand aquifer and that its migration is primarily in horizontal direction. There is no low resistivity zone close to the surface, which indicates that the clay cap is under a good condition wit h a consistent thickness. Also, there is no low resistivity zone close to the bottom, which indicates that the landfill leachate does not reach the lower aquifer via vertical migration. Figure 4 shows an interpreted subsur- 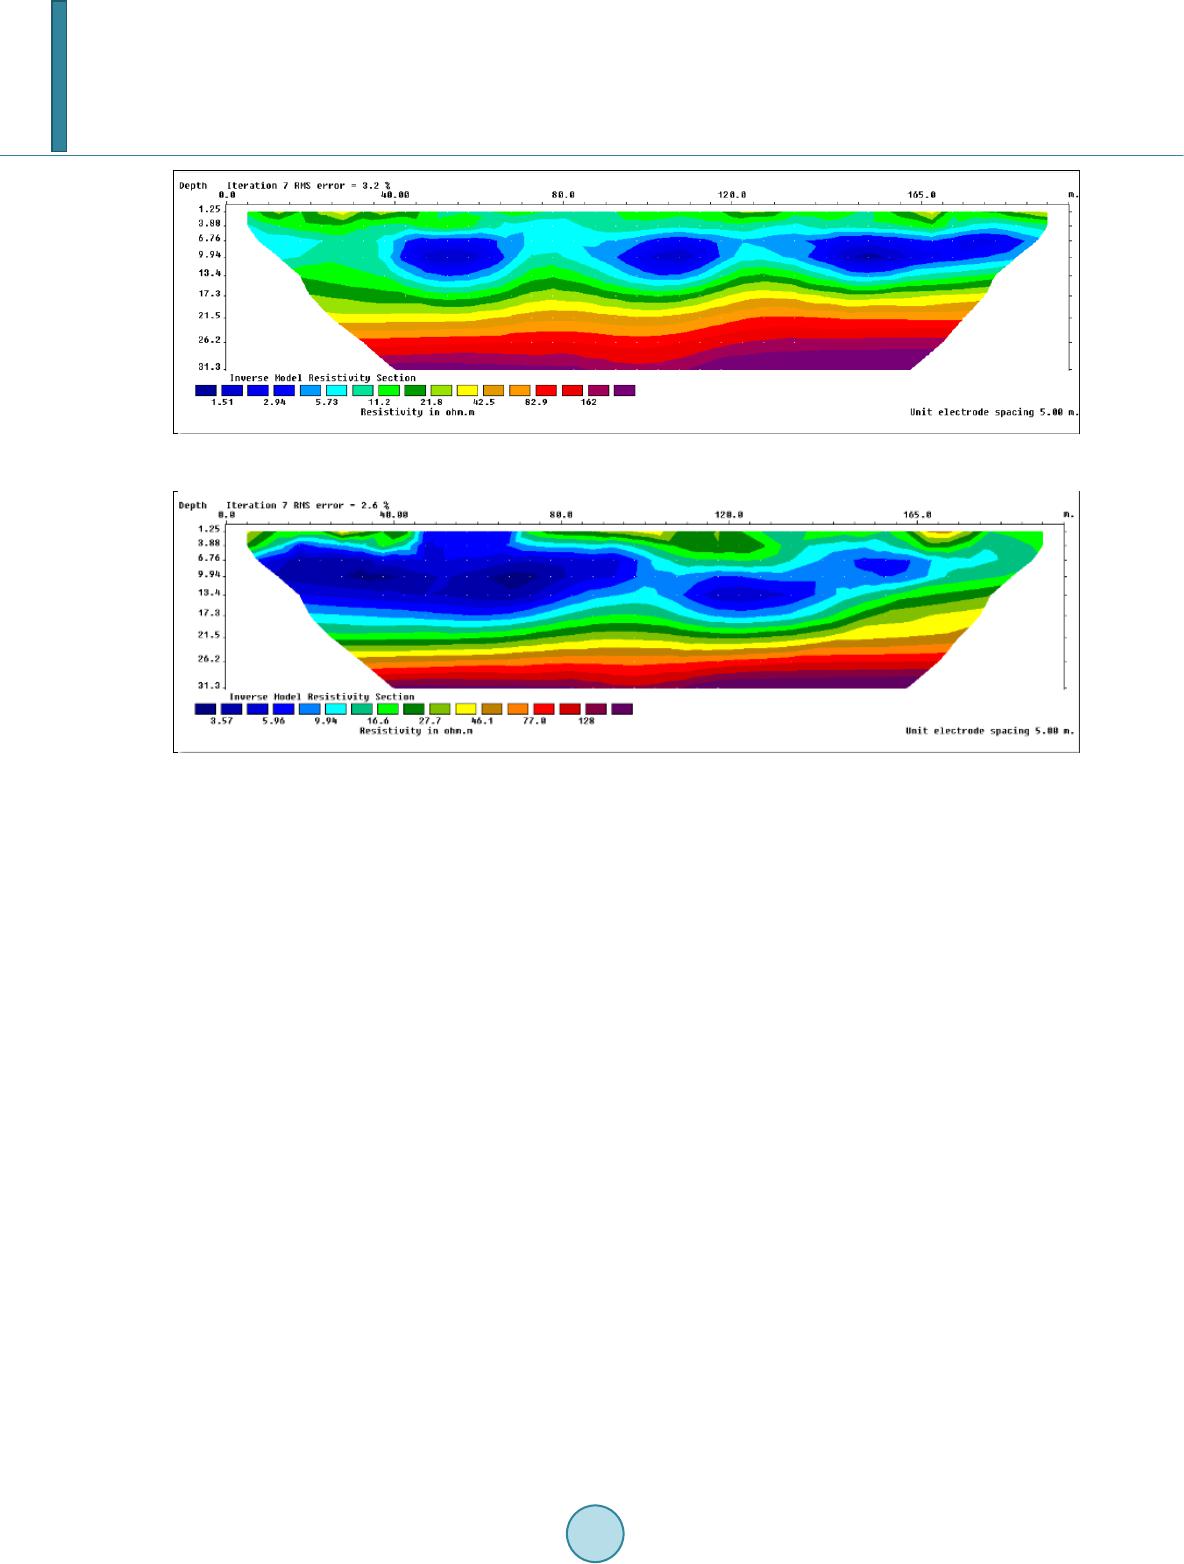 J. W. Yang, S. D. Joshi Figure 3. Representative interpreted subsurface geo-electrical structure in the south-north direction (resistivity in Ωm). Figure 4. Representative interpreted subsurface geo-electrical structure in the west-east direction (resistivity in Ωm). face geo-electrical structure in the west-east direction. A large low resistivity zone exists on the west side, ex- tending laterally 95 m and vertically 17 m to the silt/sand aquitard. This indicates that the landfill leachate is mainly in the upper sand aquifer, and also partially pollutes the silt/sand aquitard. However there is no evidence of the leachate reaching the lower sand aquifer as the resistivity gradually increases with depth. The area occu- pied by the contaminant plume decreases eastwards. This variation in resistivity agrees well with the conductiv- ity mapping results. The consistency of clay cap thickness is good for most of the profile except at horizontal distances between 45 - 70 m, where the contaminant plume from the waste appears to reach the surface. There is a localized high resistivity zone of 46.1 Ωm associated with the upper clay cap at horizontal distances between 165 - 180 m, which suggests a mixture of sand and gravel along with the clay cap material. 4. Hydrological Modeling The geophysical results were used to constrain and develop two hydrological models in the south-north and the wes t-east directions. For the sake of page limit, this paper only presents the W-E model along with the location of the upper and lower sand aquifers, the silt/sand aquitard and the clay cap, as illustrated in Figure 5. The hy- draulic conductivities and porosities assigned to each hydrological unit are given in Table 1. For groundwater flow, both the side boundaries are assigned to a constant hydraulic head constrained by their height, the lower boundary is assumed to be impermeable justified by the fact that the study area overlies the impermeable bed- rock, and the upper boundary is assigned an average annual precipitation of 1.864 × 10⁻⁸ m/s, that was calculated on the basis of the Kingsville Climatological Data. Initial fluid pressure increases linearly with depth. The con- taminant considered is mainly chloride ions (Cl−) due to its prevalence in leachate at the study site. The normal gradient of the contaminant mass concentration is set to be zero over all the four boundaries, except for the western edge of the upper boundary over which a mass concentration of 200 mg/L is assigned. The initial con- centration is assumed to be zero over the entire solution domain except for the upper western portion of the up- per aquifer in which it is 200 mg/L to represent the fact that the waste is mainly concentrated in the western por- tion of the study site, as identified in the geophysical surveys. A finite element software FEFLOW (Diersch, 2002) was employed to conduct the hydrological modeling of fluid flow and contaminant transport. Figures 6-8 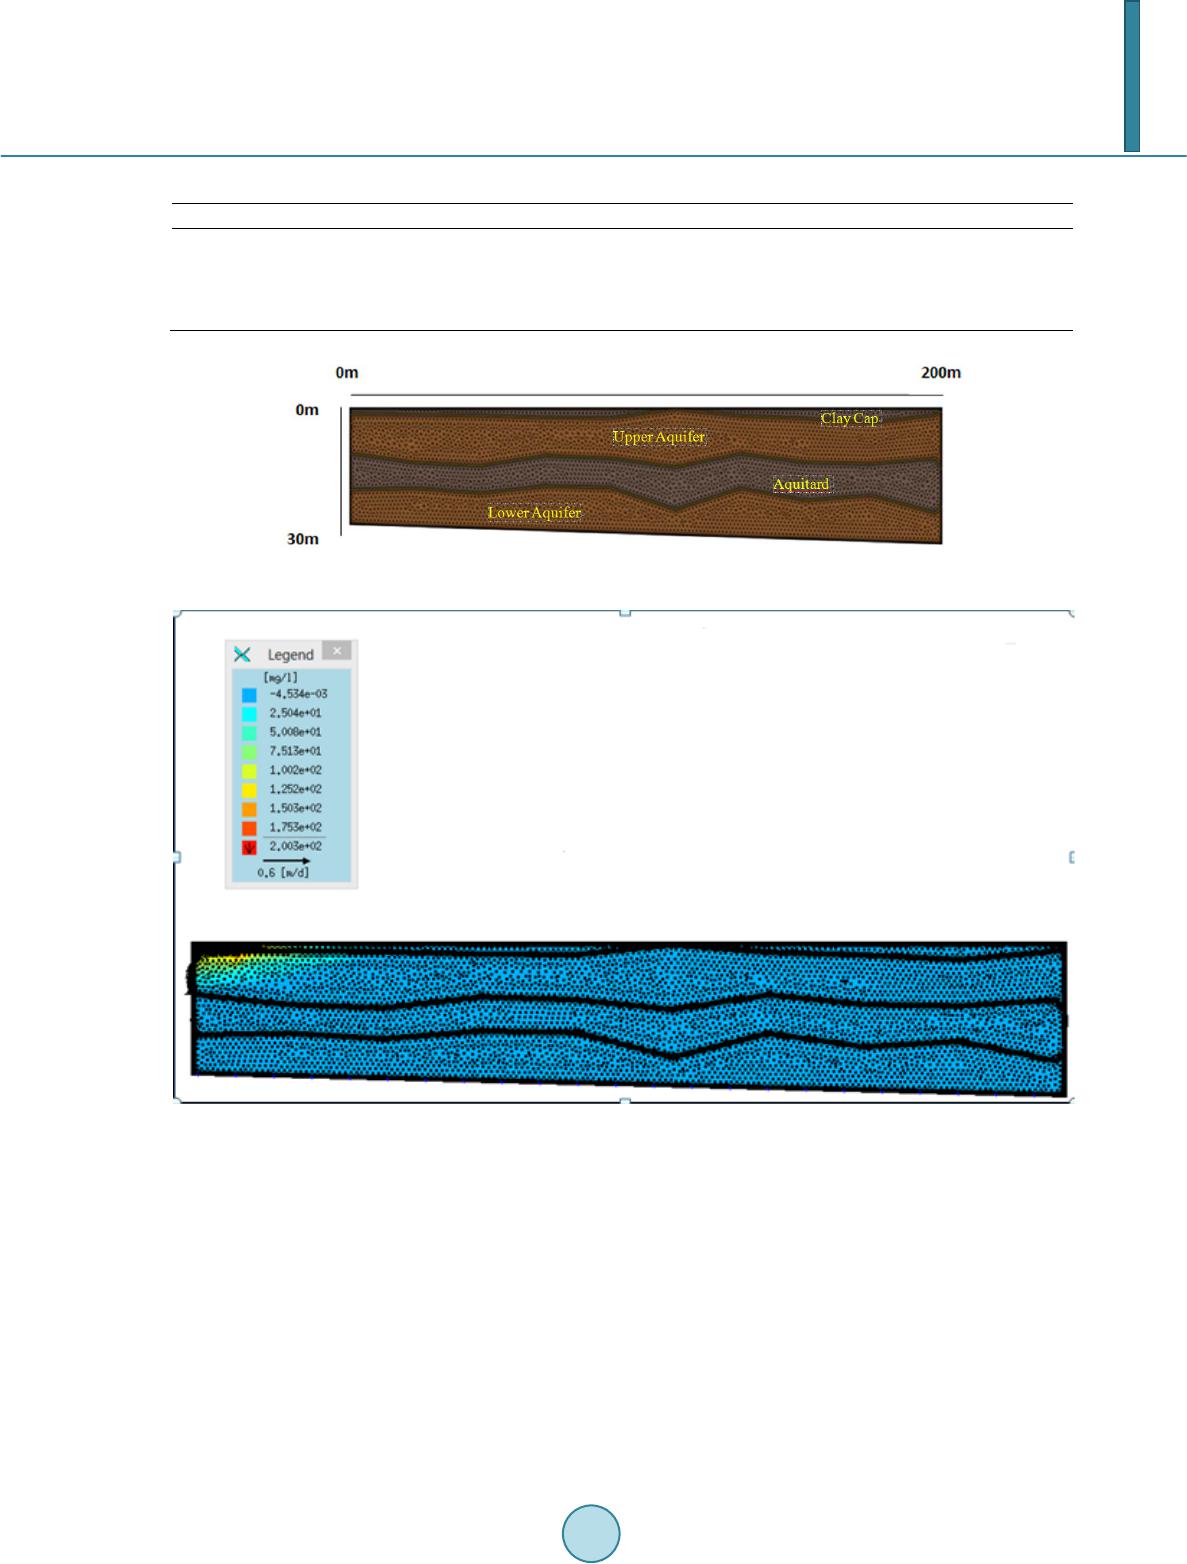 J. W. Yang, S. D. Joshi Table 1. Major physical parameters of the hydrological units. Hydraulic Conductivity (m/s) Clay cap 1.0 × 10 0.01 Upper aquifer 2.5 × 10⁻⁵ 0.3 Silt/sand aquitard 1.0 × 10⁻⁷ 0.05 Lower aquifer 2.5 × 10 0.3 Figure 5. Conceptual model showing the different layers in the west-east direction. Figure 6. Contaminant (Cl−) distribution at 10 years. illustrate the evolution of contaminant plume from 10 years, through 100 years, to1000 years. It can be seen that the contaminant transport occurs mainly in the upper aquifer, and the contaminant plume grows up as time goes. At 100 years (Figure 7), the plume has occupied about half of the upper sand aquifer and also entered into the western portion (0 - 10 m) of the silt/sand aquitard. At 1000 years (Figure 8), the contaminant plume has occu- pied the entire upper aquifer and most of the silt/sand aquitard, but the lower sand aquifer is still not polluted. The hydrological modeling in the south-north direction has revealed similar results (not included here). 5. Conclusions This study has delineated the areal and vertical distribution of landfill leachate at a closed landfill site using non-invasive geophysical methods and predicted the contaminant transport in the future using hydrological modeling. The EM conductivity mapping suggests that the western portion of the study site is electrically more  J. W. Yang, S. D. Joshi Figure 7. Contaminant (Cl−) distribution at 100 year s. Figure 8. Contaminant (Cl−) distribution at 100 years. conductive than the eastern portion, indicating a zone of accumulated leachate. The DC resistivity profiling on this highly polluted zone suggests that the waste is distributed mainly in the upper aquifer with most profiles showing strong evidence of horizontal migration towards the south (for the S-N profiles) and towards the east (for the W-E profiles). This flow direction agrees well with the natural groundwater flow regime in the upper aquifer at the site. There is no geophysical evidence that the contaminant has entered the lower sand aquifer. The geophysical results have been used to constrain and develop two groundwater models. The hydrological model- ing results predict that the contaminants will occupy the entire upper aquifer and most of the aquitard in a time  J. W. Yang, S. D. Joshi of 1000 years, but the lower aquifer will not be contaminated due to the protection of the less permeable sand/silt aquitard layer. Acknowledgements This research was sponsored by the Prog ram to Sponsor Teams for Innovation in the Construction of Talent Highlands in Guangxi Institutions of Higher Learning. Research was supported by the Natural Sciences and En- gineering Research Council of Canada (NSERC) through an Engage Grant (EGP 434656) to Jianwen Yang. Clayton Sereres and Radwan Tamr of GENIVAR Inc., Canada, are thanked for their contribution as the indus- trial partner of the NSERC-Engage Grant and also for their help in field work at the study site. References ABEM (2006). ABEM Terrameter SAS 1000/4000 Instructions Manual. Bernstone, C., & Dahlin, T. (1997). DC Resistivity Mapping of Old Landfills: Two Case Studies. European Journal of En- gineering and Environmental Geophysics, 2, 121-136. Diersch, H. J. G. (2002). FEFLOW Reference Manual, Wasy GmbH, Berlin. El-Fadel, M., Findikakis, A. N., & Leckie, J. O. (1997). Modeling Leachate Generation and Transport in Solid Waste Land- fills. Environmental Technology, 18, 669-686. http://dx.doi.org/10.1080/09593331808616586 EWSWA (2011). EWSWA Annual Monitoring Report. Geniva r, 1-22. Farquhar, G. J. (1989). Leachate: Production and Character izatio n. Canadian Journal of Civil Engineering, 16, 317-325. http://dx.doi.org/10.1139/l89-057 Freeze, R. A., Massmann, J., Smith, L., Sperling, T., & James, B. (1990). Hydrogeological Decision Analysis: A Framework, Groundwater, 28, 738-765. http://dx.doi.org/10.1111/j.1745-6584.19 9 0. tb0 19 89. x Joshi, S. D. (2013). Hydrogeophysical Investigation of Contaminant Distribution at a Closed Landfill in Southwestern On- tario, Canada. M.Sc. The si s , Windsor: University of Windsor. Kjeldsen, P., Barlaz, M. A., Rooker, A. P., Baun, A., Ledin, A., & Christensen, T. H. (2002). Present and Long-Term Com- position of MSW Landfill Leachate: A Review. Critical Reviews in Envir onmental Science and Technology, 32, 297-336. http://dx.doi.org/10.1080/10643380290813462 Loke, M. H. (1999). A Practical Guide to 2D and 3D Surveys. Electrical Imaging Surveys for Environmental and Engineer- ing Studies, 8-10. McNeill, J. D. (1980). Electromagnetic Terrain Conductivity Measurement at Low Induction Numbers. Geonics Ltd., Tech- nical Note TN -6. Osiensky, J. L. (1995). Time Series Electrical Potential Field Measurements for Early Detection of Groundwater Contamina- tion. Journal of Environmental Health, 30, 1601-1626. Radulescu, M., Valerian, C., & Yang, J. (2007). Time-Lapse Electrical Resistivity Anomalies Due to Contaminant Transport around Land Fills. Annals of Geophysics, 50, 453 -468. Reichard, E. G., & Evans, J. S. (1989). Assessing the Value of Hydrological Information for Risk-Based Remedial Action Decisions. Water Resources Research, 25, 1451-1460. http://dx.doi.org/10.1029/WR025i007p01451 RES2DINV Manual (2006). Geoelectrical Imaging 2D and 3D. Geotomo Software, 1-50. Scott, J., Beydoun, D., Amal, R., Low, G., & Cattle, J. (2005). Landfill Management, Leachate Generation and Leach Test- ing of Solid Wastes in Australia and Overseas. Critical Reviews in Environ mental Science and Technology, 35, 239-332. http://dx.doi.org/10.1080/10643380590917969 Taylor, R. S. (1999). Development and Applications of Geometric-Sounding Electromagnetic (G-SEM) Systems. Society of Exploration Geophysicists 1999 Technical Program Expanded Abstracts, Sixty-Ninth Annual Meeting. http://dx.doi.org/10.1190/1.1821076 Zhu, K., & Yang, J. (2008). Time-Dependent Magnetometric Resistivity Anomalies of Groundwater Contamination: Syn- thetic Results from Computational Hydro-Geophysical Modeling. Applied Geophysics, 5, 322-330. http://dx.doi.org/10.1007/s11770-008-0041-3 Zume, J. T., Tarhule, A., & Christenson, S. (2006). Subsurface Imaging of an Abandoned Solid Waste Landfill Site in Nor- man, Oklahoma. Groundwater Monitoring and Remediation, 26, 62-69. http://dx.doi.org/10.1111/j.1745-6592.2006.00066.x
|