Journal of Geographic Information System, 2011, 3, 166-172
doi:10.4236/jgis.2011.32014 Published Online April 2011 (http://www.SciRP.org/journal/jgis)
Copyright © 2011 SciRes. JGIS
GIS as Project Manager in Geophysical Applications
Software
Khalid Amin Khan1, Gulraiz Akhter2, Zulfiqar Ahmad2
1K-tron Research Inc., Rawalpindi, Pakistan
2Deptt. of Earth Sciences, Quaid-i-Azam University, Islamabad, Pakistan
E-mail: aminkhan@k-tron.net
Received January 12, 2011; revised January 24, 2011; accepted February, 9, 2011
Abstract
The changing trends in information technology have greatly influenced the role of GIS in spatial data man-
agement, analysis, processing and presentation. It has evolved from the conventional cartography and image
processing to advanced 3D visualization and dynamic graphics tools. Due to this evolving nature of GIS, it
has found wide applications in a number of diverse fields. Geophysical exploration projects involve data ac-
quisition at hundreds of spatial locations resulting in large number of datasets. It takes a great deal of time to
manage all these datasets during data processing and interpretation. This paper presents the use of GIS as an
effective project management tool, providing an interactive data access interface in compute intensive geo-
physical processing applications. A reusable GIS software component is presented which can be used by
geophysical applications to manage their datasets. A practical example is included to demonstrate the im-
plementation of this GIS component as an embedded Project Manager in a seismic refraction software.
Keywords: GIS, Project Manager, Interactive Interface, Database, Geophysics
1. Introduction
GIS is a graphical tool for providing access to geo-re-
ferenced data. It has been broadly classified into two
types: Raster based GIS and Vector based GIS. The for-
mer involves image processing techniques for handling
satellite imagery and remote sensing data, while the later
uses relational database management systems (RDBMS)
for storage of data along with geographic co-ordinates and
attributes which are translated into vector graphics for
GIS presentation. Current systems are based on merger
of the two types, where satellite imagery is overlaid by
multiple layers of vector graphics data.
GIS has been successfully used in a number of areas.
Some of the conventional uses include; geological map-
ping [1,2] environment [3], waste management [4], mete-
orology [5], defence, urban growth [6], traffic flow
analysis [7], health, planning, ecology and animal habitat
[8], agriculture, forestry [9], soil erosion [10], earthquak e
[11], hazard management [12], tunnel analysis [13],
digital elevation models [14,15], soil analysis [16],
minerals resources [17], geothermal resource exploration
[18], glaciology [19], hydrology and ground water ex-
ploitation [2 0-22].
In addition to the above applications there is an ex-
panding scope of GIS in new areas. This paper presents
the development of a GIS Project Manager software
component that can be used in geophysical applications
to manage project datasets. The concept has been dem-
onstrated through a practical example by implementing
GIS as an embedded Project Manager in a seismic re-
fraction software.
2. GIS Coupled with Processing Applications
With the advent of advanced graphics, large memory
systems and storage media technologies the role of GIS
has further widened. Attempts have been made to incor-
porate the emerging technologies with GIS and extend
their role and fun ctionality in different areas.
GIS being a general-purpose tool is used in a number
of fields each having specific processing requirements,
which are catered through separate processing software.
It is beyond the scope of GIS to incorporate processing
tools for all fields in which GIS is used. The solution to
this requirement is achieved by linking GIS with spe-
K. A. KHAN ET AL.167
cialized processing software through an inter-process
communication mechanism called Remote Procedure
Call (RPC) [23]. This link allows data collected at sp atial
locations and stored in GIS to be dynamically passed to
the processing application. The current study mainly
involves advancements in this direction; therefore it is
discussed in more detail.
It has been realized that a complete GIS solution
should have a GIS graphic front-end, RDBMS and re-
lated processing applications (PA) [24]. PA can be im-
plemented with GIS through the following two ap-
proaches [25] :
Loosely-coupled Approach: PA and the GIS are
executed independent from each other and are
linked through transfer of data. This link is estab-
lished through data formats between GIS and PA
[26].
Tightly-coupled Approach : Either PA must be built
within the GIS or the GIS functionality must be
built within the PA.
The selection of either of the above two approaches
depends on the complexity of geophysical PAs, volume
of data involved and required memory r esources , and the
degree of interaction desired between the GIS and PA.
3. GIS in Geophysical Applications
Geophysical investigations usually involve large vol-
umes of diverse data and compute intensive processing
algorithms. With the advent of 3D geophysical surveys
the data volume has further increased, resulting in large
number of datasets. Moreover, the processing of these
datasets also involves several supporting data types. In
case of seismic data processing, apart from seismic data,
there are geometry, navigation, statics, velocity and job
control datasets. Geophysical data is acquired at several
random or equidistant locations within the survey area.
Thus in a project there are several d ata acquisition points
each having more than one datasets. For a single project
there are hundreds of files and all of them must be loaded
into the system for processing. Furthermore various
processing stages may also generate several output data-
sets. Thus it becomes very difficult for the geophysical
analyst to maintain and manage all the datasets used in a
project. There is a need for a GIS based data manage-
ment technology, which keeps track of all the input and
output datasets along with their processing status and
provides and interactive interface to access these data-
sets.
GIS is commonly used in seismic interpretation soft-
ware to view the base map and get interactive access to
seismic sections, but such tools are not available for
other geophysical methods. Thus a general purpose GIS
Project Manger component is required which can be used
in seismic refraction, gravity, magnetic, resistivity and
other exploration related software. To implement a GIS
based Project Manager, the tightly-coupled approach has
been adopted. Within th is approach there are two options
for incorporating GIS functionality in PAs.
Extended Tool Boxes: PAs are invoked from
within the GIS as it’s extended tools.
Embedded GIS: Selected GIS functions are built in
the PA.
Geophysical problems are too complex and compute
intensive and therefore cannot be implemented as tool-
boxes within the GIS, thus the embedded GIS concept is
used to develop a component for geophysical applica-
tions.
4. GIS Project Manager Component
The required GIS Project Manager functionality h as been
implemented in the form of an AciveX [27] software
component that can be used by geophysical processing
applications. It is basically an object oriented reusable
component which provides a set of properties, methods
and events to customize, control and process data access.
It includes a prebuilt GIS and Project Explo rer which can
be customized, by setting component properties accord-
ing to the requirements of a geophysical application. It
generates and maintains the project database in Microsoft
Access format. The component methods and an event are
listed in Tab le 1 along with their functionality. They are
used by the geophysical application to manage and ac-
cess data. This component can be implemented in any
geophysical software developed in a programming lan-
guage which supports Component Object Model (COM)
[28].
The GIS Project Manager has three essential sub-com-
ponents: Project Database, GIS as the core technology,
and Project Explorer. The functionality of these compo-
nents is briefly discussed below, followed by detailed
working of t he component.
4.1. Project Database
The project database is basically a relational database
management system (RDBMS). It stores all user speci-
fied parameters, data processing job sequence, filenames
of all input and ou tput datasets involved in the proj ect as
well as navigation data files for lines coordinates. In ad-
dition it also maintains the processing status of each
dataset. The project database tables and their fields are
shown in Figure 1. The App D table is u sed for applica- I
Copyright © 2011 SciRes. JGIS
K. A. KHAN ET AL.
Copyright © 2011 SciRes. JGIS
168
Table 1. Methods and an Event Procedure of GIS Project Manager component along with their functionality.
Methods Function
SetAppInfo (AppName, AppVer)
GetAppInfo (AppName, AppVer) Set/Get Application identification information
SetGenInfo (InfoTag, InfoValue)
GetGenInfo (InfoTag, InfoValue) Set/Get General Information
AddNavData (LineType, NavFile)
DelNavData (NavFile) Add/Delete Navigation Data Files
AddGeoData (LineName, Picket, GeoType, GeoFile)
DelGeoData (LineName, Picket) Add/Delete Geoscientific Data Files at specified Line and Picket
SetProcessStatus (LineName, Picket, ProStatus)
GetProcessStatus (LineName, Picket, ProStatus) Set/Get Processing Status of Geoscientific Data at a Line Picket
SetViewStatus (LineName, Picket, ViewStatus) Set View Status to highlight Picket on the GIS and Project Explorer
SetSymbol(GeoType, Symbol) Set Picket Symbols for v arious Geoscientific Data Types
AddDataset (DatType, DatFile)
DelDataset (DatFile) Add/Delete any optional Data Files
SetPara (ParaTag, ParaValue)
GetPara (ParaTag, ParaValue) Set/Get any optional Processing Para meters
Event Procedure Function
GISPM_CallGeoData (LineName, Picket, GeoType,_
GeoFile, ProStatus, Button)
Event Triggered from GIS or Project Explorer to access Geophysical
Data and Call Application’s Data View Port
tion identification and the GenInfo table is used to store
tag based general project information. Any number of
unique tags names can be introduced to store and retrieve
information. The two main tables are; NavData for stor-
ing navigation data filenames and GeoData for storing
geophysical data filenames along with their line names,
picket numbers and processing status. Finally two op-
tional tables, Datasets and Parameters, are available for
storing any additional filenames and processing parame-
ters respectively. For a new project, this database is cre-
ated and updated by using the component methods for
assigning processing parameters and storing filenames of
all the project datasets, along with their respective data
types.
4.2. GIS Map
The GIS is a front-end component of Project Manager. It
displays a project map, showing the geographic location
of all datasets along with their processing status. The
datasets are presented on the GIS in the form of diff erent
graphic objects like box, rectangle, polygon, circle or
other symbols each representing a different geophysical
data type and their color indicates the current view status.
Similarly output datasets created after processing are also
Figure 1. Project database tables and their fields. These
tables are created and updated with information, parame-
ters and filenames using the component methods.
K. A. KHAN ET AL.169
indicated on the map. The GIS also provides an interac-
tive interface through which the graphics objects on the
GIS are hyperlinked to their associated datasets. Simply
clicking a graphics object provides access to its associ-
ated datasets which are loaded, processed and displayed
by their corresponding geophysical application. In this
way the GIS not only displays the sp atial d istribu tion and
processing status of data points in the project area, but
also provides a direct access to their associated datasets.
4.3. Project Explorer
Another front-end component of Project Manager is the
Project Explorer, which displays a well organized data
tree. It lists all project datasets under their respective data
types. All acquisition lines and their pickets at which
geophysical data is loaded are also given in the tree.
Similar to the GIS, it also provides a direct access to
each dataset listed in the tree.
4.4. Working Procedure
The functional diagram of GIS Project Manager compo-
nent is given in Figure 2. Project information, process-
ing parameters and datasets filenames are loaded into the
project database using the component methods. Similarly
Figure 2. The complete functional diagram of the GIS Project Manager component along with Project Database and
Application’s Data View Port.
Copyright © 2011 SciRes. JGIS
K. A. KHAN ET AL.
Copyright © 2011 SciRes. JGIS
170
the GIS display is customized by setting various proper-
ties. When a project database is opened, lines and pickets
information is retrieved from the related database tables
and displayed on the GIS and Project Explorer. Clicking
any picket on the GIS or Project Explorer retrieves the
associated geophysical datasets filenames from the table
and activates an event procedure returning the line name,
picket number, dataset filenames and their status as ar-
guments. This event procedure in turn is used to read the
geophysical datasets, by calling functions from related
I/O library, and display them into the geophysical appli-
cation’s view port. Thus the GIS and Project Explorer
provide a highly interactive access to the project datasets.
Once the opened data is processed, its status is stored
into the database, which in turn updates the GIS and
Project Explorer. Using this mechan ism multiple d atasets,
at various pickets, can be opened, displayed and proc-
essed. This component also keeps track of the datasets
being displayed or viewed and reflects this on the GIS
and Project Explorer. Thus it provides a three-way link
between the front-end interfaces; GIS, Project Explorer
and Geophysical Application ’s Data View Port. This link
has a one-to-one relationship between graphics objects
displayed on the GIS, datasets pickets listed in the Pro-
ject Explorer tree and their corresponding Data View
port. User actions or processing tasks causing changes in
any one interface directly result in changes in the other
two interfaces. Thus the GIS Project Manager provides a
Figure 3. (Top-Left) Base Map of seismic lines displayed by GIS. (Top-Right) Project Explorer showing a tree of various
Data Types and Data Objects (Seismic Lines) and their Refraction Pickets. Clicking a picket on the GIS Map or the
Project Explorer loads and pr oc esses the associated seismic data (Bottom).
K. A. KHAN ET AL.
Copyright © 2011 SciRes. JGIS
171
highly interactive and efficient mechanism to access,
view and process geophysical datasets in a large project.
5. Implementation Example
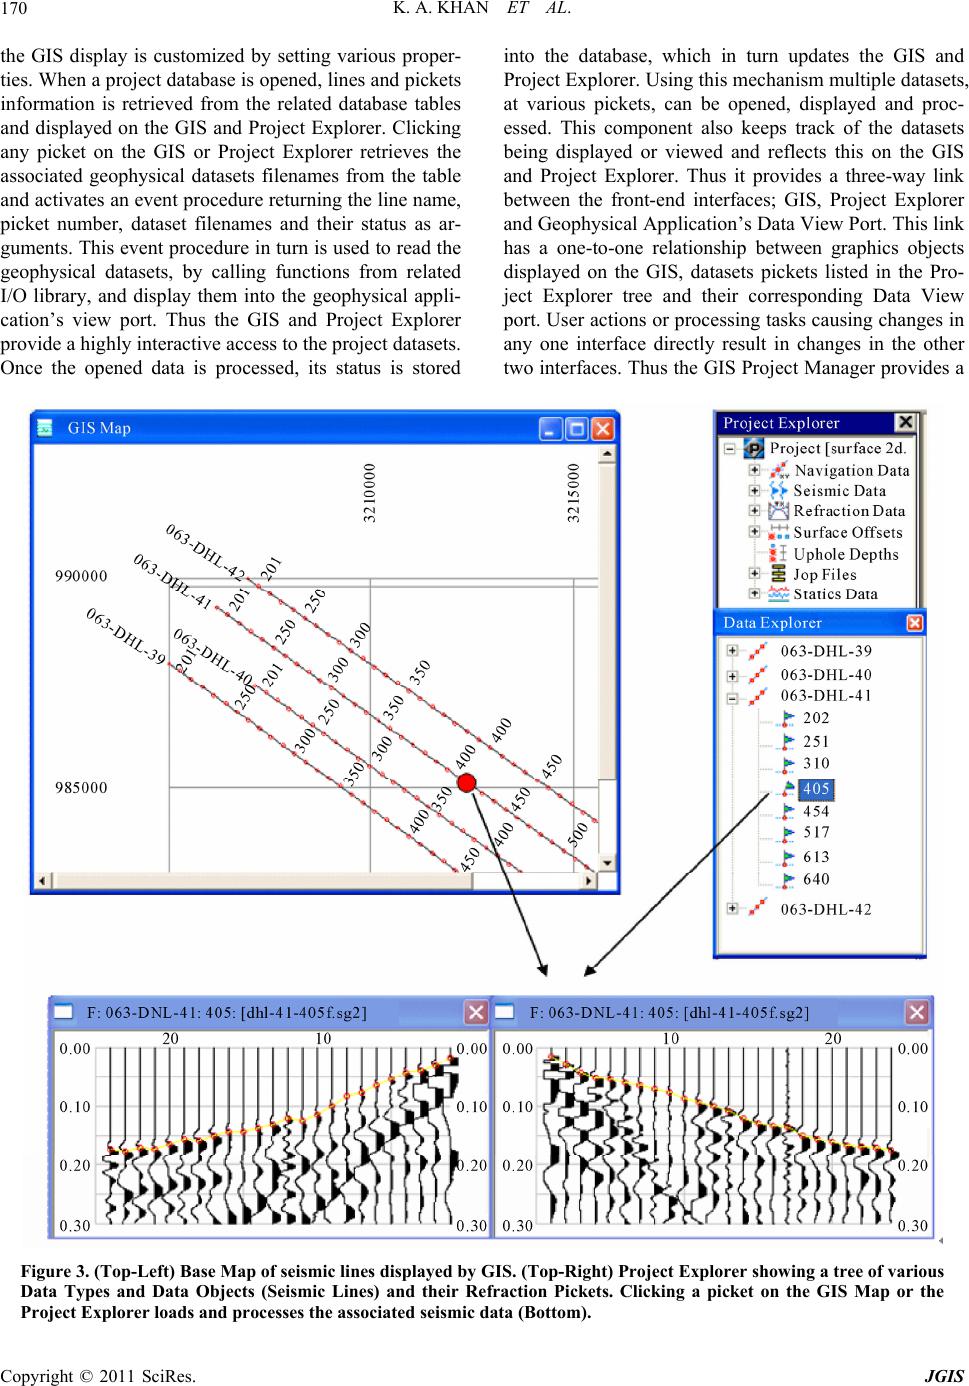
The GIS Project Manager component has been success-
fully implemented in a seismic refraction data processing
software, which is a three stage application for picking
arrival times, computing refractor model and finally cal-
culating statics. A new project is created and all project
datasets and processing parameters are defined into its
database. Using the GIS or Project Explorer any dataset
can be interactively opened and processed according to
the predefined job sequence (Figure 3). In this way the
Project Manager acts as an efficient data management
tool in handling large seismic exploration projects. An-
other advantage of the Project Manager is that once all
datasets have been defined in its database, there is no
need to load them over and over again. Whenever the
project data needs to be viewed or reprocessed, simply
loading the project database provides full access to all
defined datasets.
6. Conclusions
A GIS Project Manager component is presented which
can be used by geophysical software applications dealing
with seismic refraction, gravity, magnetic or electrical
resistivity data. It provides a user-friendly interface for
managing large geophysical exploration projects with
several datasets and processing tasks. Datasets are ac-
cessed directly from the GIS, without using the conven-
tional menus, thus saving a lot of user time. In addition
the geographic location, type and status of all datasets
involved in the project are directly shown on the GIS,
which provides a complete picture of the project in terms
of spatial distribution and processing status. The GIS
based Project Manager is an effective and efficient tool
for interactive and integrated data management of large
geophysical projects.
7. References
[1] S. Dey and P. Ghosh, 2008, “GRDM-A Digital Field-
Mapping Tool for Management and Analysis of Field
Geological Data,” Computers & Geosciences, Vol. 34,
No. 5, 2008, pp. 464-478.
doi:10.1016/j.cageo.2007.05.014
[2] S. P. Colman-Sadd, J. S. Ash and L. W. Nolan, “Geo-
Legend: A Database System for Managing Geological
Map Units in a Geographic Information System,” Com-
puters and Geosciences, Vol. 23, No. 7, 1997, pp.
715-724. doi:10.1016/S0098-3004(97)00069-1
[3] R. J. Viger, “The GIS Weasel: An Interface for the De-
velopment of Geographic Information Used in Environ-
mental Simulation Modeling,” Computers & Geosciences,
Vol. 34, No. 8, 2008, pp. 891-901.
doi:10.1016/j.cageo.2007.07.004
[4] R. S. Muttiah, B. A. Engel and D. D. Jones, “Waste Dis-
posal Site Selection Using GIS-Based Simulated Anneal-
ing,” Computers and Geosciences, Vol. 22, No. 9, 1996,
pp. 1014-1017.
[5] J. Massons, D. Domingo and J. Grau, “Automatic Classi-
fication of VIS-IR METEOSAT Images,” Computers and
Geosciences, Vol. 22, No. 10, 1996, pp. 1137-1146.
doi:10.1016/S0098-3004(96)00058-1
[6] W. Acevedo and P. Masuoka, “Time-Series Animation
Techniques for Visualizing Urban Growth,” Computers
and Geosciences, Vol. 23, No. 4, 1997, pp. 423-435.
doi:10.1016/S0098-3004(97)00006-X
[7] B. Jiang and C. Liu, “Street-Based Topological Repre-
sentations and Analyses for Predicting Traffic Flow in
GIS,” International Journal of Geographical Information
Systems, Vol. 23, No. 9, 2009, pp. 1119-1137.
[8] O. McNoleg, “The Integration of GIS, Remote Sensing,
Expert Systems and Adaptive Co-Kriging for Environ-
mental Habitat Modelling of Highland Haggis Using Ob-
ject-Oriented, Fuzzy Logic and Neural-Network Tech-
niques,” Computers and Geosciences, Vol. 22, No. 5,
1996, pp. 585- 588.
doi:10.1016/0098-3004(95)00131-X
[9] M. A. Wulder, “The Prediction of Leaf Area Index from
Forest Polygons Decomposed through the Integration of
Remote Sensing, GIS, UNIX, and C,” Computers and
Geosciences, Vol. 24, No. 2, 1998, pp. 151-157.
doi:10.1016/S0098-3004(97)00132-5
[10] D. K. Molnar and P. Y. Julien, “Estimation of Upload
Erosion Using GIS,” Computers and Geosciences, Vol.
24, No. 2, 1998, pp. 183-192.
doi:10.1016/S0098-3004(97)00100-3
[11] E. K. Louvari and A. A. Kiratzi, “RAKE: A Windows
Program to Plot Earthquake Focal Mechanisms and the
Orientation of Principal Stresses,” Computers and Geo-
sciences, Vol. 23, No. 8, 1997, pp. 851-857.
doi:10.1016/S0098-3004(97)00070-8
[12] C. Audisio, G. Nigrelli and G. Lollino, “A GIS Tool for
Historical Instability Processes Data Entry: An Approach
to Hazard Management in two Italian Alpine River Ba-
sins,” Computers and Geosciences, Vol. 35, No. 8, 2009,
pp. 1735-1747. doi:10.1016/j.cageo.2009.01.012
[13] Y. Choi, S. Y. Yoon and H. D. Park, “Tunnelling Analyst:
A 3D GIS Extension for Rock Mass Classification and
Fault Zone Analysis in Tunnelling,” Computers and Geo-
sciences, Vol. 35, No. 6, 2009, pp. 1322-1333.
doi:10.1016/j.cageo.2008.05.002
[14] A. K. Skidmore, “A Comparison of Techniques for Cal-
culating Gradient and Aspect from a Gridded Digital Ele-
vation Model,” International Journal of Geographical
Information Systems, Vol. 3, No. 4, 1989, pp. 323-344.
[15] S. Kienzle, “The effect of DEM Raster Resolution on
First Order, Second Order, and Compound Terrain De-
rivatives,” Transactions in GIS, Vol. 8, No. 1, 2004, pp.
K. A. KHAN ET AL.
172
83-111. doi:10.1111/j.1467-9671.2004.00169.x
[16] T. S. Farewell and D. M. Farewell, “Knowledge-based
Soil Attribute Mapping in GIS: Corrections and Exten-
sions to the Expector Method,” Transactions in GIS, Vol.
14, No. 2, 2010, pp. 183-192.
doi:10.1111/j.1467-9671.2010.01190.x
[17] W. Zhou, G. Chen, H. Li, H. Luo and S. L. Huang, “GIS
Application in Mineral Resource Analysis - A Case St udy
of Offshore Marine Placer Gold at Nome, Alaska,” Com-
puters & Geosciences, Vol. 33, No. 6, 2007, pp. 773-788.
doi:10.1016/j.cageo.2006.11.001
[18] Y. Noorollahi, R. Itoi, H. Fujii and T. Tanaka, “GIS
Model for Geothermal Resource Exploration in Akita and
Iwate Prefectures, Northern Japan,” Computers & Geo-
sciences, Vol. 33, No. 8, 2007, pp. 1008-1021.
doi:10.1016/j.cageo.2006.11.006
[19] C. Knoll, H. Kerschner, A. Heller and P. Rastner, “A
GIS-Based Reconstruction of Little Ice Age Glacier
Maximum Extents for South Tyrol, Italy,” Transactions
in GIS, Vol. 13, No. 5-6, 2009, pp. 449-463.
doi:10.1111/j.1467-9671.2009.01173.x
[20] Y. Abdella and K. Alfredsen, “A GIS Toolset for Auto-
mated Processing and Analysis of Radar Precipitation,”
Computers and Geosciences, Vol. 36, No. 4, 2010, pp.
422-429. doi:10.1016/j.cageo.2009.08.008
[21] W. H. Merkel, R. M. Kaushika and E. Gorman, “NRCS
GeoHydro—A GIS Interface for Hydrologic Modeling,”
Computers and Geosciences, Vol. 34, No. 8, 2008, pp.
918-930. doi:10.1016/j.cageo.2007.05.020
[22] I. Portoghese, V. Uricchio and M. Vurro, “A GIS Tool
for hydrogeological water balance evaluation on a re-
gional scale in semi-arid environments,” Computers &
Geosciences, Vol. 31, No. 1, 2005, pp. 15-27.
doi:10.1016/j.cageo.2004.09.001
[23] D. Cook, J. Symanzik, J. J. Majure and N. Cressie, “Dy-
namic Graphic in GIS: More Examples Using Linked
Software,” Computers and Geosciences, Vol. 23, No. 4,
1997, pp. 371-385. doi:10.1016/S0098-3004(97)00015-0
[24] K. A. Khan, “Integrated Geo Sy stems - A Computationa l
Environment for Integrated Management, Analysis and
Presentation of Petroleum Industry Data,” In: T. C.
Coburn and J. M. Yarus, Eds., Geographic Information
Systems in Petroleum Exploration and Development,
AAPG Book on Computers in Geology, No. 4, Chapter 16,
2000, pp. 215-226.
http://search.datapages.com/data/open/offer.do?target=%
2Fspecpubs%2Fca04%2Fchap16%2Fca04ch16.htm
[25] H. A. Karimi and B. J. Houston, “Evaluating Strategies
for Integrating Environmental Models with GIS: Current
Trends and Future Needs,” Computers; Environment and
Urban Systems, Vol. 20, No. 6, 1996, pp. 413-425.
doi:10.1016/S0198-9715(97)00006-9
[26] C. G. Wesseling, D. J. Karssenberg, B. A. Burgh and W.
P. A. Van Dearness, “Integrating Dynamic Environ-
mental Models in GIS: The Development of a Dynamic
Modelling Language,” Transactions in GIS, Vol. 1, No. 1,
1996, pp. 40-48.
doi:10.1111/j.1467-9671.1996.tb00032.x
[27] S. D. Palmer, “Vbscript 2 & Activex Programming:
Master the Art of Creating Interactive Web Pages,” 11
Edition, Coriolis Group Books, 1997, p. 8.
[28] D. Rogerson, “Inside COM,” Microsoft Press, Redmons,
WA, 1996, pp. 159-210.
Copyright © 2011 SciRes. JGIS