New Journal of Glass and Ceramics, 2011, 1, 13-19
doi:10.4236/njgc.2011.11003 Published Online April 2011 (http://www.SciRP.org/journal/njgc)
Copyright © 2011 SciRes. NJGC
13
Optimizing the Glass Fiber Cutting Process Using
the Taguchi Methods and Grey Relational Analysis
Chao-Lieh Yang
Department of Industrial Engineering and Management Information, Huafan University, New Taipei City, Chinese Taipei.
Email: ygcl@ms38.hinet.net
Received March 10th, 2011; revised March 21st, 2011; accepted April 6th, 2011.
ABSTRACT
This paper mainly describes a new approach to optimizing of the cutting glass fiber with multiple performance charac-
teristics, based on reliability analysis, Taguchi and Grey methods. During the cutting process, the speed, the volume
and the cutting load are optimized cutting parameters when the performance characteristics, which include Weibull
modulus and blade wear, are taken into consideration. In this paper, optimization with multiple performance charac-
teristics is found to be the highest cutting speed and the smallest cutting volume, and the medium cutting load. An
analysis of the variance of the blade wear indicates that the cutting speed (47.21%), the cutting volume (14.62%) and
the cutting load (12.20%) are the most significant parameters in the cutting process of glass fibers. In summary, the
most optimal cutting parameter should be A3B1C2. The results of experiments have shown that the multiple perform-
ance characteristics of cutting glass fiber are improved effectively through this approach.
Keywords: Blade Wear, Cutting, Glass Fiber, Grey Relational Analysis, Optimizing, Taguchi Methods
1. Introduction
Composite materials are playing an important role in a
wide range of fields and replacing many traditional en-
gineering materials. Glass fiber reinforced composite
materials are a class of materials used in various products
including aerospace, automobile, sporting goods, marine
bodies, plastic pipes, storage containers, etc. An et al. [1]
glass fiber reinforced plastic (GFRP) is characterized by
high strength and rigidity coupled with low weight and,
in many respects, is superior to metals. However, for the
practical cutting of glass fiber, optimal cutting parame-
ters should be taken into consideration to achieve less
blade wear, good cutting quality, etc. In order to achieve
this objective, how to control the blade wear correctly is
decisive.
During glass fiber cutting, the reduction of blade wear
is a critical aspect. Long glass fibers were found to affect
cutting quality significantly. Lau et al. [2] showed that
the wear characteristics of blades were highly influenced
by the geometry and thickness of the blade. Casto et al.
[3] discussed the lifetime according to different criteria,
determined by using a profilometer and image processing,
where the worn zone was observed using a scanning
electron microscope (SEM). A Weibull distribution has
been applied to a variety of cutting processes. Yang et al.
[4] concluded that the effect of the cutting conditions, the
cutting speed, the feed rate, and the depth of cut on the
tool life and the cumulative probability of chipping could
be presented as a Weibull distribution with three pa-
rameters. Lin [5] has observed that the cutting tool life
can be represented for the cases studied by the statistical
normal distribution. Moreover, Klim et al. [6] conducted
a two-parameter study on the effect of feed variation on
the tool wear and tool life, and found that this followed a
Weibull distribution.
The Taguchi method [7] has produced a unique and
powerful quality improvement discipline that differs
from the traditional process. Since the product and proc-
ess design have a great impact on the life cycle, the cost,
and the quality of a component, the Taguchi design of
experiment (DOE) approach provides a design engineer
with a systematic method for determining the optimum
design parameters to obtain the best performance at the
lowest cost. Therefore, the Taguchi methods have be-
come a widely acceptable methodology for improving
productivity. However, the original Taguchi methods
were designed to optimize a single performance charac-
teristic. It is not the kind of condition that engineers deal
Optimizing the Glass Fiber Cutting Process Using the Taguchi Methods and Grey Relational Analysis
14
with nowaday complex manufacturing process. There-
fore, optimization of multiple performance characteris-
tics is still interesting to researchers to do further study.
Kang and Hadfield [8] designed a novel eccentric lap-
ping machine, and in a systematic use of the Taguchi
methods, they investigated the optimization of different
lapping parameters. Lin [9] obtained optimal parameters
using the Taguchi methods and analysis of the Weibull
modulus through reliability engineering for the polishing
of ceramic gauge blocks.
The Grey system theory proposed by Huang and Liao
[10] has been proven to be useful for dealing with poor,
incomplete, and unsure information. Chang et al. [11]
presented a fast and effective methodology of Grey rela-
tional analysis for the optimization of the injection
molding process parameters of short glass fiber rein-
forced polycarbonate composites. Lin and Lin [12] found
the Grey relational analysis can be used to solve the elec-
trical discharge machining (EDM) process with the mul-
tiple performance characteristics. The Grey relational
analysis based on the Grey system theory by Deng [13]
can be used to solve complicated inter-relationships
among the multiple performance characteristics effec-
tively.
To optimize several responses or quality characteris-
tics simultaneously, many researchers have tried to com-
bine the Taguchi methods with other methods [14,15].
Through the Grey relational analysis, a Grey relational
grade is obtained to evaluate the multiple performance
characteristics. As a result, optimization of the compli-
cated multiple performance characteristics can be con-
verted into optimization of a single Grey relational grade.
Lin [14] has shown optimal cutting parameters can then
be determined by the Taguchi methods using the Grey
relational grade as the performance index. The cutting
parameters, the tool life, the cutting force, and the sur-
face roughness are important characteristics in turning.
Lin et al. [15] used reliability analysis, the Taguchi and
the Grey methods in this paper. The speed and the load
are optimized polishing parameters when the perform-
ance characteristics, which include Weibull modulus and
the removal rate, are taken into consideration.
In this paper, the reliability of the cutting process for
glass fiber materials has been evaluated quantitatively in
terms of a three-parameter Weibull distribution [4]. The
effect of the cutting parameters, i.e. the cutting speed, the
cutting volume, and the cutting load, on the blade wear,
as determined by long glass fiber that would exceed a
value of 1%, to meet the requirement of the customer
acceptance standard TP-700 of the Owens Corning
Company, was investigated. When using the Taguchi
methods of parameter design, the experimental details
were used for optimizing the single performance charac-
teristics. Optimization of multiple performance charac-
teristics with the Grey relational analysis was also con-
sidered in this paper. The methodology used in the ex-
periments was the same as that used by Lin [9], and was
as the following:
1) Perform a Taguchi-based experiment.
2) Measure the material wear from 12 cuts by a cutter
blade.
3) Calculate the Weibull modulus and the mean value
of the wear.
4) Calculate the signal-to-noise (S/N) ratio.
5) Collect the data while preprocessing both the mean
value of the wear and the Weibull modulus.
6) Perform an analysis of variance (ANOVA) using
the Grey relational analysis.
7) Carry out the confirmation runs.
2. Reliability Analysis
The reliability, determined from a three-parameter Weibull
distribution, was expressed by Shigley et al. [16] as:


00
exp b
Rxxsxx
0
x
  (1)
In it:
x is the thin-edge blade wear (m);
x0 is the guaranteed value of y (x0 0);
s is a characteristic or scale value (s x0);
b is the Weibull modulus (b 0).
The Weibull modulus is the most important parameter
in a Weibull distribution. The increases of reliability de-
pend on the increase of the Weibull modulus. The prob-
ability of a failure, 1
F
R
, can be calculated as indi-
cated by Shaw [17] according to:
0.3 0.4Fg h (2)
In which:
g is the gth sample as the blade wear values are ranked
in order;
h is the total number of samples.
The detail for the relationship between the reliability
and the wear rate has been derived by Yang et al. [4]. So,
the guaranteed value x0 can be written as


3221
02
321
2
x
xxx
xx xxx

  (3)
The characteristic parameter s can be written as
0
ln 0
s
invx xx
 (4)
The Weibull modulus b can be written as
bYx
 (5)
3. Experiments
The identified parameters that affect the characteristics of
Copyright © 2011 SciRes. NJGC
Optimizing the Glass Fiber Cutting Process Using the Taguchi Methods and Grey Relational Analysis15
turned parts are the cutting blade parameters (blade ge-
ometry and blade material), the workpiece-related pa-
rameters (long fiber), the cutting parameters (speed, load,
and volume), and the environmental parameters (dry cut-
ting and wet cutting). The ranges of the selected cutting
process parameters (cutting speed V = 1.9 - 5.7 m/s, load
F = 13 - 27 kgf/cm2, and volume150 - 250 piece) are as-
certained by conducting preliminary experiments. The
details of the work material, the cutting machine, the
cutting blade, and the cutting conditions are as the fol-
lowing:
The work material: E-glass fiber, 9 m 66 (g / 1000
m).
The cutting machine: Parallel blade-cutting machine
(Finn and Fram, USA) with a 0.75 HP spindle power.
The cutting blade: Lutz cutter (Lutz, Germany) made
of high-carbon steel disposable blades
The cutting condition: Dry
The wear measure: Examined by using a SEM to
measure blade wear.
Glass fiber that were 9 m in diameter and 66 (g /
1000 m) in weight and machined on a cutting machine
with a carbon steel blade. The blade wear were measured
by a SEM while each specimen was cut. The cutting
blade samples were examined by a SEM to measure
blade wear values at three points, and these were aver-
aged to obtain an average blade wear value. Each cutting
test of a blade wear was performed until the long glass
fiber weight exceeded a value of 1%, as specified in the
customer acceptance standard TP-700 of the Owens
Corning Company.
4. The Single Performance Characteristic
4.1. The Taguchi Methods
An orthogonal array gives a more reliable estimate of the
factor effects with fewer tests compared to traditional
methods. In this paper, based on the experiments de-
signed by Kang and Hadfield [8], three levels of cutting
parameters were selected and the three cutting parame-
ters were used as control parameters, and each parameter
was designed to have three levels, as shown in Table 1.
Three major control factors (cutting speed, load, and
volume) were selected to conduct the tests. All three fac-
tors are multilevel variables and their outcome effects
have nonlinear relationships; hence, we used three-level
tests for each factor. The number of degrees of freedom
was calculated from the number of parameters identified
and their number of levels of variation. Using the full
factorial design (3 × 3 × 3 × 3) reduced a total of 81 sets
of experiments down to 9, thereby decreasing the cost,
the time, and the effort. 9 the array along with the factors
assigned to the columns was presented in Tabl e 2 , which
consists of nine experiments corresponding to the nine
rows and four columns. In this matrix, the chosen three
parameters, the cutting speed, the cutting volume and the
cutting load are assigned to the second, the third and the
fifth columns. The fourth column was not assigned and
used as an error term e. The nine experiments of the L9
array were carried out without the interaction effect.
4.2. Analysis of S/N ratio for the
Smaller-the-Better Parameter
The Taguchi methods use the S/N ratio to analyze the
average value of the test run data to derive values for
evaluating the characteristic cutting parameters. This is
because the S/N ratio represents both the average and the
variation in quality characteristics. The units of the S/N
ratio are decimals. The Taguchi parameter design is used
to determine the optimum conditions of the engineering
parameters (the controllable parameters), and also to
minimize any variation in the noise (the uncontrollable
parameters). The S/N ratio provides a measure of the
robustness. To find the optimal cutting conditions, the
blade wear should be of lower order; hence, the S/N for
“the smaller the better” type of response is used:
2
10log 1
STB i
SNn y

(6)
Table 1. Cutting parameters and levels.
SymbolParameter Unit Level 1 Level 2Level 3
A Cutting speed m/s 1.9 3.8 5.7
B Cutting volumepiece 150 200 250
C Cutting load Kgf/cm2 27 20 13
Table 2. The L9 (34) orthogonal array used in Taguchi
methods.
Group A B e C
1 1 1 1 1
2 1 2 2 2
3 1 3 3 3
4 2 1 2 3
5 2 2 3 1
6 2 3 1 2
7 3 1 3 2
8 3 2 1 3
9 3 3 2 1
Copyright © 2011 SciRes. NJGC
Optimizing the Glass Fiber Cutting Process Using the Taguchi Methods and Grey Relational Analysis
16
where yi is the mean value of the wear or Weibull
modulus at the ith test and n is the number of trials. S/NSTB
is the smaller-the-better S/N ratio.
To understand the blade wear during cutting, an ex-
periment using S55C high-carbon steel blades to cut the
glass fiber was carried out as shown in the schematic
diagram in Figure 1. In a single experiment, 12 cutting
blades were used to cut simultaneously. Table 3 shows
the mean value of the wear and the corresponding S/N
ratio calculated by using Equation (6). Table 4 shows the
Weibull modulus and the corresponding S/N ratio calcu-
lated by using Equation (6).
Figure 1. Schematic of cutting machine.
Table 3. Experimental results for the mean value of the
wear and the S/N ratio.
Group Mean value of wear (μm) S/N ratio (dB)
1 49.29 –33.93
2 40.03 –32.24
3 39.58 –32.04
4 63.05 36.05
5 59.01 –35.46
6 55.21 –34.93
7 39.78 –32.06
8 64.39 –36.22
9 48.17 –33.79
Table 4. Experimental results for the Weibull modulus and
the S/N ratio.
Group Weibull modulus S/N ratio (dB)
1 2.07 –6.32
2 8.65 –18.74
3 3.69 –11.34
4 6.75 –16.59
5 3.34 –10.47
6 6.04 –15.62
7 1.85 –5.34
8 4.27 –12.61
9 1.89 –5.53
5. Multiple Per f ormance Characteristics
5.1. Grey Relational Analysis
In the Grey relational analysis, a data preprocessing is
first performed in order to normalize the raw data, and a
linear normalization of the experimental results for the
mean value of the wear and the Weibull modulus is per-
formed in the range between zero and one, which is also
called the Grey relational generating [13,18].
For the blade wear and weibull modulus, which are
“the smaller the better”, the normalized S/N ratio zij for
the i
th performance characteristic in the jth can be ex-
pressed as
max
max min
ij ij
ij
ij ij
j
j
yy
z
y
(7)
yij for the ith experimental results in the jth experiment.
Next, the Grey relational coefficient is calculated to
express the relationship between the ideal (best) and the
actual normalized S/N ratio. The Grey relational coeffi-
cient αij for the ith performance characteristic in the jth
experiment can be expressed as
00
00
minmin maxmax
maxmax
ij ij
ij ij
ii
ij ij
ij
ii
ij
zz zz
zz zz
 
 (8)
where is the ideal normalized S/N ratio for the ith
performance characteristics and β distinguishing coeffi-
cient which is setting as 0.5 in this article.
0
i
z
Then, the Grey relational grade is computed by aver-
aging the Grey relational coefficient corresponding to
each performance characteristic. The overall evaluation
of the multiple performance characteristics is based on
the Grey relational grade, that is
1
1k
ij
j
i
k
(9)
In it:
γj is the Grey relational grade for the jth experiment;
k is the number of performance characteristics.
Table 5 shows the dada calculated by using Equation
(7), the normalized results for the mean value of the
blade wear and the Weibull modulus. Basically, the lar-
ger normalized results correspond to the better perform-
ance and the best normalized results should be equal to
one. The grey relational coefficient results for the ex-
perimental layout are shown in Table 6.
Using the experimental combinations of Table 2, Ta-
ble 7 shows the Grey relational grade for each experi-
ment. The larger Grey relational grade indicates that the
corresponding experimental result is closer to the ideally
normalized value. Group 7 has the best multiple per-
formance characteristics among the nine experiments
Copyright © 2011 SciRes. NJGC
Optimizing the Glass Fiber Cutting Process Using the Taguchi Methods and Grey Relational Analysis17
because it has the highest Grey relational grade shown in
Table 7. Since the experimental design is orthogonal, it
is then possible to separate out the effect of each cutting
parameter in different levels.
Figure 2 shows the Grey relational grade graph, where
the dashed line in this figure is the value of the total
mean of the Grey relational grade. Basically, the larger
the Grey relational grade is, the better the multiple per-
formance characteristics are. A3B1C2 is the optimal
level of cutting parameters with the multiple performance
characteristics.
Table 5. Data preprocessing of experimental result for each
performance characteristic.
Group Mean value of wear (μm) Weibull modulus
1 0.4504 0.0729
2 0.0466 1.0000
3 0.0000 0.4476
4 0.9583 0.8392
5 0.8192 0.3830
6 0.6921 0.7671
7 0.0032 0.0000
8 1.0000 0.5423
9 0.4183 0.0139
Table 6. Grey relational coefficient of each performance
characteristic.
Group Mean value of wear (μm) Weibull modulus
1 0.5261 0.8728
2 0.9147 0.3333
3 1.0000 0.5276
4 0.3429 0.3734
5 0.3790 0.5662
6 0.4194 0.3946
7 0.9936 1.0000
8 0.3333 0.4797
9 0.5445 0.9730
Table 7. Grey relational grade for each experiment.
Group Grey relational grade Order
1 0.6994 4
2 0.6240 5
3 0.7638 2
4 0.3581 9
5 0.4726 6
6 0.4070 7
7 0.9968 1
8 0.4065 8
9 0.7588 3
Figure 2. Grey relational grade graph.
5.2. Analysis of Variance
The ANOVA scheme was used to study the significance
of the parameters affecting the quality characteristics of
the interest. The scheme subdivides the total variation in
the data into useful and meaningful components of varia-
tion. The total variation contribution is shown in Table 8.
The ANOVA results in Table 8 clearly identify that the
cutting speed and the volume severely affected the blade
wear by 47.21% and 14.62%, respectively, while the load
only affected the blade wear by 12.20%.
5.3. Confirmation Tests
A confirmation experiment is the final step in the design
of experiment process. Once the optimum level of the
design parameters is set, the final step can predict and
verify the quality characteristic using the optimum level
opt of the design parameters, which can also be esti-
mated by using the equation
0
1
opt i
j


(10)
In which:
is the mean of the S/N ratio;
j is the S/N ratio at the optimum level;
o is the number of main design parameters that affects
the optimum level of the cutting parameters.
From Equation (10), the estimated optimum design
parameters can be obtained by using the optimum cutting
parameters.
A pareto chart generated based on the contribution ra-
tio is presented in Figure 3. This chart shows the impor-
tance of the significant parameters. Table 9 shows a
comparison among the initial, predicted, and confirma-
tion experimental values of the wear, respectively, using
the optimum cutting parameters. Table 9 shows the re-
sults of the confirmation experiment for the mean value
of the wear. The results of the confirmation experiment
of the predicted optimal conditions A3B1C2, which was
better than the initial trial. As shown in Table 9, the
blade wear decreases from 64.73 to 39.43, when the
Copyright © 2011 SciRes. NJGC
Optimizing the Glass Fiber Cutting Process Using the Taguchi Methods and Grey Relational Analysis
Copyright © 2011 SciRes. NJGC
18
Table 8. Results of analysis of variance for multiple performance characteristic.
Symbol Cutting parameter Sum of square Degree of freedom Contribution (%)
A Cutting speed 0.18 2 47.21
B Cutting volume 0.06 2 14.62
C Cutting load 0.05 2 12.20
Error 0.09 2 25.97
Total 0.37 8 100.00
Figure 3. Pareto chart.
Table 9. Results of the confirmation experiment.
Cutting parameter Initial Predicted Confirmation experiment
Level A2B2C2 A3B1C2 A3B1C2
Wear (μm) 64.73 - 39.43
Weibull modulus 1.90 - 1.85
Grey relational grade 0.4498 0.9332 0.9968
Improvement of grey relational grade - - 0.5470
Improvement in wear (%) - - 64.16
Weibull modulus is decreased from 1.9 to 1.85. In sum-
mary, the most optimal cutting parameter should be
A3B1C2, because the improvement is the greatest by
using this parameter, and it is obvious that the optimum
level of the cutting parameters in the cutting process is
greatly improved.
Conducting a verification experiment is a crucial and
the last step of the robust design procedure. Its aim is to
verify the optimum conditions identified by the matrix
tests and it estimates how close the predictions are to
actual conditions. Hence, a confirmation test was con-
ducted with the optimum parameters, and came out in
good result.
6. Conclusions
This paper has carried out the optimization in the cutting
of glass fiber. The following conclusions are obtained
from analyzing the above stated experimental results:
Optimizing the Glass Fiber Cutting Process Using the Taguchi Methods and Grey Relational Analysis19
1) The multiple parameters for multiple performance
characteristics are found to be the higest speed, the
smaller cutting volume and the medium load.
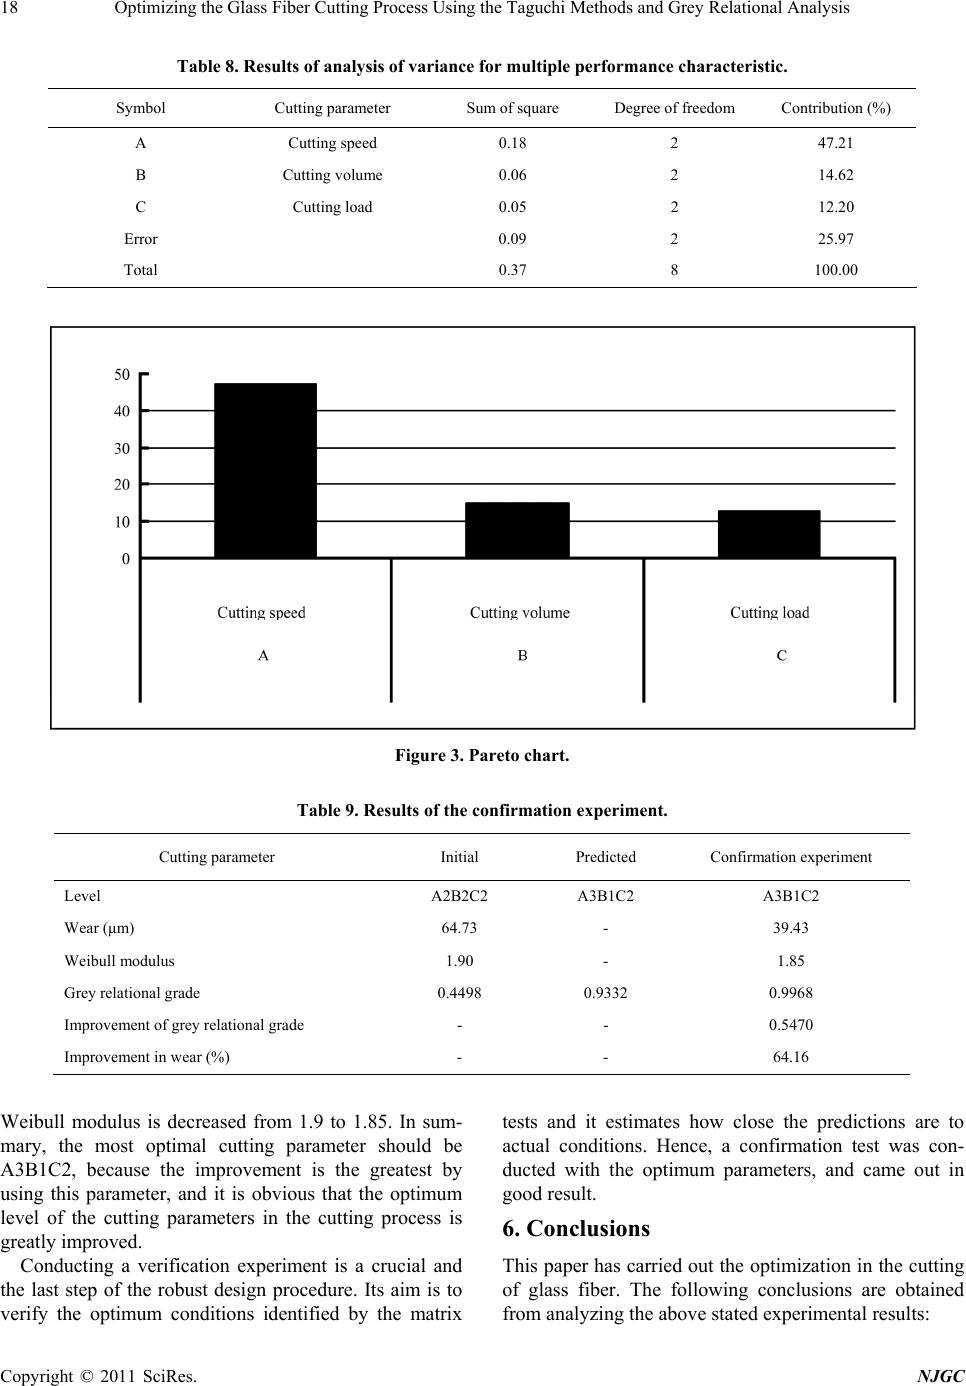
2) To study further within the experimental range used,
we found that the most significant cutting parameter for
multiple performance characteristics are the cutting
speed, which accounts for 47.21% of the total effect,
followed by the cutting volume (14.62%), and the cutting
load, which accounts for only 12.20% of the total effect.
3) In summary, the most optimal cutting parameter is
A3B1C2.
4) In the cutting glass fiber, using reliability analysis
with Grey-based Taguchi methods is a good way to im-
prove the multiple performance characteristics.
REFERENCES
[1] S. O. An, E. S. Lee and S. L. Noh, “A Study on the Cut-
ting Characteristics of Glass Fiber Reinforced Plastics
with Respect to Tool Materials and Geometries,” Journal
of Materials Processing Technology, Vol. 68, No. 1, 1997,
pp. 60-67. doi:10.1016/S0924-0136(96)02534-4
[2] K. H. Lau, D. Mei, C. F. Yeung and H. C. Man, “Wear
Characteristics and Mechanisms of a Thin Edge Cutting
Blade, “Journal of Materials Processing Technology, Vol.
102, No. 1-3, 2000, pp. 203-207.
doi:10.1016/S0924-0136(99)00410-0
[3] S. L. Casto, E. L. Valvo, E. Lucchini, S. Maschio and V.
F. Ruisi, “Wear Rates and Wear Mechanisms of Alu-
mina-Based Tools Cutting Steel at a Low Cutting Speed,”
Wear, Vol. 208, No. 1-2, 1997, pp. 67-72.
doi:10.1016/S0043-1648(96)07376-0
[4] C. L. Yang, S. H. Sheu and K.T. Yu, “The Reliability
Analysis of a Thin-Edge Blade Wear in the Glass Fiber
Cutting Process,” Journal of Materials Processing Tech-
nology, Vol. 209, No. 4, 2009, pp. 1789-1795.
doi:10.1016/j.jmatprotec.2008.04.028
[5] W. S. Lin, “The Reliability Analysis of Cutting Tools in
the HSM Processes,” Archives of Materials Science and
Engineering, Vol. 30, No. 2, 2008, pp. 97-100.
[6] Z. Klim, E. Ennajimi, M. Balazinski and C. Fortin, “Cut-
ting Tool Reliability Analysis for Variable Feed Milling
of 17-4PH Stainless Steel,” Wear, Vol. 195, No. 1-2,
1996, pp. 206-213. doi:10.1016/0043-1648(95)06863-5
[7] P. J. Ross, “Taguchi Techniques for Quality Engineer-
ing,” McGraw-Hill Book Company Press, New York,
1996.
[8] J. Kang and M. Hadfield, “Parameter Optimization by
Taguchi Methods for Finishing Advanced Ceramic Balls
Using a Novel Eccentric Lapping Machine,” Proceedings
of the Institution of Mechanical Engineers, Part B: Jour-
nal of Engineering Manufacture, Vol. 215, No. 1, 2001,
pp. 69-78. doi:10.1243/0954405011515145
[9] T. R. Lin, “The Use of Reliability in the Taguchi Method
for the Optimization of the Polishing Ceramic Gauge
Block,” The International Journal of Advanced Manu-
facturing Technology, Vol. 22, No. 3-4, 2003, pp.
237-242. doi:10.1007/s00170-002-1465-1
[10] J. T. Huang and Y. S. Liao, “Optimization of Machining
Parameters of Wire-EDM Based on Grey Relational and
Statistical Analyses,” International Journal of Production
Research, Vol. 41, No. 8, 2003, pp. 1707-1720.
doi:10.1080/1352816031000074973
[11] S. H. Chang, J. R. Hwang and J. L. Doong, “Optimization
of the Injection Molding Process of Short Glass Fiber
Reinforced Polycarbonate Composites Using Grey Rela-
tional Analysis,” Journal of Materials Processing Tech-
nology, Vol. 97, No. 1-3, 2000, pp. 186-193.
doi:10.1016/S0924-0136(99)00375-1
[12] J. L. Lin and C. L. Lin, “The Use of the Orthogonal Array
with Grey Relational Analysis to Optimize the Electrical
Discharge Machining Process with Multiple Performance
Characteristics,” International Journal of Machine Tools
and Manufacture, Vol. 42, No. 2, 2002, pp. 237-244.
doi:10.1016/S0890-6955(01)00107-9
[13] J. L. Deng, “Introduction to Grey System Theory,” Jour-
nal of Grey System, Vol. 1, No. 1, 1989, pp.1-24.
[14] C. L. Lin, “Use of the Taguchi Method and Grey Rela-
tional Analysis to Optimize Turning Operations with
Multiple Performance Characteristics,” Materials and
Manufacturing Processes, Vol. 19, No. 2, 2004, pp. 209-
220. doi:10.1081/AMP-120029852
[15] T. R. Lin, H. C. Chiu and M. F. Huang, “Optimizing Re-
moval Rate and Reliability of Polishing of Ceramic
Blocks Using a Combination of Taguchi and Grey
Method,” Institute of Materials Minerals an Mining, Au-
gust 2004.
[16] J. E. Shigley, C. R. Mischke and R. G. Budynas, “Me-
chanical Engineering Design,” 7th Edition, McGraw-Hill
Press, New York, 2003.
[17] M. C. Shaw, “Metal Cutting Principles,” Oxford Science
Press, New York, 2004.
[18] K. L. Wen, Y. W. Huang, W. C. Chung, T. C. Chung, M.
L. You and C. J. Lai, “Method and Application of Grey
Model,” Gau-Lih Press, Taipei, 2003.
Copyright © 2011 SciRes. NJGC