Paper Menu >>
Journal Menu >>
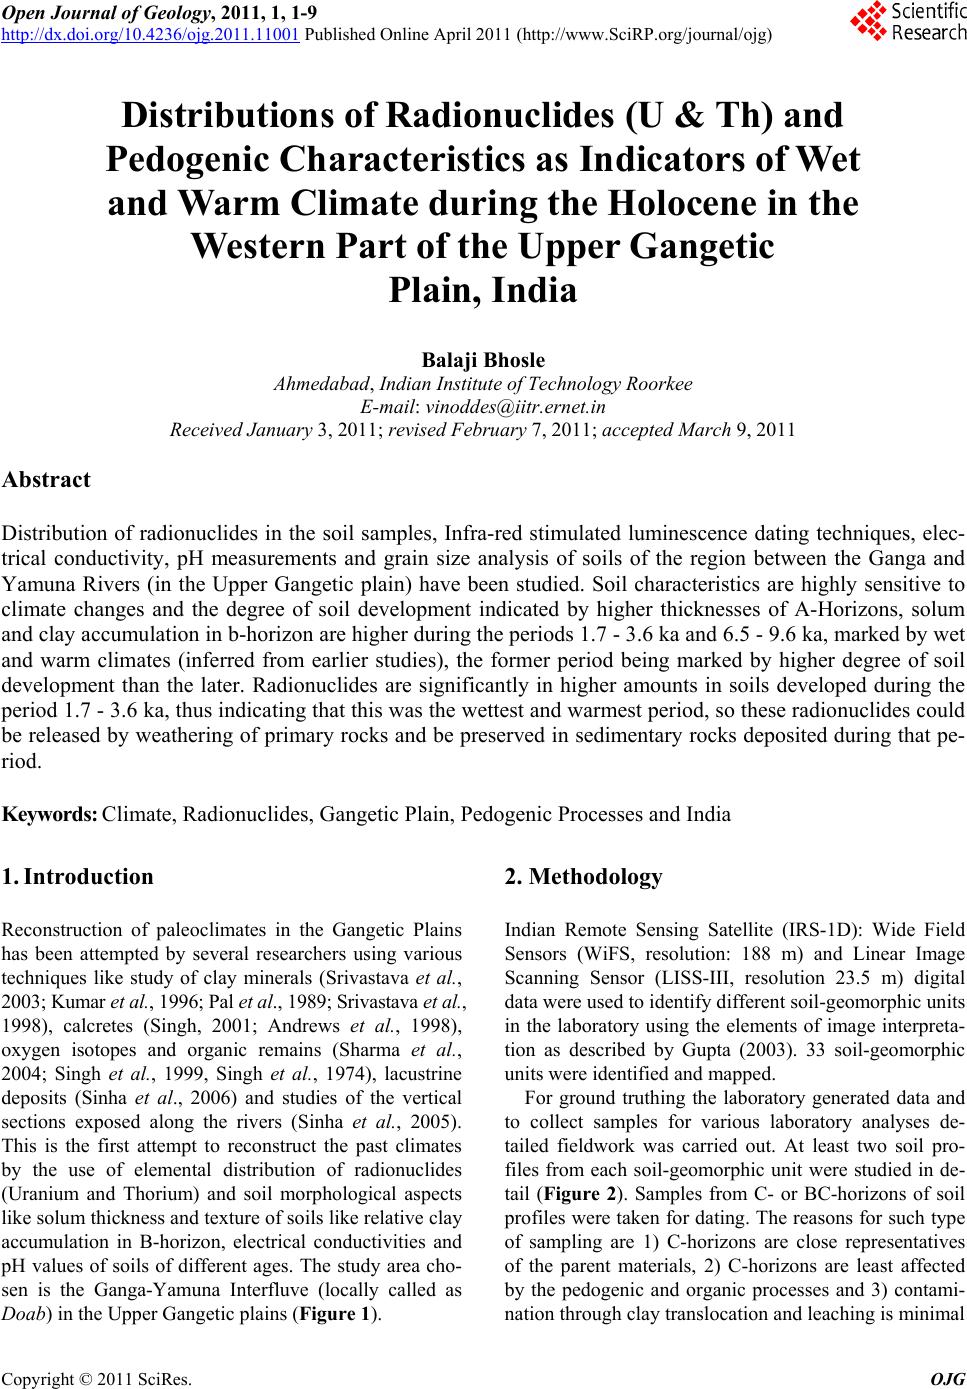 Open Journal of Geology, 2011, 1, 1-9 http://dx.doi.org/10.4236/ojg.2011.11001 Published Online April 2011 (http://www.SciRP.org/journal/ojg) Copyright © 2011 SciRes. OJG Distributions of Radionuclides (U & Th) and Pedogenic Characteristics as Indicators of Wet and Warm Climate during the Holocene in the Western Part of the Upper Gangetic Plain, India Balaji Bhosle Ahmedabad, Indian Institute of Technology Roorkee E-mail: vinoddes@iitr.ernet.in Received January 3, 2011; revised February 7, 2011; accepted March 9, 2011 Abstract Distribution of radionuclides in the soil samples, Infra-red stimulated luminescence dating techniques, elec- trical conductivity, pH measurements and grain size analysis of soils of the region between the Ganga and Yamuna Rivers (in the Upper Gangetic plain) have been studied. Soil characteristics are highly sensitive to climate changes and the degree of soil development indicated by higher thicknesses of A-Horizons, solum and clay accumulation in b-horizon are higher during the periods 1.7 - 3.6 ka and 6.5 - 9.6 ka, marked by wet and warm climates (inferred from earlier studies), the former period being marked by higher degree of soil development than the later. Radionuclides are significantly in higher amounts in soils developed during the period 1.7 - 3.6 ka, thus indicating that this was the wettest and warmest period, so these radionuclides could be released by weathering of primary rocks and be preserved in sedimentary rocks deposited during that pe- riod. Keywords: Climate, Radionuclides, Gangetic Plain, Pedogenic Processes and India 1. Introduction Reconstruction of paleoclimates in the Gangetic Plains has been attempted by several researchers using various techniques like study of clay minerals (Srivastava et al., 2003; Kumar et al., 1996; Pal et al., 1989; Srivastava et al., 1998), calcretes (Singh, 2001; Andrews et al., 1998), oxygen isotopes and organic remains (Sharma et al., 2004; Singh et al., 1999, Singh et al., 1974), lacustrine deposits (Sinha et al., 2006) and studies of the vertical sections exposed along the rivers (Sinha et al., 2005). This is the first attempt to reconstruct the past climates by the use of elemental distribution of radionuclides (Uranium and Thorium) and soil morphological aspects like solum thickness and texture of soils like relative clay accumulation in B-horizon, electrical conductivities and pH values of soils of different ages. The study area cho- sen is the Ganga-Yamuna Interfluve (locally called as Doab) in the Upper Gangetic plains (Figure 1). 2. Methodology Indian Remote Sensing Satellite (IRS-1D): Wide Field Sensors (WiFS, resolution: 188 m) and Linear Image Scanning Sensor (LISS-III, resolution 23.5 m) digital data were used to identify different soil-geomorphic units in the laboratory using the elements of image interpreta- tion as described by Gupta (2003). 33 soil-geomorphic units were identified and mapped. For ground truthing the laboratory generated data and to collect samples for various laboratory analyses de- tailed fieldwork was carried out. At least two soil pro- files from each soil-geomorphic unit were studied in de- tail (Figure 2). Samples from C- or BC-horizons of soil profiles were taken for dating. The reasons for such type of sampling are 1) C-horizons are close representatives of the parent materials, 2) C-horizons are least affected by the pedogenic and organic processes and 3) contami- nation through clay translocation and leaching is minimal 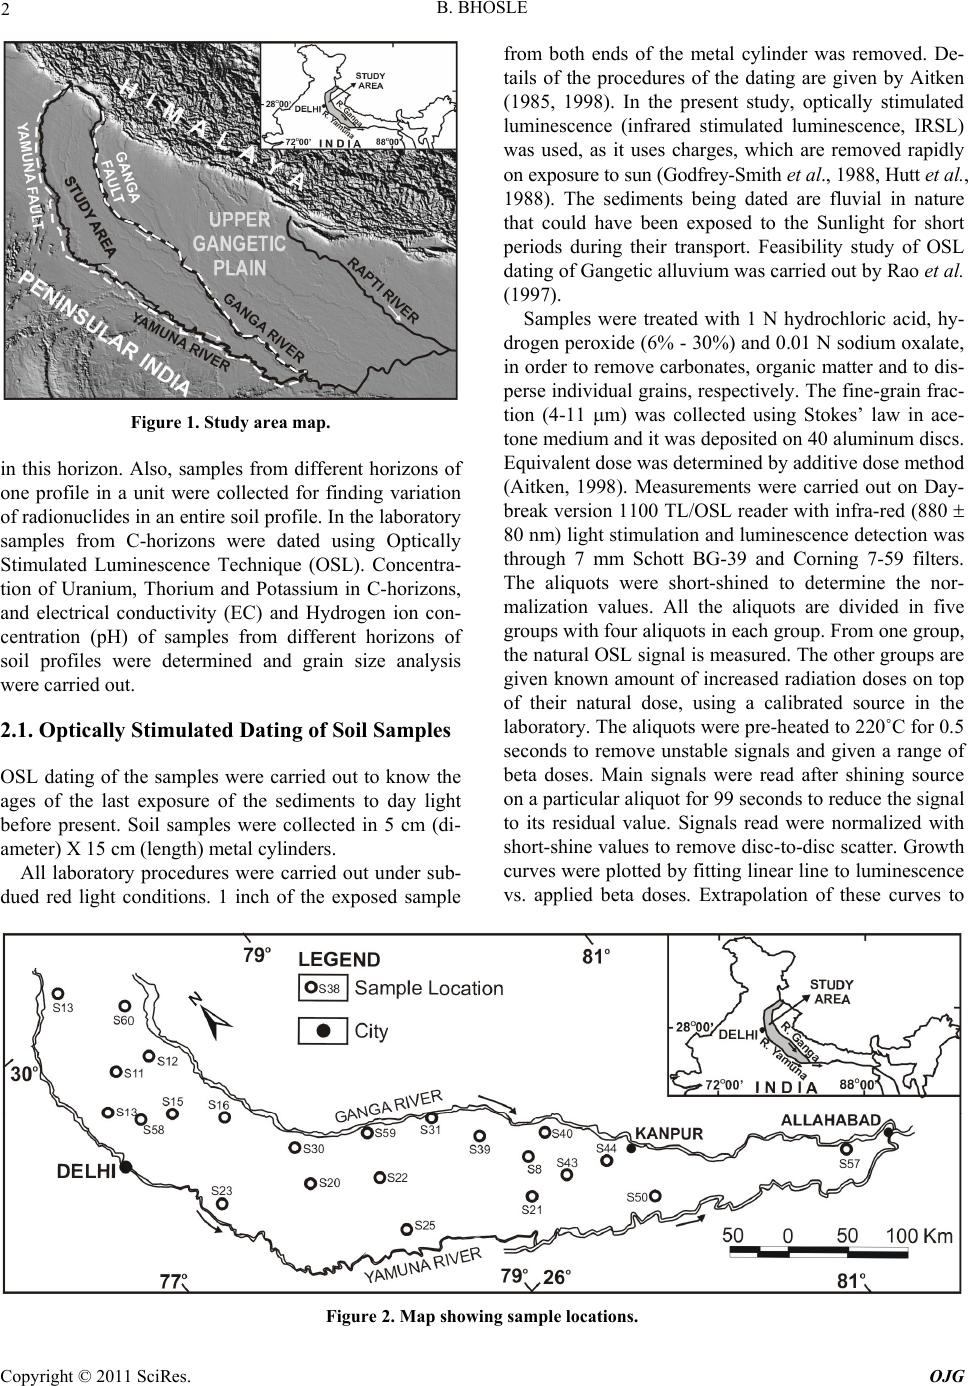 B. BHOSLE Copyright © 2011 SciRes. OJG 2 Figure 1. Study area map. in this horizon. Also, samples from different horizons of one profile in a unit were collected for finding variation of radionuclides in an entire soil profile. In the laboratory samples from C-horizons were dated using Optically Stimulated Luminescence Technique (OSL). Concentra- tion of Uranium, Thorium and Potassium in C-horizons, and electrical conductivity (EC) and Hydrogen ion con- centration (pH) of samples from different horizons of soil profiles were determined and grain size analysis were carried out. 2.1. Optically Stimulated Dating of Soil Samples OSL dating of the samples were carried out to know the ages of the last exposure of the sediments to day light before present. Soil samples were collected in 5 cm (di- ameter) X 15 cm (length) metal cylinders. All laboratory procedures were carried out under sub- dued red light conditions. 1 inch of the exposed sample from both ends of the metal cylinder was removed. De- tails of the procedures of the dating are given by Aitken (1985, 1998). In the present study, optically stimulated luminescence (infrared stimulated luminescence, IRSL) was used, as it uses charges, which are removed rapidly on exposure to sun (Godfrey-Smith et al., 1988, Hutt et al., 1988). The sediments being dated are fluvial in nature that could have been exposed to the Sunlight for short periods during their transport. Feasibility study of OSL dating of Gangetic alluvium was carried out by Rao et al. (1997). Samples were treated with 1 N hydrochloric acid, hy- drogen peroxide (6% - 30%) and 0.01 N sodium oxalate, in order to remove carbonates, organic matter and to dis- perse individual grains, respectively. The fine-grain frac- tion (4-11 m) was collected using Stokes’ law in ace- tone medium and it was deposited on 40 aluminum discs. Equivalent dose was determined by additive dose method (Aitken, 1998). Measurements were carried out on Day- break version 1100 TL/OSL reader with infra-red (880 80 nm) light stimulation and luminescence detection was through 7 mm Schott BG-39 and Corning 7-59 filters. The aliquots were short-shined to determine the nor- malization values. All the aliquots are divided in five groups with four aliquots in each group. From one group, the natural OSL signal is measured. The other groups are given known amount of increased radiation doses on top of their natural dose, using a calibrated source in the laboratory. The aliquots were pre-heated to 220˚C for 0.5 seconds to remove unstable signals and given a range of beta doses. Main signals were read after shining source on a particular aliquot for 99 seconds to reduce the signal to its residual value. Signals read were normalized with short-shine values to remove disc-to-disc scatter. Growth curves were plotted by fitting linear line to luminescence vs. applied beta doses. Extrapolation of these curves to Figure 2. Map showing sample locations. 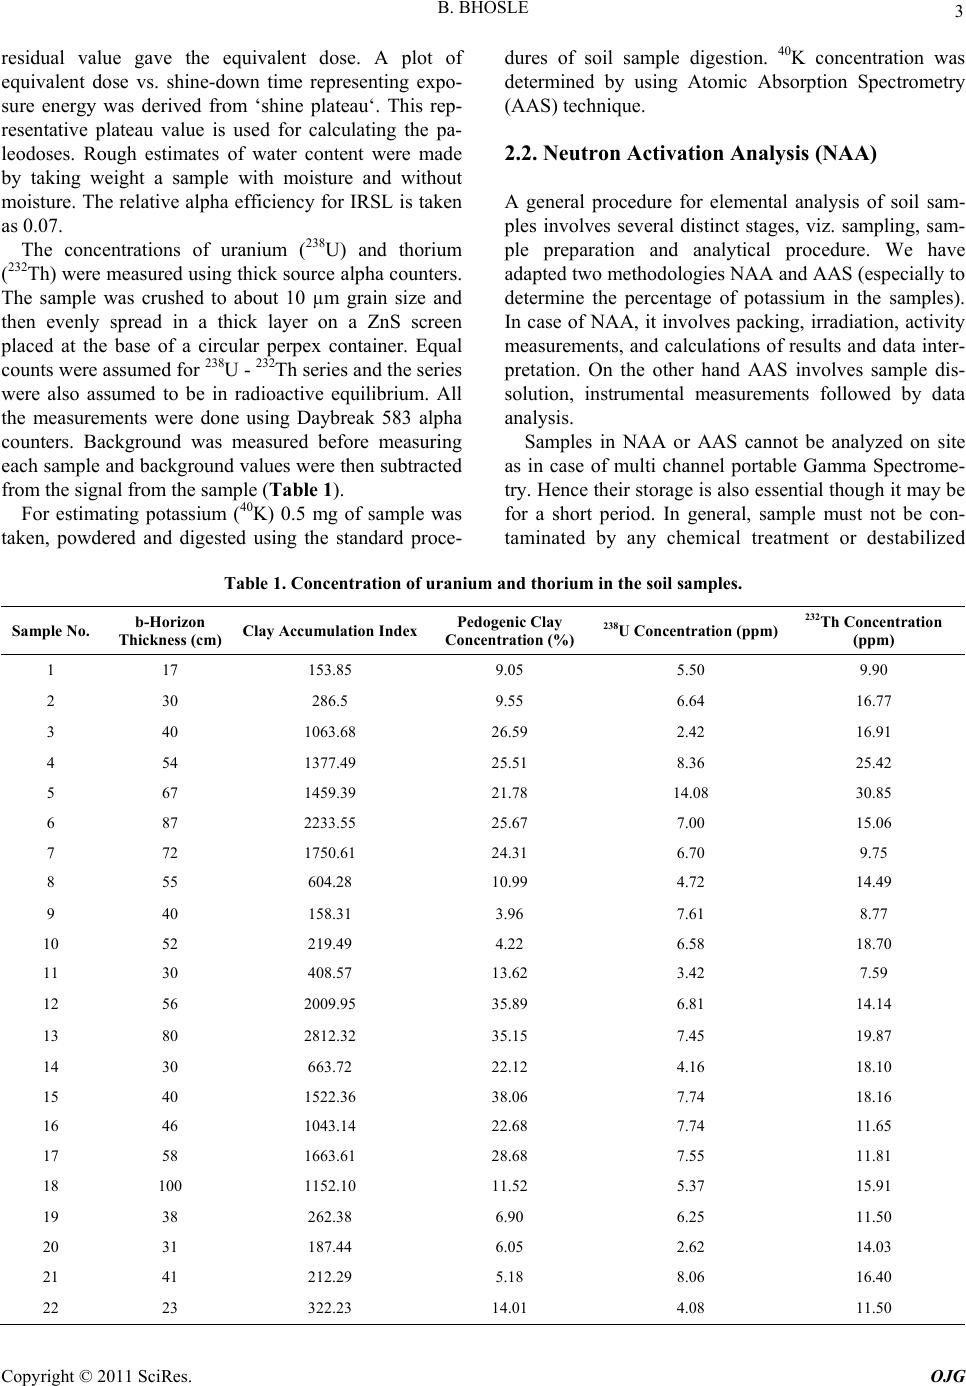 B. BHOSLE Copyright © 2011 SciRes. OJG 3 residual value gave the equivalent dose. A plot of equivalent dose vs. shine-down time representing expo- sure energy was derived from ‘shine plateau‘. This rep- resentative plateau value is used for calculating the pa- leodoses. Rough estimates of water content were made by taking weight a sample with moisture and without moisture. The relative alpha efficiency for IRSL is taken as 0.07. The concentrations of uranium (238U) and thorium (232Th) were measured using thick source alpha counters. The sample was crushed to about 10 µm grain size and then evenly spread in a thick layer on a ZnS screen placed at the base of a circular perpex container. Equal counts were assumed for 238U - 232Th series and the series were also assumed to be in radioactive equilibrium. All the measurements were done using Daybreak 583 alpha counters. Background was measured before measuring each sample and background values were then subtracted from the signal from the sample (Table 1). For estimating potassium (40K) 0.5 mg of sample was taken, powdered and digested using the standard proce- dures of soil sample digestion. 40K concentration was determined by using Atomic Absorption Spectrometry (AAS) technique. 2.2. Neutron Activation Analysis (NAA) A general procedure for elemental analysis of soil sam- ples involves several distinct stages, viz. sampling, sam- ple preparation and analytical procedure. We have adapted two methodologies NAA and AAS (especially to determine the percentage of potassium in the samples). In case of NAA, it involves packing, irradiation, activity measurements, and calculations of results and data inter- pretation. On the other hand AAS involves sample dis- solution, instrumental measurements followed by data analysis. Samples in NAA or AAS cannot be analyzed on site as in case of multi channel portable Gamma Spectrome- try. Hence their storage is also essential though it may be for a short period. In general, sample must not be con- taminated by any chemical treatment or destabilized Table 1. Concentration of uranium and thorium in the soil samples. Sample No. b-Horizon Thickness (cm) Clay Accumulation IndexPedogenic Clay Concentration (%) 238U Concentration (ppm) 232Th Concentration (ppm) 1 17 153.85 9.05 5.50 9.90 2 30 286.5 9.55 6.64 16.77 3 40 1063.68 26.59 2.42 16.91 4 54 1377.49 25.51 8.36 25.42 5 67 1459.39 21.78 14.08 30.85 6 87 2233.55 25.67 7.00 15.06 7 72 1750.61 24.31 6.70 9.75 8 55 604.28 10.99 4.72 14.49 9 40 158.31 3.96 7.61 8.77 10 52 219.49 4.22 6.58 18.70 11 30 408.57 13.62 3.42 7.59 12 56 2009.95 35.89 6.81 14.14 13 80 2812.32 35.15 7.45 19.87 14 30 663.72 22.12 4.16 18.10 15 40 1522.36 38.06 7.74 18.16 16 46 1043.14 22.68 7.74 11.65 17 58 1663.61 28.68 7.55 11.81 18 100 1152.10 11.52 5.37 15.91 19 38 262.38 6.90 6.25 11.50 20 31 187.44 6.05 2.62 14.03 21 41 212.29 5.18 8.06 16.40 22 23 322.23 14.01 4.08 11.50  B. BHOSLE Copyright © 2011 SciRes. OJG 4 during sample handling and storage. Soil samples were thoroughly mixed and small clusters if present are broken manually; roots, organic remains, calcretes and Fe-Mn nodules, if present, are taken out completely. Samples were then air dried or dried in oven and small part of it is taken, finely crushed to less than 2 µm size and then the sample is stored for further processing. Perhaps the simplest quality assurance procedure in NAA is to include two or more Standard/Certified Ref- erence Material (SRM) in each batch of unknown sam- ples for short or long irradiation. Das (1990) has recom- mended the simultaneous analysis of two or more SRMs preferably of similar matrix but from different agencies and known analysis by different techniques. In all our studies, we have used at least three different SRMs all having similar matrix from different agencies (Table 2). 2.2.1. NAA Methodology All the powdered samples and standards each of 50 mg were accurately weighed and packed in alkathene (pure form of polypropylene) for long-term irradiation of 6 hrs. Long (6h) irradiation at thermal neutron flux of 1012 n cm-2 s -1 in APSARA reactor at the Bhabha Atomic Re- search Centre (BARC), Mumbai, India. Activities due to 153Sm, 121Eu, 82Br, 117Lu, 239U, 233Th, 140La, 24Na, 51Cr, 181Hf, 137Cs, 46Sc, 59Fe, 40K and 42K were measured using an 80 cm3 coaxial High Precision Germanium (HPGe) detector (EG & G ORTEC) and 8k MCA at the reactor site and later at the Radiochemistry Laboratories of BARC. All irradiations were carried out in APSARA/Dhruva reactors at the BARC, Mumbai. The irradiated samples were then brought to our laboratories in Roorkee and -activity was measured using a NaI (Sodium Iodide) detector having 2.2keV resolution at 1332keV of 60Co and 8k MCA with GENIE-2000 software (Canberra, Australia). Counting was followed after a delay of 10 days for 1, 2, 6 and 12 hours at different intervals up to 2 months. A typical -ray spectrum showing various pho- topeaks is shown in Figure 3. Peak areas were noted and background was subtracted to obtain net counts. Care was taken to obtain concentrations of the maximum number of elements from more than one counting and thus reproducibility of data was checked. Elemental con- tents were calculated by comparing with more than one reference materials. The spectra of irradiated samples of natural matrices are usually complex with closely-lying multiple peaks. The peaks show Gaussian distribution as the first contri- bution to the photo peak in a semiconductor detector is due to statistical fluctuations in sharing the absorbed energy between ionization and heating the crystal net- work. The continuum under the peak is due to Compton effect from the -rays of higher energies and the back Table 2. List of standard reference materials. Geological StandardIdentification Number Source Estuarine sediment IAEA-405 IAEA, Vienna Pond Sediment No.2 NIES, Japan Soil Soil-5 IAEA, Vienna Basalts W-1 and BCR-1 USGS, USA Figure 3 Typical -ray spectrum showing various pho- topeaks. ground. Steps involved in the computerized analysis of a peak are smoothening of experimental data, peak search- ing, selection of fitting intervals, peak energy calculation and peak area calculation. 2.3. EC and pH Measurements EC measurements of soil samples were carried out by preparing soil:water (1:2) mixture (Jackson, 1967), using distilled water. EC of the mixture was determined by digital conductivity meter (R-314, Raina Instrument, Delhi). To determine pH a mixture of soil and distilled water in the ratio of 1:2 was prepared by shaking it intermit- tently for an hour (Jackson, 1967). pH reading for the mixture was taken by using Lutron PH-201 digital pH meter. 2.4. Grain Size Analysis 40 gm of sample was taken air or oven dried at low tem- peratures. Samples were prepared by following the stan- dard method given by Galehouse (1971). Coarse (> 50 µ) and fine (< 50 µ, silt and clay) were separated by wet sieving through American Society for Testing and Mate-  B. BHOSLE Copyright © 2011 SciRes. OJG 5 rials (A.S.T.M) Sieve Number 230 sieve. Fine fraction was further analyzed for silt and clay contents by using standard procedure of pipette analysis. Sand, silt and clay percentages were calculated according to the size classi- fication used by U.S.D.A. Soil Survey Manual (1999). Pedogenic clay content was determined by subtracting the percentages of clay of A or C-horizons from that of the B-horizons (Birkeland, 1984). Clay accumulation index (sum of increase in clay content over that of A or C-horizon multiplied by thickness of B-sub-horizon/s, C.A.I. index) proposed by Levine and Ciolkosz (1983) was also calculated for typical pedons. Where trenches were excavated up to C-Horizons, the clay percentages were calculated taking the clay abundances of C-horizon into account as C-horizon is least affected by pedogenic processes. 3. Results From ages of C-horizons, soils have been categorized into five members of a morphostratigraphic sequence with ages < 1.7 ka (QGMS-I), 1.7 - 3.6 ka (QGMS-II), 3.6 - 6.5 ka (QGMS-III), 6.5 - 9.6 ka (QGMS-IV) and > 9.6 ka (QGMS-V). B-horizon thickness of different pedons are higher in the QGMS-II and IV member soils as compared to soils of other members, as shown in bar diagrams for various pedons (Figure 4(a)). Pedogenic clay content in QGMS-II and QGMS-IV is higher as compared to the other mem- bers (Figure 4(b)). The C.A.I. calculated for the soil samples of QGMS-II and IV show high values ranging from 1377.3.86 and 2233.55 as compared to soils of other members, where C.A.I. ranges from 153.85 to 475.95 (Figure 4(c)). Bar diagrams (Figure 5(a), (b) and Table 1) showing concentration of Uranium and Thorium in different sam- ples from five morphostratigraphic sequence members bring out that the soils of the QGMS-II members show higher concentrations as compared to the soils of other members. Also, U and Th values remain almost un- changed from horizon to horizon within a soil profile from QGMS-II member. 4. Discussion The monsoonal variability during the last 18 ka inferred by Overpeck et al. (1996), Prell and Kutzbach (1987, 1992) and Goodbread (2003) during the last 150 ka show that the period at the beginning of the Holocene (about 10 to 11 ka) was a wet period. The periods 1.7 to 3.6 ka (QGMS-II) (Sharma et al., 2004; Andrews et al., 1998; Singh et al., 1974; Srivastava et al., 2003) and 6.5 to 9.6 ka (QGMS-IV) (Sharma et al., 2004; Srivastava et al., 2003) were marked by wet, warm climate. Our data relating to soil morphology, texture and distri- bution of U and Th for different soil-morphostratigraphic sequence members can be explained in terms of climatic changes during the Holocene Period. Studies on relation between clay content accumulation and climate suggests that both have a linear relationship i.e., rates of clay production increases with the increasing moisture content and temperature and the rate is highest in wet and warm climates (Jenny, 1985, McFadden, 1982 and Dan et al., 1982). Thus in wet, warm periods we expect highest pedogenic contents, high solum thickness and A-horizon thickness (indicating higher degree of soil development). Indeed that is the case in the present study, pedogenic clay content in B-horizons, clay accumulation index and solum thickness of soils are the highest during the wet and warm periods of QGMS-II and IV as com- pared to rest of the Holocene deposits in the study area. The QGMS-II soils are relatively more developed as compared to QGMS-IV soils. Thickness of A-horizons of soils of member QGMS-II (12 to 52 cm) is higher than soils of other members (0 to 45 cm). All these features thus indicate that probably periods of formation of QGMS-II soils showing higher degree of soil develop- ment was warmer and wetter than that of QGM_IV soils. The soils belonging to the QGMS-II and IV members are acidic in nature. An electrical conductivity measurement of these soils shows high conductivity values ranging from 0.041 - 0.60 mmhos/cm, which are higher than the soils of other ages (0.013 to 0.040 mmhos/cm). Electrical conductivities are the measure of the total dissolved sol- ids in any medium so high values means that the period was marked by wetter and warmer climates, which are necessary for high rates of chemical weathering of min- erals, leading to release to large amounts of soluble products. It will explain acidic nature and higher electri- cal conductivity of soils of the QGMS-II and IV depos- ited during warm and wet periods. As Uranium and Thorium precipitation increases when the climatic conditions are wet and warm (Ramli et al., 2005; Vargas et al., 1997; Miah et al., 1998; Echevarria et al., 2001; Martinez-Aguirre et al., 1995). Distribution of Uranium is highly controlled by the insitu soil mois- ture and pH values of the deposition medium (water in this case) as envisaged by Langmuir (1997), which are high in warm and wet periods. High values of U, Th and K in parent materials for QGMS-II are as expected. Their low values during the period 6.5 - 9.6 ka indicates that though this period was marked by warm, wet climate, but it was subdued as compared to 1.7 - 3.6 ka period, so that smaller amounts of these elements were released by weathering of primary rocks. It supports the conclusions reached by degree of soil development, as discussed  B. BHOSLE Copyright © 2011 SciRes. OJG 6 Figure 4. Variation in (a) B-horizon thickness, (b) Percentages of pedogenic clays and (c) Clay accumulation index (CAI) in soil profiles of different members.  B. BHOSLE Copyright © 2011 SciRes. OJG 7 Figure 5. Bar Diagram showing variations in concentration of (a) Uranium and (b) Thorium in different samples. above. Minor variation of U and Th within a profile of QGMS-II unit (warmest and wettest) suggests that pe- dogenesis does not redistribute these elements signifi- cantly and values from C-horizons are representative of the parent material. 5. Conclusions Following conclusions can be drawn from the studies: 1) Pedogenic processes are highly sensitive to climatic changes and warmer and wetter periods of the Early Holocene period (6.5 - 9.6 ka) and late Holocene period (1.7 - 3.6 ka) are marked by higher thickness of A-horizons and solum and higher clay accumulations in B-horizons than the other periods. 2) Concentration of Uranium and Thorium show sig- nificantly high values in sediments deposited during rela- tively highly wet and warm period(1.7 - 3.6 ka), though it is not possible to provide exact climatic conditions. This is also supported by the degree of development of soils. 6. Acknowledgements Thanks are due to Drs. A.V.R. Reddy and A.G.C. Nair, Radiochemistry Division of BARC, Mumbai, for pro- viding necessary facilities during short irradiation work. Fellowship from the Ministry of Human Resource and Development, Government of India to B.B and R.P.C. is gratefully acknowledged. 7. References [1] P. Srivastava, I.B. Singh, M. Sharma and A. K. Singhvi, “Luminescence Chronometry and Late Quaternary geo- morphic history of the Ganga Plain. India” Palaeogeo., Palaeoclimat., Paleoeco. Vol. 197, 2003, pp. 15-41. [2] S. Kumar, B. Parkash, M. L. Manchanda, A. K. Singhvi, and P. Srivastava, “Holocene landform and land evalua-  B. BHOSLE Copyright © 2011 SciRes. OJG 8 tion of the Western Gangetic Plains: Implications of neo- tectonics and climate”. Zutschrift fuer Geomorphologie, Vol. 103, 1996, pp. 283-312. [3] D. K. Pal, S. B. Deshpande, K. R. Venugopal, and A. R. Kalbande, “Formation of di- and trioctahedral smectite as evidence for Paleoclimatic changes in southern and cen- tral Peninsular India”, Geoderma, Vol. 45, 1989, pp. 175- 184. [4] P. Srivastava, B. Parkash and D. K. Pal, “Clay Minerals in Soils as Evidence of Holocene Climatic Change, Cen- tral Indo-Gangetic Plains, North-Central India”, Quater- nary Research, 50, 1998, pp 230-239. [5] I. B. Singh, “Late Quaternary evolution of Ganga Plain and proxy records of climate change, neotectonics and anthropogenic activity”, Prayagdhara, Journal of the U.P. State Archaeological Department (India), Vol. 12, 2001, pp. 1-25. [6] J. E. Andrews, A. K. Singhvi, A. J. Kailath, R. Kuhn, P. F. Dennis, S. K. Tandon and R. P. Dhir, “Do Stable Iso- topes Data from the Calcrete Record Late Pleistocene Monsoonal Climatic Variation in the Thar Desert of In- dia?”, Quaternary Research, Vol. 50, 1998, pp. 240-251. [7] S. Sharma, M. Joachimski, M. Sharma, H. J. Tobschall, I. B. Singh, C. Sharma, M. S. Chauhan, and G. Morgenroth, “Lateglacial and Holocene environmental changes in Ganga plain, Northern India”, Quaternary Science Re- views, Vol. 23, No. 1-2, 2004, pp. 145-159. [8] I. B. Singh, S. Sharma, M. Sharma, P. Srivastava, and G. Rajgopalan, “Evidence of human occupation and humid climate of 30 Ka in the alluvium of southern Ganga Plain”, Current Science, Vol. 76, 1999, pp. 1022-1026. [9] G. Singh, R. D. Joshi, S. K. Chopra, and A. B. Singh, “Late Quaternary history of vegetation and climate of the Rajasthan desert, India”, Philosphical Transactions of the Royal Society of London Vol. 267, 1974, pp. 467-501. [10] R. Sinha, W. Smykatz-Kloss, D. Stuben, S. P. Harrison, Z. Berner and U. Kramar, “Late Quaternary Paleoclimatic reconstructions from the lacustrine sediments of the Sambhar playa core, Thar Desert margin, India”, Pa- laeogeo. Palaeocli. Plalaeoeco., Vol. 233, 2006, pp. 252- 270. [11] R. Sinha, M. R. Gibling, S. K. Tandon, V. Jain, and A. S. Dasgupta, “Quaternary stratigraphy and sedimentology of the Kotra section on the Betwa river, Southern Gangetic plains, Uttar Pradesh”, Jour. Geological Society of India, Vol. 65, 2005, pp. 441-450. [12] Gupta, R.P., 2003. Remote Sensing Geology, 2nd ed. Springer-Verlag, New York. 655 pp. [13] Aitken, M.J., 1985. Thermoluminescence Dating, Aca- demic Press, London. [14] Aitken M.J., 1998. An introduction to optical dating. Oxford University Press. Oxford. [15] D. I. Godfrey-Smith, D. J. Huntley and W. H. Chen, “Op- tical dating studies of quartz and feldspar sediment ex- tracts”, Quat. Sci. Rev. Vol. 7, 1998, pp. 373-380. [16] G. Hutt, I. Jaek, and J. Tchonka, “Optical dating: K-feldspars optical response stimulation spectrum. Quat. Sci. Rev., Vol. 7, 1988, pp. 381-386. [17] M. S. Rao, B. K. Bisaria, and A. K. Singhvi, “A feasibil- ity study towards absolute dating of Indo-Gangetic allu- vium using thermoluminescence and infrared stimulated luminescence techniques”’ Curr. Sci., Vol. 72, 1997, pp. 663-669. [18] H. A. Das, “The use of standards for quality control in activation analysis”, J. Radioanalytical and Nuclear Chemistry, Vol. 140, No. 2, 1990, pp. 387-393. [19] Jackson, M.L., 1967. Soil Chemical Analysis. Pren- tice-Hall of India Pvt. Ltd., New Delhi, 498p. [20] Galehouse, J.S., 1971. Sedimentation analysis. In: Carver, R. (Ed.), Procedures in Sedimentary Petrology. Wiley– Interscience, London, pp. 69-94. [21] U.S.D.A., 1999. Soil Taxonomy, A Basic System of Soil Classification for Making and Interpreting Soil Surveys, Handbook No. 436. U.S. Government Printing Office Washington, D.C., 871p. [22] Birkeland, P.W., 1984. Soils and Geomorphology, Ox- ford Univ. Press, New York. 372pp. [23] E. L. Levine and E. J. Ciolkosz, “Soil development in till of various ages in northern Pennsylvania”, Quater. Res., Vol. 19, 1983, pp. 85-99. [24] J. Overpeck, D. Anderson, S. Trumbore, and W. L. Prell “The southwest Indian Monsoon over the last 18,000 years”, Clim. Dyn. Vol. 12, 1996, pp. 213-225. [25] W. L. Prell, and J. E. Kutzbach, “Monsoon variability over the past 150,000 years”, J. Geophys. Res., Vol. 92, No. 7, 1987, pp. 8411-8425. [26] L. Prell, and J. E. Kutzbach, “Sensitivity of the Indian Monsoon to forcing parameters and implications for its evolution”, Nature, Vol. 360: 1992, pp. 647-652. [27] S. L. Goodbread Jr., “Response of the Ganges dispersal system to climate change: a source-to-sink view since the last interstade”, Sediment. Geol., Vol. 162, 2003, pp. 83- 104. [28] H. Jenny, “The clay content of the soils as related to cli- matic factors, particularly temperature”, Soil Sci., Vol. 40, 1985, pp. 111-128. [29] McFadden, L.D., 1982. The impact of temporal and spa- tial climatic changes on alluvial soils genesis in Southern California, Ph.D. thesis, University of Arizona, Tucson, 430p. [30] J. Dan, D. H. Yaalon, R. Moshe, and S. Nissim, “Evolu- tion of reg soils in Southern Israel and Sinai”, Geoderma, Vol. 28, 1982, pp. 173-202. [31] A. T. Ramli, A. W. M. A. Hussein, and A. K. Wood, “Environmental 238U and 232Th concentration measure- ments in an area of high level natural background radia- tion at Palong, Johor, Malaysia”, J. of Env. Radioactivity, Vol. 80, 2005, 287-304. [32] M. J. Vargas, V. Tome, M. A. Sanchez, M. T. C. Vazquez, and J. L. G. Mrillo, “Distribution of Uranium and Thorium in Sediments and Plants from a Granitic Fluvial Area”, Appl. Radiat. Isot., Vol. 48, No. 8, 1997, pp. 1137-1143.  B. BHOSLE Copyright © 2011 SciRes. OJG 9 [33] F. K. Miah, S. Roy, M. Tuuhiduzzaman, and B. Alam, “Distribution of Radionuclides in Soil Samples in and Around Dhaka City”, Appl. Radiat. Isot., Vol. 49, No. 1-2, 1998, pp. 133-137. [34] G. Echevarria, M. I. Sheppard, and J. L. Morel, “Effect of pH on the sorption of uranium in soils”, J. of Env. Ra- dioactivity, Vol. 53, 2001, pp. 257-264. [35] A. Martinez-Aguirre, M. Garcia-Leon, and M. Ivanovich, “U and Th speciation in river sediments”, J. of The Sci. of the Total Env., Vol. 173/174, 1995, 203-209. [36] Langmuir, D., 1997. Aqueous Environmental Geochem- istry. Upper Saddle Rive, New Jersey 07458: Simon & Schuster. |