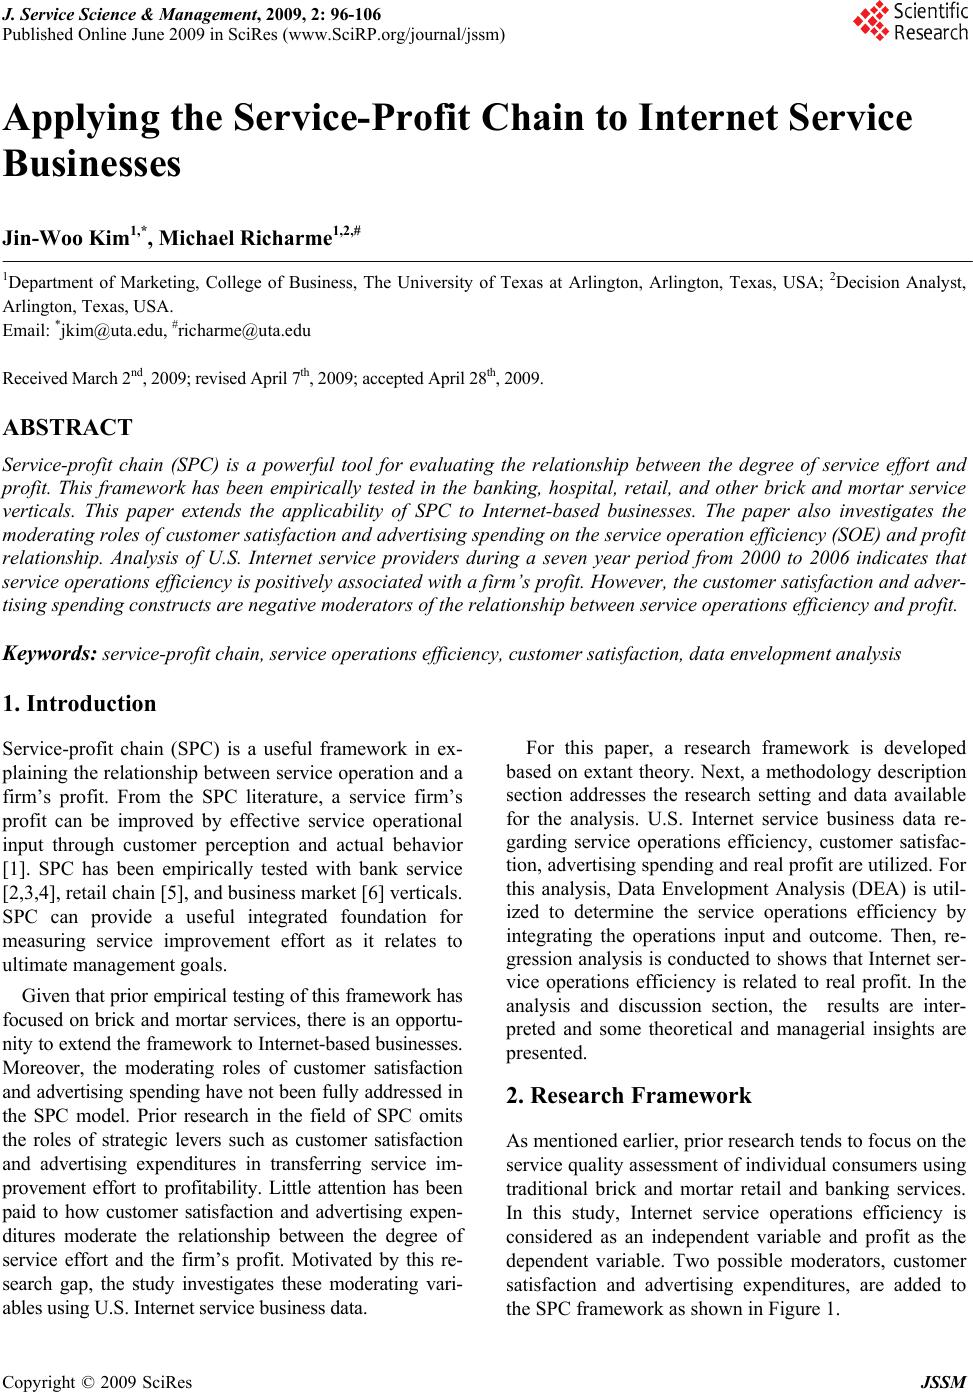
 J. Service Science & Management, 2009, 2: 96-106 Published Online June 2009 in SciRes (www.SciRP.org/journal/jssm) Copyright © 2009 SciRes JSSM Applying the Service-Profit Chain to Internet Service Businesses Jin-Woo Kim1,*, Michael Richarme1,2,# 1Department of Marketing, College of Business, The University of Texas at Arlington, Arlington, Texas, USA; 2Decision Analyst, Arlington, Texas, USA. Email: *jkim@uta.edu, #richarme@uta.edu Received March 2nd, 2009; revised April 7th, 2009; accepted April 28th, 2009. ABSTRACT Service-profit chain (SPC) is a powerful tool for evaluating the relationship between the degree of service effort and profit. This framework has been empirically tested in the banking, hospital, retail, and other brick and mortar service verticals. This paper extends the applicability of SPC to Internet-based businesses. The paper also investigates the moderating roles of customer satisfaction and advertising spending on the service operation efficiency (SOE) and profit relationship. Analysis of U.S. Internet service providers during a seven year period from 2000 to 2006 indicates that service operations efficiency is positively associated with a firm’s profit. However, the customer satisfaction and adver- tising spending constructs are negative moderators of the relationship between service operations efficiency and profit. Keywords: service-profit chain, service operations efficiency, customer satisfaction, data envelopment analysis 1. Introduction Service-profit chain (SPC) is a useful framework in ex- plaining the relationship between service operation and a firm’s profit. From the SPC literature, a service firm’s profit can be improved by effective service operational input through customer perception and actual behavior [1]. SPC has been empirically tested with bank service [2,3,4], retail chain [5], and business market [6] verticals. SPC can provide a useful integrated foundation for measuring service improvement effort as it relates to ultimate management goals. Given that prior empirical testing of this framework has focused on brick and mortar services, there is an opportu- nity to extend the framework to Internet-based businesses. Moreover, the moderating roles of customer satisfaction and advertising spending have not been fully addressed in the SPC model. Prior research in the field of SPC omits the roles of strategic levers such as customer satisfaction and advertising expenditures in transferring service im- provement effort to profitability. Little attention has been paid to how customer satisfaction and advertising expen- ditures moderate the relationship between the degree of service effort and the firm’s profit. Motivated by this re- search gap, the study investigates these moderating vari- ables using U.S. Internet service business data. For this paper, a research framework is developed based on extant theory. Next, a methodology description section addresses the research setting and data available for the analysis. U.S. Internet service business data re- garding service operations efficiency, customer satisfac- tion, advertising spending and real profit are utilized. For this analysis, Data Envelopment Analysis (DEA) is util- ized to determine the service operations efficiency by integrating the operations input and outcome. Then, re- gression analysis is conducted to shows that Internet ser- vice operations efficiency is related to real profit. In the analysis and discussion section, the results are inter- preted and some theoretical and managerial insights are presented. 2. Research Framework As mentioned earlier, prior research tends to focus on the service quality assessment of individual consumers using traditional brick and mortar retail and banking services. In this study, Internet service operations efficiency is considered as an independent variable and profit as the dependent variable. Two possible moderators, customer satisfaction and advertising expenditures, are added to the SPC framework as shown in Figure 1. 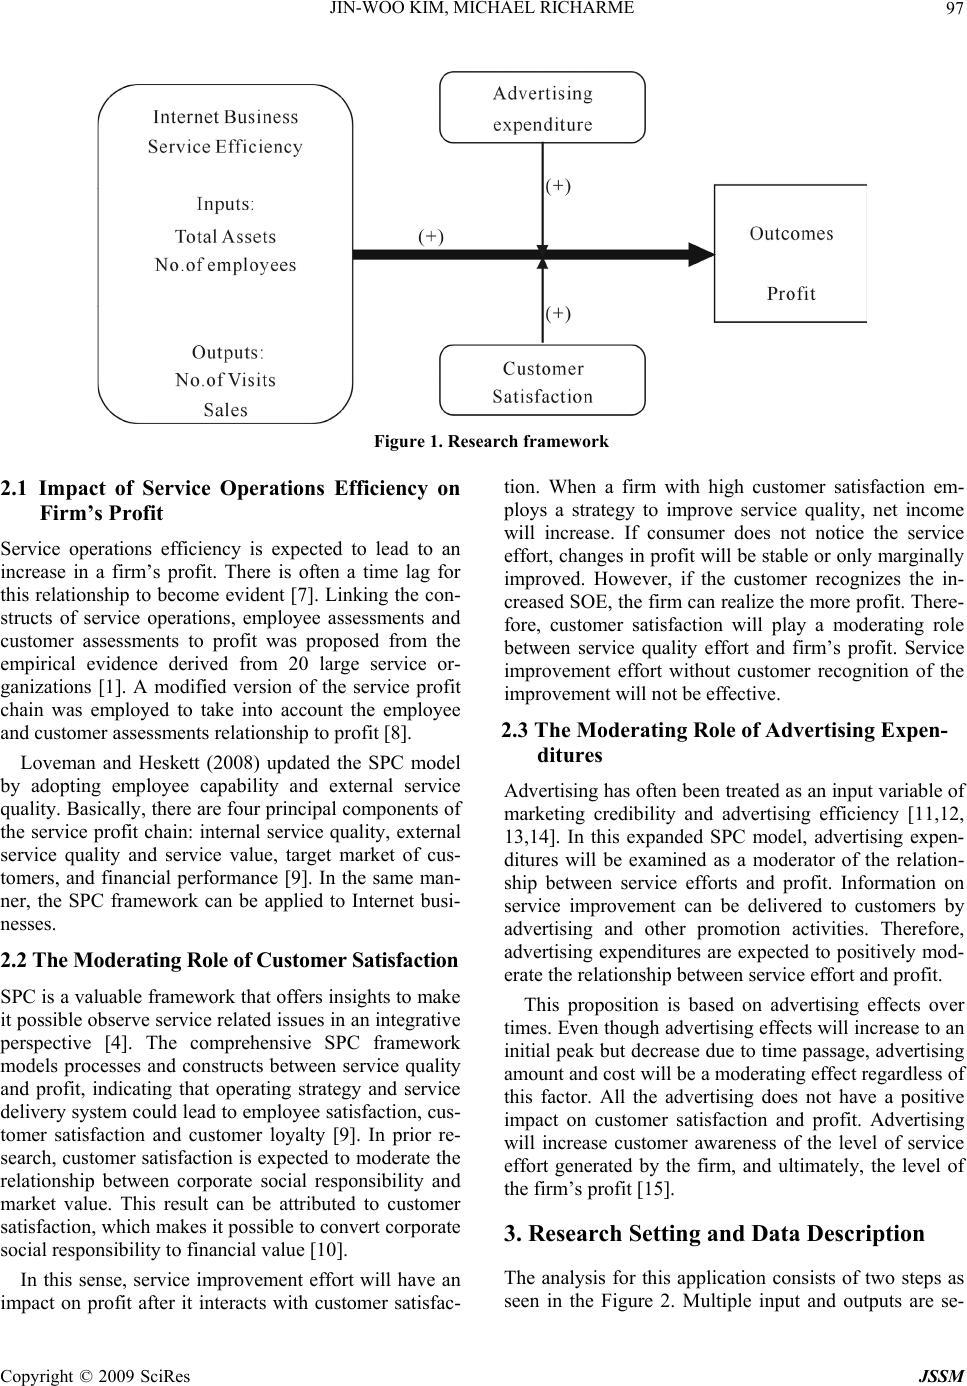 JIN-WOO KIM, MICHAEL RICHARME97 Figure 1. Research framework 2.1 Impact of Service Operations Efficiency on Firm’s Profit Service operations efficiency is expected to lead to an increase in a firm’s profit. There is often a time lag for this relationship to become evident [7]. Linking the con- structs of service operations, employee assessments and customer assessments to profit was proposed from the empirical evidence derived from 20 large service or- ganizations [1]. A modified version of the service profit chain was employed to take into account the employee and customer assessments relationship to profit [8]. Loveman and Heskett (2008) updated the SPC model by adopting employee capability and external service quality. Basically, there are four principal components of the service profit chain: internal service quality, external service quality and service value, target market of cus- tomers, and financial performance [9]. In the same man- ner, the SPC framework can be applied to Internet busi- nesses. 2.2 The Moderating Role of Customer Satisfaction SPC is a valuable framework that offers insights to make it possible observe service related issues in an integrative perspective [4]. The comprehensive SPC framework models processes and constructs between service quality and profit, indicating that operating strategy and service delivery system could lead to employee satisfaction, cus- tomer satisfaction and customer loyalty [9]. In prior re- search, customer satisfaction is expected to moderate the relationship between corporate social responsibility and market value. This result can be attributed to customer satisfaction, which makes it possible to convert corporate social responsibility to financial value [10]. In this sense, service improvement effort will have an impact on profit after it interacts with customer satisfac- tion. When a firm with high customer satisfaction em- ploys a strategy to improve service quality, net income will increase. If consumer does not notice the service effort, changes in profit will be stable or only marginally improved. However, if the customer recognizes the in- creased SOE, the firm can realize the more profit. There- fore, customer satisfaction will play a moderating role between service quality effort and firm’s profit. Service improvement effort without customer recognition of the improvement will not be effective. 2.3 The Moderating Role of Advertising Expen- ditures Advertising has often been treated as an input variable of marketing credibility and advertising efficiency [11,12, 13,14]. In this expanded SPC model, advertising expen- ditures will be examined as a moderator of the relation- ship between service efforts and profit. Information on service improvement can be delivered to customers by advertising and other promotion activities. Therefore, advertising expenditures are expected to positively mod- erate the relationship between service effort and profit. This proposition is based on advertising effects over times. Even though advertising effects will increase to an initial peak but decrease due to time passage, advertising amount and cost will be a moderating effect regardless of this factor. All the advertising does not have a positive impact on customer satisfaction and profit. Advertising will increase customer awareness of the level of service effort generated by the firm, and ultimately, the level of the firm’s profit [15]. 3. Research Setting and Data Description The analysis for this application consists of two steps as seen in the Figure 2. Multiple input and outputs are se- Copyright © 2009 SciRes JSSM  JIN-WOO KIM, MICHAEL RICHARME 98 lected to represent the service operations efficiency con- struct. After defining these inputs and outputs, SOE is estimated using Data Envelopment Analysis (DEA). This technique is one of the most popular management science tools used to determine a firm’s efficiency level from multiple inputs and multiple outputs. A quick back- ground of the DEA technique is provided in the Appen- dix. From this first step, the SOE estimates will be the regressor and the firm’s profit will be the response in the regression equations. 3.1 Measuring Service Operations Efficiency The concept of service operations efficiency can be a very useful indicator that focuses on “Do things in the right manner” rather than “Do the right things.” Since the early 1990’s, many researchers have started to study service quality and assessment from a macro-economic point of view. The DEA technique has become a useful manage- ment science tool, in which multiple inputs and multiple outputs can be involved simultaneously, whereas regres- sion cannot include multiple responses [16]. In particular, DEA is a tool for evaluating marketing’s credibility [13], retail productivity [17,18], sales force performance [19,20], and advertising efficiency [11,12,14]. Also, DEA is used to compute efficiency of supply chain processes [21,22] and operations efficiency [23]. The efficiency of one DMU1 can be obtained as a solu- tion to maximize its efficiency subject to the efficiency of all DMUs being less than or equal to 1. The solution pro- duces the weights which are most favorable to the DMU1 and provides a measure of efficiency for that DMU1. The solution produces the weights which are most favorable to the DMU1 and provides a measure of efficiency for the DMU1. The algebraic model is as follows: i ii r rr DMUInputweight DMUOutputweight hMax 1 1 0 subject to 1 i jii r jrr DMUInputweight DMUOutputweight for each DMUj, ir weight,weight Several studies have examined efficiency measures of on-line businesses by using the DEA methodology. The efficiency of service delivery processes was computed based on a survey of 135 large U.S. retail banks hold- ing more than 75% of the total assets in the industry in 1994. Activity time (minutes), technology, and function- ality were regarded as multiple inputs and check cycle time (day), ATM cycle time (day), and customer time (minutes) were considered as multiple outputs [24]. The efficiency of several search engines was investi- gated by using a query search as a production process and compared to each other by employing a simple data envelopment analysis model. The seven primary search engines utilized were Alta Vista, Excite, Lycos, Infoseek, Open Text, Hotbed, and Web Crawler. Intermediate in- puts included the number of pages, update freshness, time for data retrieval, and feature on fourteen informa- tion retrieval items. Output variables included precision and circulation. A survey conducted by Internet media companies provided fifteen queries that are submitted to each engine and then the first twenty returned results were considered in calculating the values [25]. Define SOE DEA phase Choose ts Choose tsmultiple inpumultiple outpu Estimate SOE level usin DEA Figure 2. Research process Result of SOE estimation Regression p rofitPredict P hase Copyright © 2009 SciRes JSSM  JIN-WOO KIM, MICHAEL RICHARME99 The concept of ‘customer efficiency’ was established and linked to e-business management practices. For this purpose, purchase activity time and non-purchase activ- ity time were used as multiple inputs and number of in- formational transactions, number of service transactions, and number of purchases were considered as multiple outputs for computation of the efficiency construct [26]. Given this, service operations efficiency is measured with two inputs and two outputs in this study. From Re- source Based View (RBV) theory, total assets and num- ber of employees are considered as inputs. Multiple out- puts include total number of visit and total sales. Sup- pose that the Amazon’s total asset and number of em- ployees are 5 and 6, and total number of site visits and total sales are 7 and 8 while eBay’s input values are 5 and 8, and output values are 3 and 4. The efficiency of Amazon (h0) can be obtained by solving the following model: 0 78 56 asset employee visit sales weight weight Max hweight weight subject to 78 1 56 asset employee visit sales weightweight weight weight (Amazon), 34 1 58 asset employee visit sales weight weight weight weight (eBay), ……………. for remaining DMUs and salesvisitemployeeasset weightweightweight,weight If h0 is equal to 1 then Amazon is efficient relative to other DMUs but if h0 is less than 1, some other DMU is more efficient than Amazon. 3.2 Predicting Firm’s Profit After SOE is computed, several multivariate regression analyses were conducted to grasp the effects of SOE and other factors on firm’s profit as the following: Model 1 Profitt = a + b1 SOEt + b2 ADt + b3 CSt Model 2 Profitt = a + b1 SOEt + b2 ADt + b3 CSt + b4 ASSETt + b5 SALESt + b6 EMPLt + b7 SOEt*ADt + b8 SOEt*CSt Model 3 Profitt = a + b1 SOEt + b2 ASSETt + b3 SALESt + b4 EMPLt + b5 SOEt*ADt + b6 SOEt*CSt + b7 YEAR_1+ b8 YEAR_2 + b9 YEAR_3 + b10 YEAR_4 + b11 YEAR_5 + b12 YEAR_6 + b13 INDUSTRY_1 + b14 INDUSTRY_2 + b15 INDUSTRY_3 Model 4 Profitt = a + b1 SOEt + b2 ADt + b3 CSt + b4 ASSETt + b5 SALESt + b6 EMPLt + b7 SOEt*ADt + b8 SOEt*CSt+ b9 YEAR_1 + b10 YEAR_2 + b11 YEAR_3 + b12 YEAR_4 + b13 YEAR_5 + b14 YEAR_6 + b15 INDUSTRY_1 + b16 INDUSTRY_2 + b17 INDUSTRY_3 One year-lagged impact of SOE on profit was ana- lyzed using multivariate regression as following: Model 5 Profitt+1 = a + b1 SOEt + b2 ADt + b3 CSt Model 6 Profitt+1 = a + b1 SOEt + b2 ADt + b3 CSt + b4 ASSETt + b5 SALESt + b6 EMPLt + b7 SOEt*ADt + b8 SOEt*CSt Model 7 Profitt+1 = a + b1SOEt + b2 ADt + b3CSt + b4 ASSETt + b5 SALESt+ b6 EMPLt + b7 SOEt*ADt + b8 SOEt*CSt + b9 YEAR_1 + b10 YEAR_2 + b11 YEAR_3+ b12 YEAR_4 + b13 YEAR_5 + b14 YEAR_6 + b15 INDUSTRY_1 + b16 INDUSTRY_2 + b17 INDUSTRY_3 3.3 Data Description This study obtains data on total assets, total number of employees, total number of visits to web sites, total sales, customer satisfaction levels, advertising expenditure sand profitability for 70 observations of U.S. Inter- net-based business firms. For example, Amazon, Yahoo, Travelocity and NewYorkTimes.com are included to represent retail, portal, travel and news service firms, respectively. The data are obtained from various secon- dary sources. The multiple inputs and outputs chosen in this study are shown in Table 1. For computation of SOE, total annual assets and total Copyright © 2009 SciRes JSSM 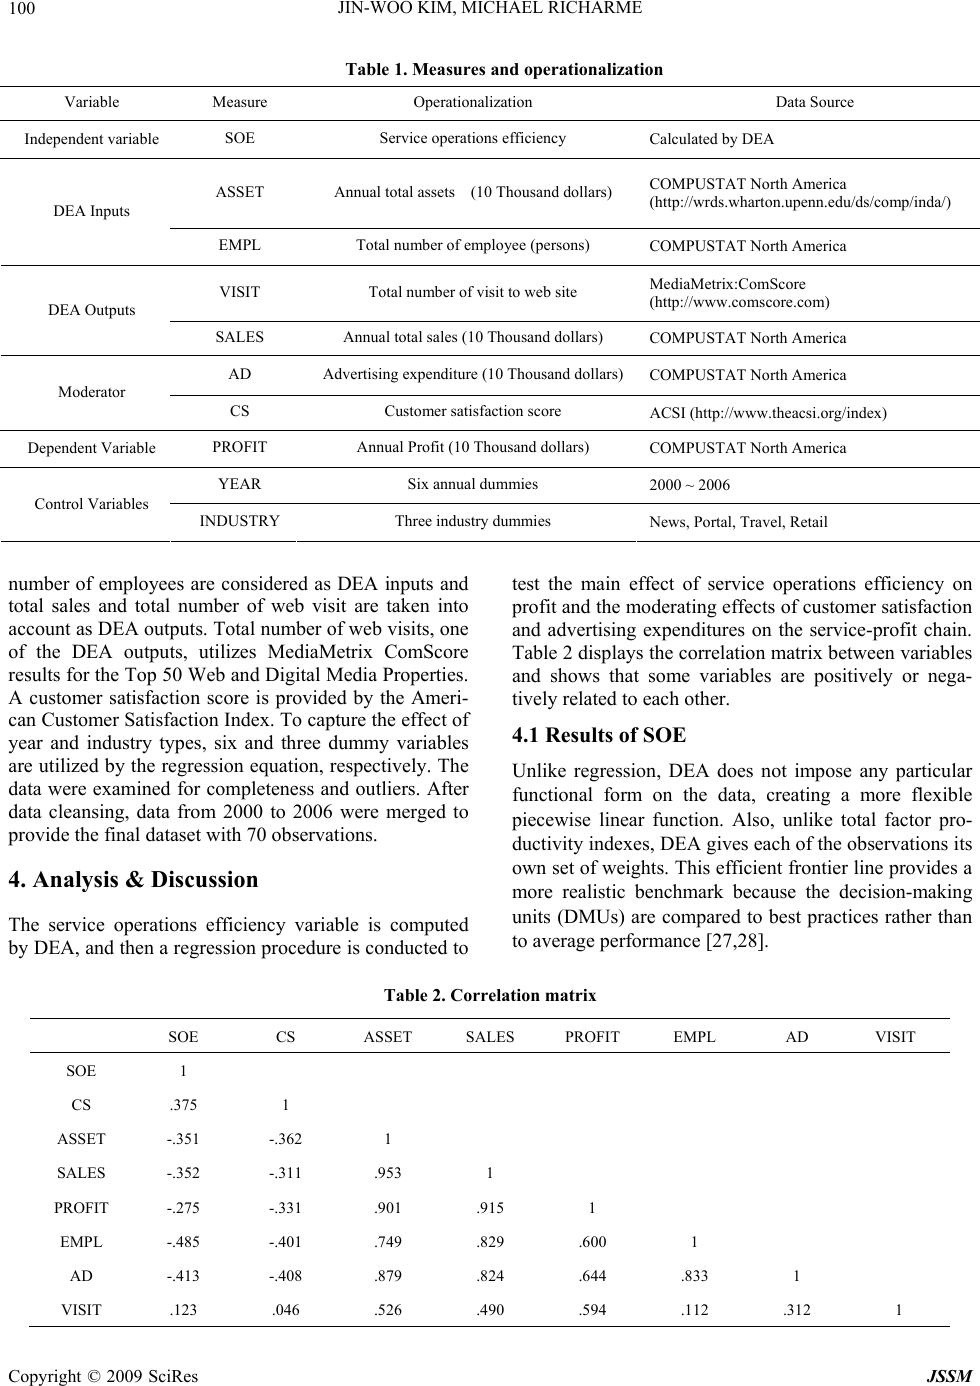 JIN-WOO KIM, MICHAEL RICHARME 100 Table 1. Measures and operationalization Variable Measure Operationalization Data Source Independent variable SOE Service operations efficiency Calculated by DEA ASSET Annual total assets (10 Thousand dollars) COMPUSTAT North America (http://wrds.wharton.upenn.edu/ds/comp/inda/) DEA Inputs EMPL Total number of employee (persons) COMPUSTAT North America VISIT Total number of visit to web site MediaMetrix:ComScore (http://www.comscore.com) DEA Outputs SALES Annual total sales (10 Thousand dollars) COMPUSTAT North America AD Advertising expenditure (10 Thousand dollars)COMPUSTAT North America Moderator CS Customer satisfaction score ACSI (http://www.theacsi.org/index) Dependent Variable PROFIT Annual Profit (10 Thousand dollars) COMPUSTAT North America YEAR Six annual dummies 2000 ~ 2006 Control Variables INDUSTRY Three industry dummies News, Portal, Travel, Retail number of employees are considered as DEA inputs and total sales and total number of web visit are taken into account as DEA outputs. Total number of web visits, one of the DEA outputs, utilizes MediaMetrix ComScore results for the Top 50 Web and Digital Media Properties. A customer satisfaction score is provided by the Ameri- can Customer Satisfaction Index. To capture the effect of year and industry types, six and three dummy variables are utilized by the regression equation, respectively. The data were examined for completeness and outliers. After data cleansing, data from 2000 to 2006 were merged to provide the final dataset with 70 observations. 4. Analysis & Discussion The service operations efficiency variable is computed by DEA, and then a regression procedure is conducted to test the main effect of service operations efficiency on profit and the moderating effects of customer satisfaction and advertising expenditures on the service-profit chain. Table 2 displays the correlation matrix between variables and shows that some variables are positively or nega- tively related to each other. 4.1 Results of SOE Unlike regression, DEA does not impose any particular functional form on the data, creating a more flexible piecewise linear function. Also, unlike total factor pro- ductivity indexes, DEA gives each of the observations its own set of weights. This efficient frontier line provides a more realistic benchmark because the decision-making units (DMUs) are compared to best practices rather than to average performance [27,28]. Table 2. Correlation matrix SOE CS ASSET SALES PROFIT EMPL AD VISIT SOE 1 CS .375 1 ASSET -.351 -.362 1 SALES -.352 -.311 .953 1 PROFIT -.275 -.331 .901 .915 1 EMPL -.485 -.401 .749 .829 .600 1 AD -.413 -.408 .879 .824 .644 .833 1 VISIT .123 .046 .526 .490 .594 .112 .312 1 Copyright © 2009 SciRes JSSM 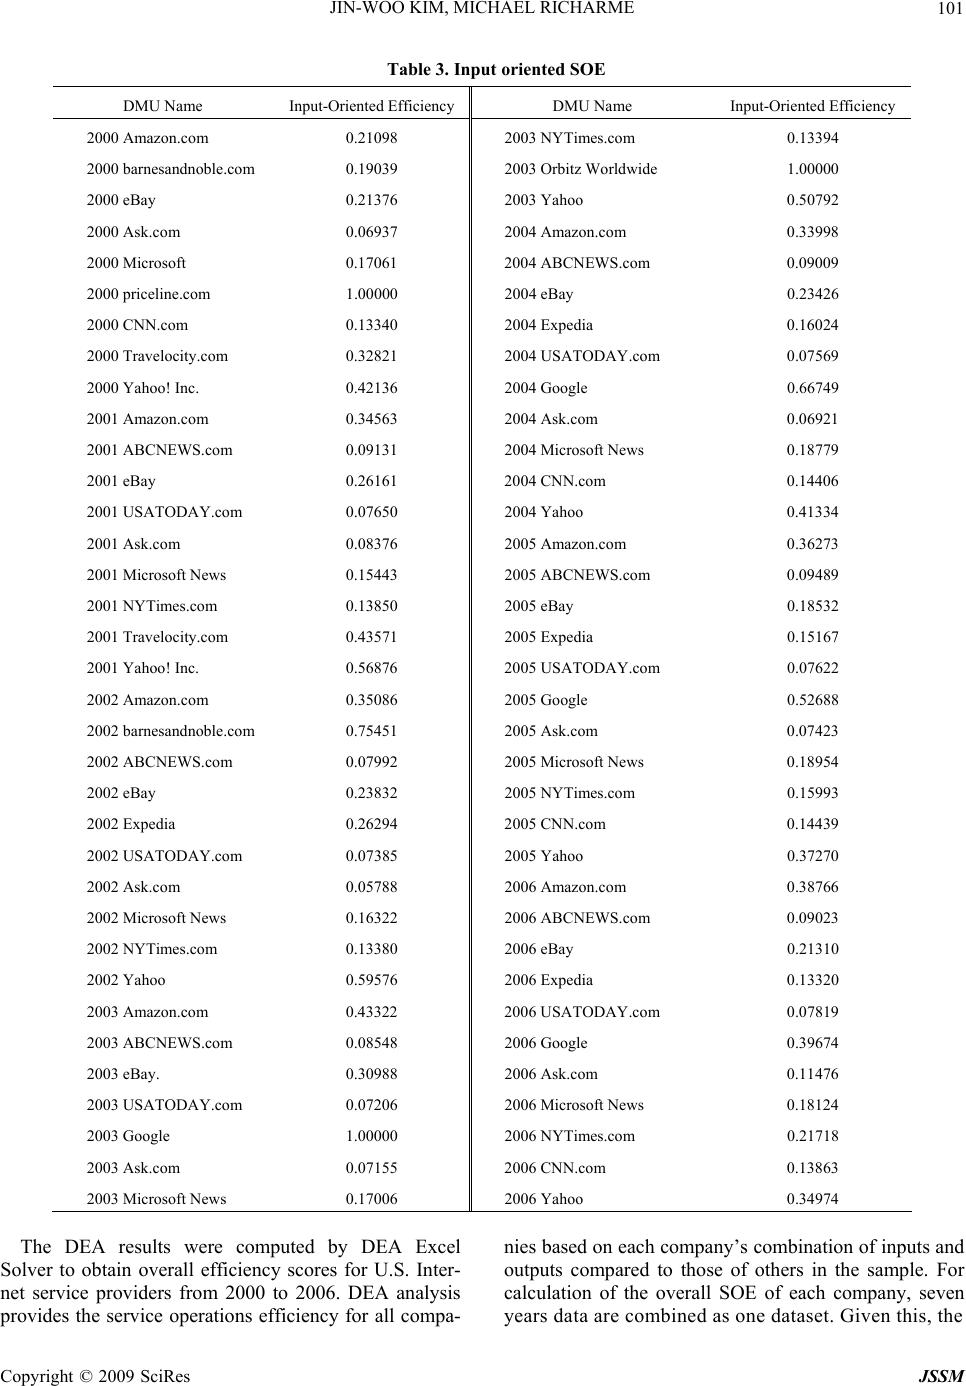 JIN-WOO KIM, MICHAEL RICHARME101 Table 3. Input oriented SOE DMU Name Input-Oriented EfficiencyDMU Name Input-Oriented Efficiency 2000 Amazon.com 0.21098 2003 NYTimes.com 0.13394 2000 barnesandnoble.com 0.19039 2003 Orbitz Worldwide 1.00000 2000 eBay 0.21376 2003 Yahoo 0.50792 2000 Ask.com 0.06937 2004 Amazon.com 0.33998 2000 Microsoft 0.17061 2004 ABCNEWS.com 0.09009 2000 priceline.com 1.00000 2004 eBay 0.23426 2000 CNN.com 0.13340 2004 Expedia 0.16024 2000 Travelocity.com 0.32821 2004 USATODAY.com 0.07569 2000 Yahoo! Inc. 0.42136 2004 Google 0.66749 2001 Amazon.com 0.34563 2004 Ask.com 0.06921 2001 ABCNEWS.com 0.09131 2004 Microsoft News 0.18779 2001 eBay 0.26161 2004 CNN.com 0.14406 2001 USATODAY.com 0.07650 2004 Yahoo 0.41334 2001 Ask.com 0.08376 2005 Amazon.com 0.36273 2001 Microsoft News 0.15443 2005 ABCNEWS.com 0.09489 2001 NYTimes.com 0.13850 2005 eBay 0.18532 2001 Travelocity.com 0.43571 2005 Expedia 0.15167 2001 Yahoo! Inc. 0.56876 2005 USATODAY.com 0.07622 2002 Amazon.com 0.35086 2005 Google 0.52688 2002 barnesandnoble.com 0.75451 2005 Ask.com 0.07423 2002 ABCNEWS.com 0.07992 2005 Microsoft News 0.18954 2002 eBay 0.23832 2005 NYTimes.com 0.15993 2002 Expedia 0.26294 2005 CNN.com 0.14439 2002 USATODAY.com 0.07385 2005 Yahoo 0.37270 2002 Ask.com 0.05788 2006 Amazon.com 0.38766 2002 Microsoft News 0.16322 2006 ABCNEWS.com 0.09023 2002 NYTimes.com 0.13380 2006 eBay 0.21310 2002 Yahoo 0.59576 2006 Expedia 0.13320 2003 Amazon.com 0.43322 2006 USATODAY.com 0.07819 2003 ABCNEWS.com 0.08548 2006 Google 0.39674 2003 eBay. 0.30988 2006 Ask.com 0.11476 2003 USATODAY.com 0.07206 2006 Microsoft News 0.18124 2003 Google 1.00000 2006 NYTimes.com 0.21718 2003 Ask.com 0.07155 2006 CNN.com 0.13863 2003 Microsoft News 0.17006 2006 Yahoo 0.34974 The DEA results were computed by DEA Excel Solver to obtain overall efficiency scores for U.S. Inter- net service providers from 2000 to 2006. DEA analysis provides the service operations efficiency for all compa- nies based on each company’s combination of inputs and outputs compared to those of others in the sample. For calculation of the overall SOE of each company, seven years data are combined as one dataset. Given this, the Copyright © 2009 SciRes JSSM 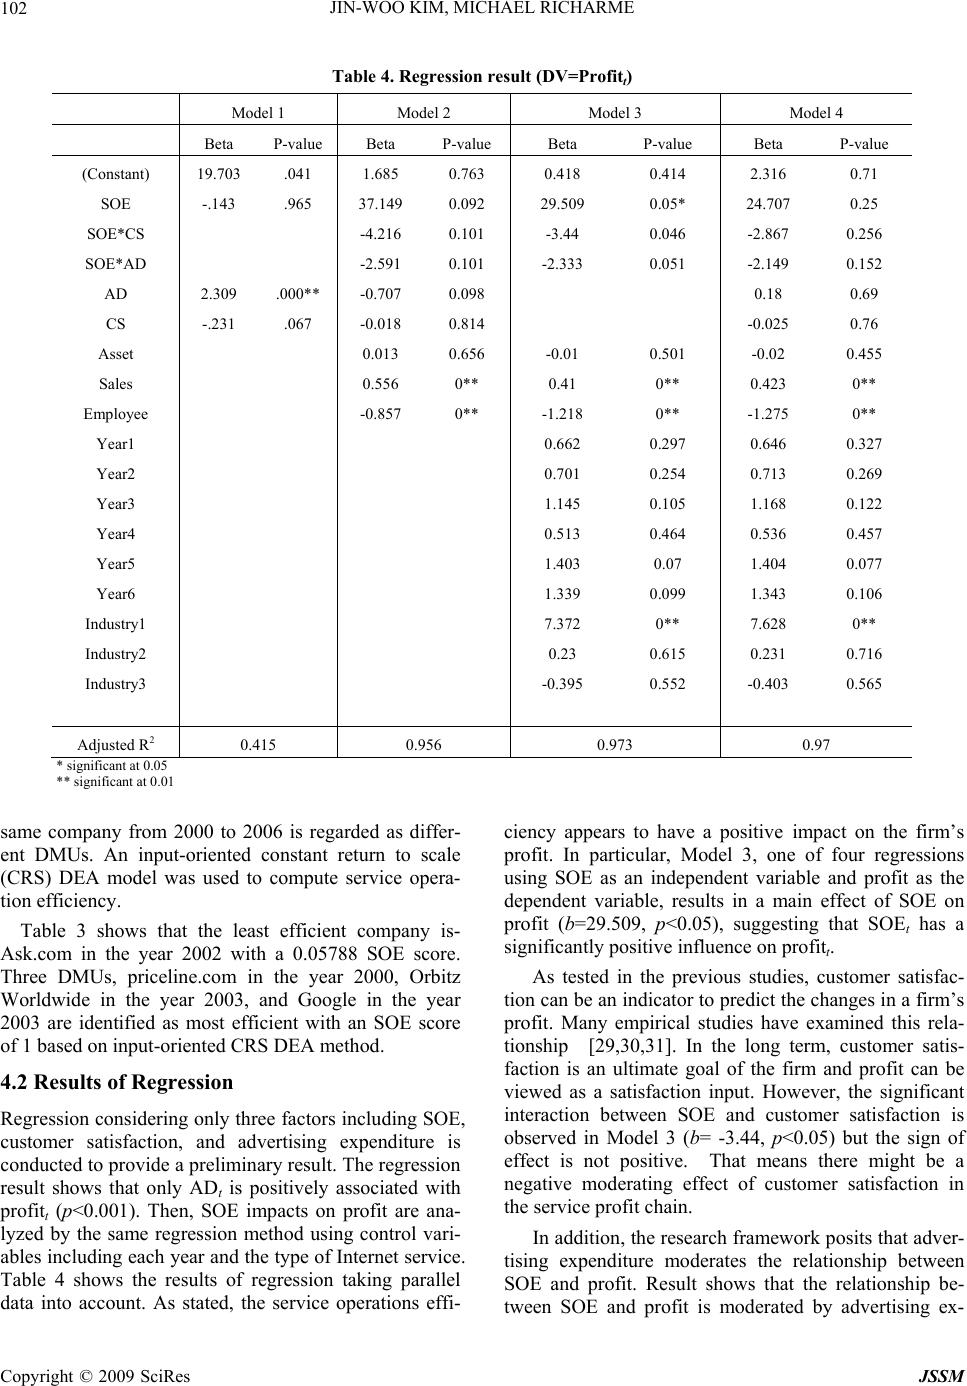 JIN-WOO KIM, MICHAEL RICHARME 102 Table 4. Regression result (DV=Profitt) Model 1 Model 2 Model 3 Model 4 Beta P-value Beta P-value Beta P-value Beta P-value (Constant) 19.703 .041 1.685 0.763 0.418 0.414 2.316 0.71 SOE -.143 .965 37.149 0.092 29.509 0.05* 24.707 0.25 SOE*CS -4.216 0.101 -3.44 0.046 -2.867 0.256 SOE*AD -2.591 0.101 -2.333 0.051 -2.149 0.152 AD 2.309 .000** -0.707 0.098 0.18 0.69 CS -.231 .067 -0.018 0.814 -0.025 0.76 Asset 0.013 0.656 -0.01 0.501 -0.02 0.455 Sales 0.556 0** 0.41 0** 0.423 0** Employee -0.857 0** -1.218 0** -1.275 0** Year1 0.662 0.297 0.646 0.327 Year2 0.701 0.254 0.713 0.269 Year3 1.145 0.105 1.168 0.122 Year4 0.513 0.464 0.536 0.457 Year5 1.403 0.07 1.404 0.077 Year6 1.339 0.099 1.343 0.106 Industry1 7.372 0** 7.628 0** Industry2 0.23 0.615 0.231 0.716 Industry3 -0.395 0.552 -0.403 0.565 Adjusted R2 0.415 0.956 0.973 0.97 * significant at 0.05 ** significant at 0.01 same company from 2000 to 2006 is regarded as differ- ent DMUs. An input-oriented constant return to scale (CRS) DEA model was used to compute service opera- tion efficiency. Table 3 shows that the least efficient company is- Ask.com in the year 2002 with a 0.05788 SOE score. Three DMUs, priceline.com in the year 2000, Orbitz Worldwide in the year 2003, and Google in the year 2003 are identified as most efficient with an SOE score of 1 based on input-oriented CRS DEA method. 4.2 Results of Regression Regression considering only three factors including SOE, customer satisfaction, and advertising expenditure is conducted to provide a preliminary result. The regression result shows that only ADt is positively associated with profitt (p<0.001). Then, SOE impacts on profit are ana- lyzed by the same regression method using control vari- ables including each year and the type of Internet service. Table 4 shows the results of regression taking parallel data into account. As stated, the service operations effi- ciency appears to have a positive impact on the firm’s profit. In particular, Model 3, one of four regressions using SOE as an independent variable and profit as the dependent variable, results in a main effect of SOE on profit (b=29.509, p<0.05), suggesting that SOEt has a significantly positive influence on profitt. As tested in the previous studies, customer satisfac- tion can be an indicator to predict the changes in a firm’s profit. Many empirical studies have examined this rela- tionship [29,30,31]. In the long term, customer satis- faction is an ultimate goal of the firm and profit can be viewed as a satisfaction input. However, the significant interaction between SOE and customer satisfaction is observed in Model 3 (b= -3.44, p<0.05) but the sign of effect is not positive. That means there might be a negative moderating effect of customer satisfaction in the service profit chain. In addition, the research framework posits that adver- tising expenditure moderates the relationship between SOE and profit. Result shows that the relationship be- tween SOE and profit is moderated by advertising ex- Copyright © 2009 SciRes JSSM 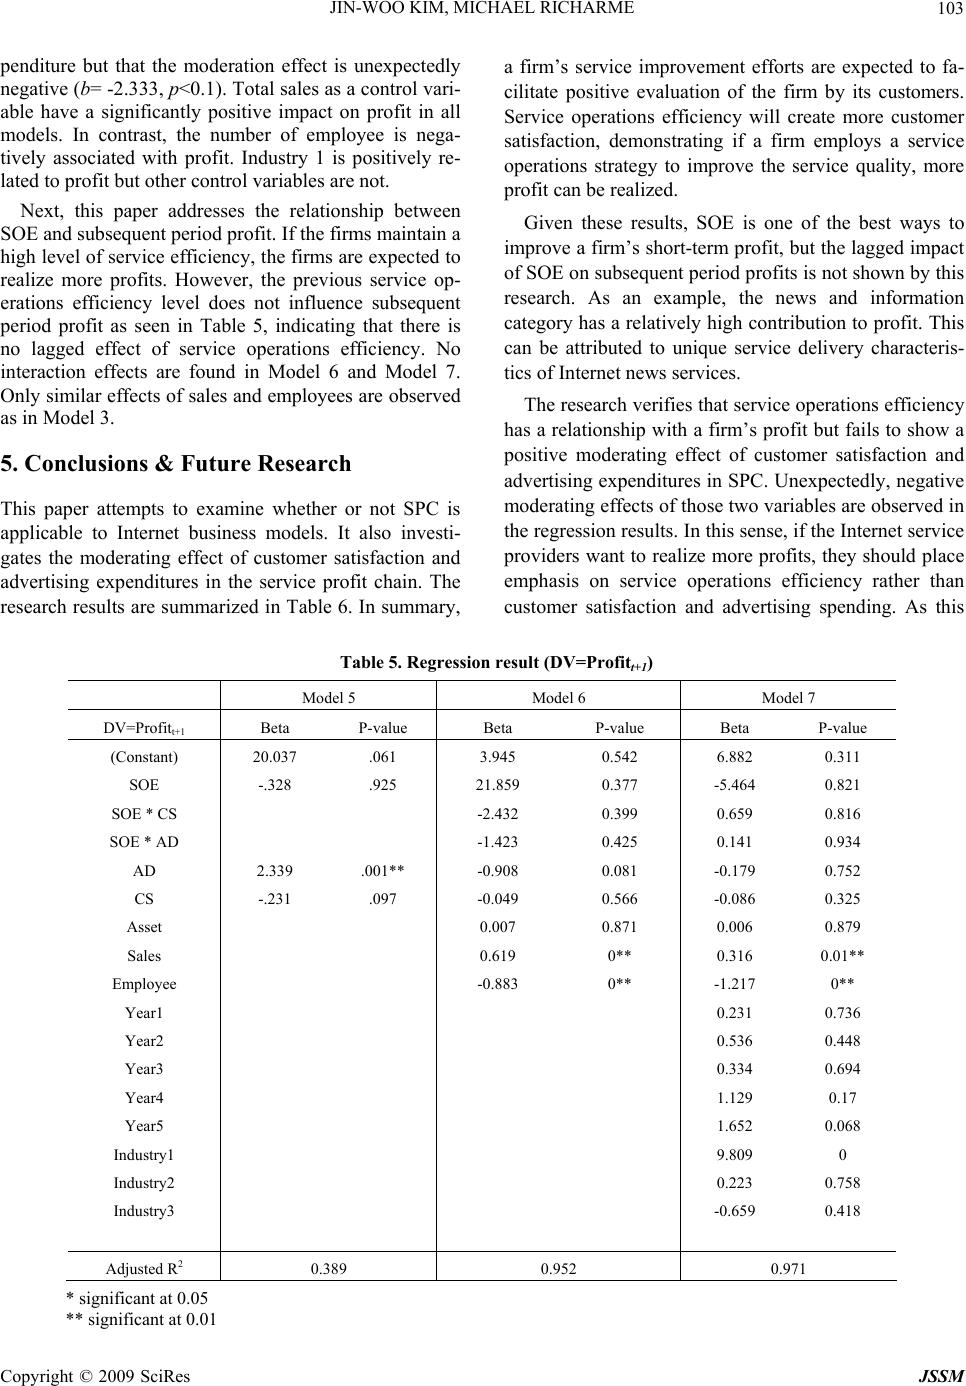 JIN-WOO KIM, MICHAEL RICHARME103 penditure but that the moderation effect is unexpectedly negative (b= -2.333, p<0.1). Total sales as a control vari- able have a significantly positive impact on profit in all models. In contrast, the number of employee is nega- tively associated with profit. Industry 1 is positively re- lated to profit but other control variables are not. Next, this paper addresses the relationship between SOE and subsequent period profit. If the firms maintain a high level of service efficiency, the firms are expected to realize more profits. However, the previous service op- erations efficiency level does not influence subsequent period profit as seen in Table 5, indicating that there is no lagged effect of service operations efficiency. No interaction effects are found in Model 6 and Model 7. Only similar effects of sales and employees are observed as in Model 3. 5. Conclusions & Future Research This paper attempts to examine whether or not SPC is applicable to Internet business models. It also investi- gates the moderating effect of customer satisfaction and advertising expenditures in the service profit chain. The research results are summarized in Table 6. In summary, a firm’s service improvement efforts are expected to fa- cilitate positive evaluation of the firm by its customers. Service operations efficiency will create more customer satisfaction, demonstrating if a firm employs a service operations strategy to improve the service quality, more profit can be realized. Given these results, SOE is one of the best ways to improve a firm’s short-term profit, but the lagged impact of SOE on subsequent period profits is not shown by this research. As an example, the news and information category has a relatively high contribution to profit. This can be attributed to unique service delivery characteris- tics of Internet news services. The research verifies that service operations efficiency has a relationship with a firm’s profit but fails to show a positive moderating effect of customer satisfaction and advertising expenditures in SPC. Unexpectedly, negative moderating effects of those two variables are observed in the regression results. In this sense, if the Internet service providers want to realize more profits, they should place emphasis on service operations efficiency rather than customer satisfaction and advertising spending. As this Table 5. Regression result (DV=Profitt+1) Model 5 Model 6 Model 7 DV=Profitt+1 Beta P-value Beta P-value Beta P-value (Constant) 20.037 .061 3.945 0.542 6.882 0.311 SOE -.328 .925 21.859 0.377 -5.464 0.821 SOE * CS -2.432 0.399 0.659 0.816 SOE * AD -1.423 0.425 0.141 0.934 AD 2.339 .001** -0.908 0.081 -0.179 0.752 CS -.231 .097 -0.049 0.566 -0.086 0.325 Asset 0.007 0.871 0.006 0.879 Sales 0.619 0** 0.316 0.01** Employee -0.883 0** -1.217 0** Year1 0.231 0.736 Year2 0.536 0.448 Year3 0.334 0.694 Year4 1.129 0.17 Year5 1.652 0.068 Industry1 9.809 0 Industry2 0.223 0.758 Industry3 -0.659 0.418 Adjusted R2 0.389 0.952 0.971 * significant at 0.05 ** significant at 0.01 Copyright © 2009 SciRes JSSM 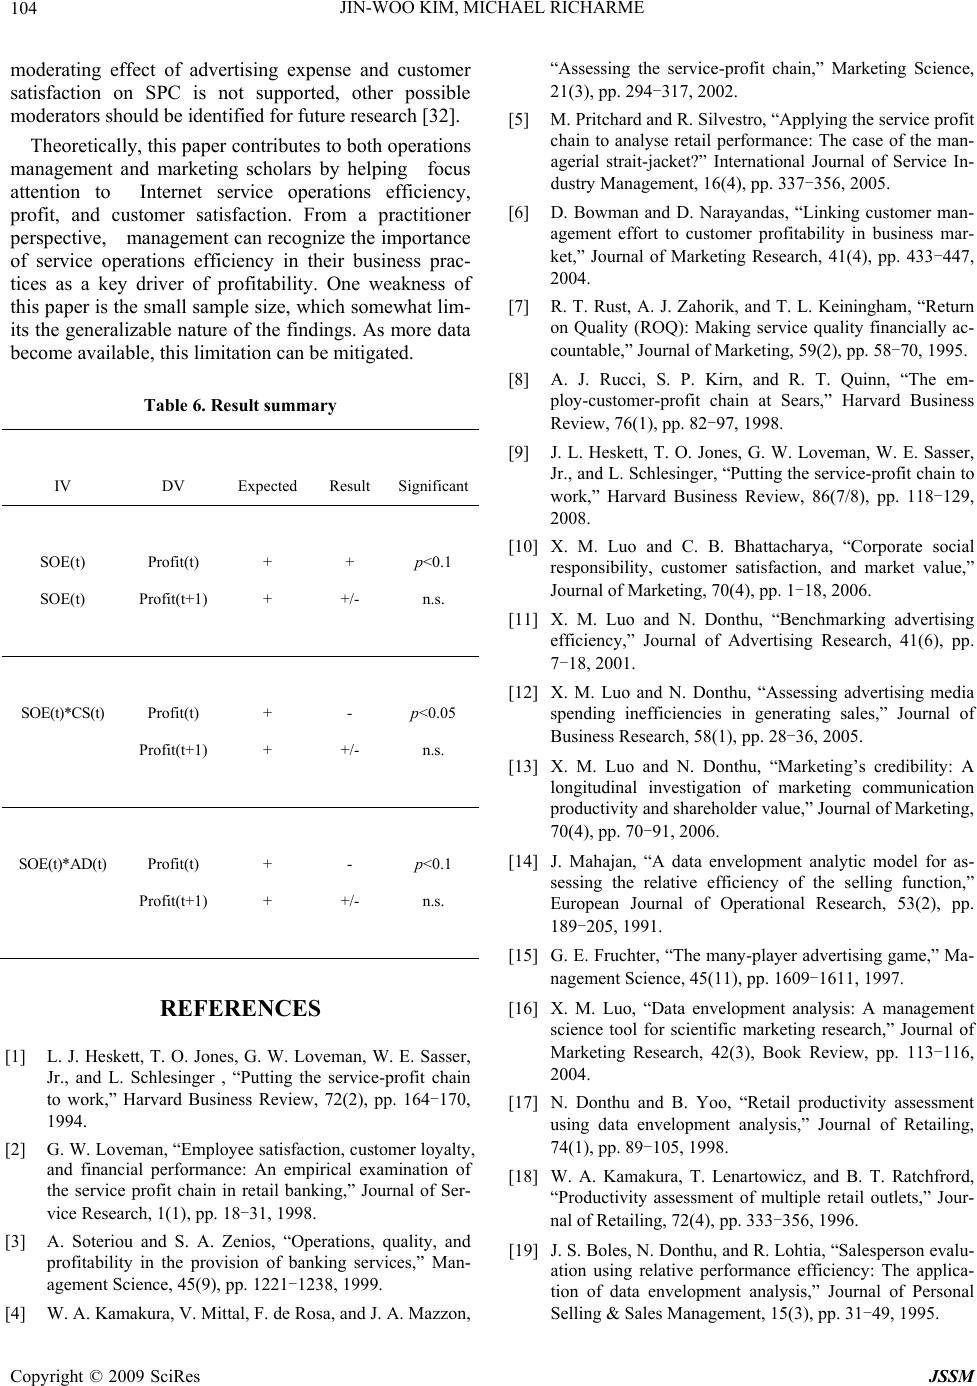 JIN-WOO KIM, MICHAEL RICHARME 104 moderating effect of advertising expense and customer satisfaction on SPC is not supported, other possible moderators should be identified for future research [32]. Theoretically, this paper contributes to both operations management and marketing scholars by helping focus attention to Internet service operations efficiency, profit, and customer satisfaction. From a practitioner perspective, management can recognize the importance of service operations efficiency in their business prac- tices as a key driver of profitability. One weakness of this paper is the small sample size, which somewhat lim- its the generalizable nature of the findings. As more data become available, this limitation can be mitigated. Table 6. Result summary IV DV Expected Result Significant SOE(t) Profit(t) + + p<0.1 SOE(t) Profit(t+1) + +/- n.s. SOE(t)*CS(t) Profit(t) + - p<0.05 Profit(t+1) + +/- n.s. SOE(t)*AD(t) Profit(t) + - p<0.1 Profit(t+1) + +/- n.s. REFERENCES [1] L. J. Heskett, T. O. Jones, G. W. Loveman, W. E. Sasser, Jr., and L. Schlesinger , “Putting the service-profit chain to work,” Harvard Business Review, 72(2), pp. 164-170, 1994. [2] G. W. Loveman, “Employee satisfaction, customer loyalty, and financial performance: An empirical examination of the service profit chain in retail banking,” Journal of Ser- vice Research, 1(1), pp. 18-31, 1998. [3] A. Soteriou and S. A. Zenios, “Operations, quality, and profitability in the provision of banking services,” Man- agement Science, 45(9), pp. 1221-1238, 1999. [4] W. A. Kamakura, V. Mittal, F. de Rosa, and J. A. Mazzon, “Assessing the service-profit chain,” Marketing Science, 21(3), pp. 294-317, 2002. [5] M. Pritchard and R. Silvestro, “Applying the service profit chain to analyse retail performance: The case of the man- agerial strait-jacket?” International Journal of Service In- dustry Management, 16(4), pp. 337-356, 2005. [6] D. Bowman and D. Narayandas, “Linking customer man- agement effort to customer profitability in business mar- ket,” Journal of Marketing Research, 41(4), pp. 433-447, 2004. [7] R. T. Rust, A. J. Zahorik, and T. L. Keiningham, “Return on Quality (ROQ): Making service quality financially ac- countable,” Journal of Marketing, 59(2), pp. 58-70, 1995. [8] A. J. Rucci, S. P. Kirn, and R. T. Quinn, “The em- ploy-customer-profit chain at Sears,” Harvard Business Review, 76(1), pp. 82-97, 1998. [9] J. L. Heskett, T. O. Jones, G. W. Loveman, W. E. Sasser, Jr., and L. Schlesinger, “Putting the service-profit chain to work,” Harvard Business Review, 86(7/8), pp. 118-129, 2008. [10] X. M. Luo and C. B. Bhattacharya, “Corporate social responsibility, customer satisfaction, and market value,” Journal of Marketing, 70(4), pp. 1-18, 2006. [11] X. M. Luo and N. Donthu, “Benchmarking advertising efficiency,” Journal of Advertising Research, 41(6), pp. 7-18, 2001. [12] X. M. Luo and N. Donthu, “Assessing advertising media spending inefficiencies in generating sales,” Journal of Business Research, 58(1), pp. 28-36, 2005. [13] X. M. Luo and N. Donthu, “Marketing’s credibility: A longitudinal investigation of marketing communication productivity and shareholder value,” Journal of Marketing, 70(4), pp. 70-91, 2006. [14] J. Mahajan, “A data envelopment analytic model for as- sessing the relative efficiency of the selling function,” European Journal of Operational Research, 53(2), pp. 189-205, 1991. [15] G. E. Fruchter, “The many-player advertising game,” Ma- nagement Science, 45(11), pp. 1609-1611, 1997. [16] X. M. Luo, “Data envelopment analysis: A management science tool for scientific marketing research,” Journal of Marketing Research, 42(3), Book Review, pp. 113-116, 2004. [17] N. Donthu and B. Yoo, “Retail productivity assessment using data envelopment analysis,” Journal of Retailing, 74(1), pp. 89-105, 1998. [18] W. A. Kamakura, T. Lenartowicz, and B. T. Ratchfrord, “Productivity assessment of multiple retail outlets,” Jour- nal of Retailing, 72(4), pp. 333-356, 1996. [19] J. S. Boles, N. Donthu, and R. Lohtia, “Salesperson evalu- ation using relative performance efficiency: The applica- tion of data envelopment analysis,” Journal of Personal Selling & Sales Management, 15(3), pp. 31-49, 1995. Copyright © 2009 SciRes JSSM  JIN-WOO KIM, MICHAEL RICHARME105 [20] B. K. Pilling, N. Donthu, and S. Henson, “Accounting for the impact of territory characteristics on sales performance: Relative efficiency as a measure of salesperson perform- ance,” Journal of Personal Selling and Sales Management, 19(2), pp. 35-45, 1999. [21] G. Reiner and P. Hofmann, “Efficiency analysis of supply chain processes,” International Journal of Production Re- search, 44(23), pp. 5065-5078, 2006. [22] Y. Chen, L. Liang, and F. Yang, “A DEA game model approach to supply chain efficiency,” Annals of Opera- tions Research, 145(1), pp. 5-13, 2006. [23] A. D. Ross and C. Droge, “An analysis of operations efficiency in large-scale distribution systems,” Journal of Operations Management, 21(6), pp. 673-688, 2004. [24] F. X. Frei and P. T. Harker, “Measuring the efficiency of service delivery processes: An application for retail bank- ing,” Journal of Service Research, 1(4), pp. 300-312, 1999. [25] D. Lien and Y. Peng, “Measuring the efficiency of search engines: An application of data envelopment analysis,” Applied Economics, 31(12), pp. 1581-1587, 1999. [26] M. Xue and P. T. Harker, “Customer efficiency: Concept and its impact on e-business management,” Journal of Service Research, 4(4), pp. 253-267, 2002. [27] J. Zhu, “Quantitative models for performance evaluations and benchmarking: Data envelopment analysis with spreadsheets and DEA EXCEL solver,” Norwell, MA: Kluwer Academic Publishers Group, 2003. [28] X. M. Luo and N. Donthu, “Benchmarking advertising efficiency,” Journal of Advertising Research, 41(6), pp. 7-18, 2001. [29] X. M. Luo and C. Homburg, “Neglected outcomes of customer satisfaction,” Journal of Marketing, 71(2), pp. 133-149, 2007. [30] V. Mittal, E. W. Anderson, P. Tadikamalla, and A. Sayrak, “Dual emphasis and the long-term financial impact of cus- tomer satisfaction,” Marketing Science, 24(4), pp. 544- 555, 2005. [31] B . Cooil, T. L. Keininham, L. Aksoy, and M. Hsu, “A longitudinal analysis of customer satisfaction and share of wallet: Investigating the moderating effect of customer characteristics,” Journal of Marketing, 71(1), pp. 67-83, 2007. [32] X. Y. Liu, “Study on service profit chain: Review and prospect,” Services Systems and Services Management, 1(1), pp. 429-434, 2005. [33] M. J. Farrell, “The measurement of productive effi- ciency,” Journal of the Royal Statistical Society Series A, 120(3), pp. 253-281, 1957. [34] A. Charnes, W. Cooper, and E. Rhodes, “Measuring the efficiency of decision making units,” European Journal of Operational Research, 3(6), pp. 429-444, 1978. Copyright © 2009 SciRes JSSM  JIN-WOO KIM, MICHAEL RICHARME 106 Appendix. Background and Applications of DEA Building on the ideas of Farrell (1957), the seminal work “Measuring the Efficiency of Decision-Making Units” by Charnes, Cooper & Rhodes (1978) applies linear pro- gramming to estimate an empirical production technol- ogy frontier for the first time [33, 34]. Since then, there have been a large number of books and journal articles written on DEA or applying DEA to various sets of problems. In addition to comparing efficiency across DMUs within an organization, DEA has been used to compare efficiency across firms. There are several types of DEA methodologies, with the most basic being CCR based on Charnes, Cooper & Rhoades. However there are also more sophisticated DEA methodologies which address varying returns to scale, either CRS (constant returns to scale) or VRS (variable returns to scale) [27]. Grounded in microeconomic theory, DEA efficiency provides guidelines and benchmarks for both public and private enterprises to achieve maximized desirable ends at minimized costs. DEA measurement has been used to evaluate and compare educational departments (schools, colleges and universities), health care (hospitals, clinics) prisons, agricultural production, banking, armed forces, sports, market research, transportation (highway mainte- nance), courts, benchmarking, index number construc- tion and many other applications. In addition, DEA optimizes on each individual obser- vation and provides a ratio score to indicate the relative efficiency performance against the set of Pareto-efficient frontiers. An efficient observation is one for which no other observations, or linear combination of observations in the sample, generate as much as or more outputs given the level of inputs (or consume as much as or less inputs given the level of outputs). DEA is best characterized by the following [16]: A focus on individual observations in contrast to populations average Production of single aggregate measure for each decision making unit (DMU) in terms of its input factors (independent variables) to produce desired outputs (dependent variables) Simultaneous use of multiple outputs and multiple inputs, where each is stated in different units of measurement Ability to adjust to exogenous variables Ability to incorporate categorical (dummy) vari- ables No required specification or knowledge of a priori weights or prices for the inputs or outputs and value free No restrictions on the functional form of the pro- duction relationship Ability to accommodate judgment when desired Production of specific estimates for desired changes in inputs and/or outputs for projecting DMUs below the efficient frontier onto the efficient frontier Pareto optimal A focus on the revealed best-practice frontier rather than on the central tendency properties of frontier Satisfaction of strict equity criteria in the relative evaluation of each DMU Relationship with performance evaluation and benchmarking Copyright © 2009 SciRes JSSM
|