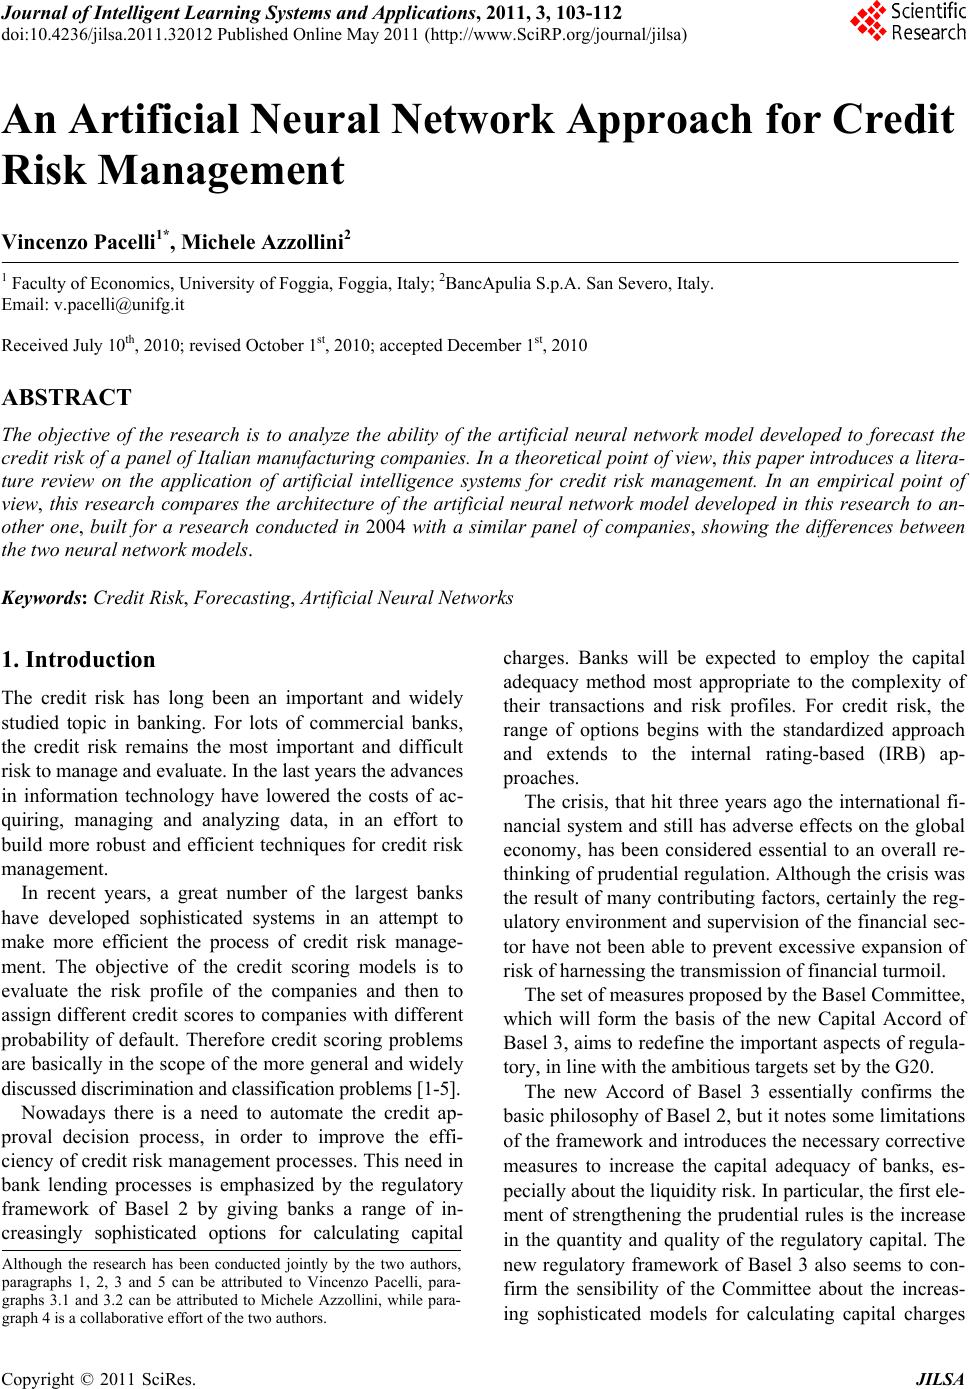
 Journal of Intelligent Learning Systems and Applications, 2011, 3, 103-112 doi:10.4236/jilsa.2011.32012 Published Online May 2011 (http://www.SciRP.org/journal/jilsa) Copyright © 2011 SciRes. JILSA An Artificial Neural Network Approach for Credit Risk Management Vincenzo Pacelli1*, Michele Azzollini2 1 Faculty of Economics, University of Foggia, Foggia, Italy; 2BancApulia S.p.A. San Severo, Italy. Email: v.pacelli@unifg.it Received July 10th, 2010; revised October 1st, 2010; accepted December 1st, 2010 ABSTRACT The objective of the research is to analyze the ability of the artificial neural network model developed to forecast the credit risk of a panel of Italian manufacturing companies. In a theoretical point of view, this paper introduces a litera- ture review on the application of artificial intelligence systems for credit risk management. In an empirical point of view, this research compares the architecture of the artificial neural network model developed in this research to an- other one, built for a research conducted in 2004 with a similar panel of companies, showing the differences between the two neural network models. Keywords: Credit Risk, Forecasting, Artificial Neural Networks 1. Introduction The credit risk has long been an important and widely studied topic in banking. For lots of commercial banks, the credit risk remains the most important and difficult risk to manage and evaluate. In the last years the advances in information technology have lowered the costs of ac- quiring, managing and analyzing data, in an effort to build more robust and efficient techniques for credit risk management. In recent years, a great number of the largest banks have developed sophisticated systems in an attempt to make more efficient the process of credit risk manage- ment. The objective of the credit scoring models is to evaluate the risk profile of the companies and then to assign different credit scores to companies with different probability of default. Therefore credit scoring problems are basically in the scope of the more general and widely discussed discrimination and classification problems [1-5]. Nowadays there is a need to automate the credit ap- proval decision process, in order to improve the effi- ciency of credit risk management processes. This need in bank lending processes is emphasized by the regulatory framework of Basel 2 by giving banks a range of in- creasingly sophisticated options for calculating capital charges. Banks will be expected to employ the capital adequacy method most appropriate to the complexity of their transactions and risk profiles. For credit risk, the range of options begins with the standardized approach and extends to the internal rating-based (IRB) ap- proaches. The crisis, that hit three years ago the international fi- nancial system and still has adverse effects on the global economy, has been considered essential to an overall re- thinking of prudential regulation. Although the crisis was the result of many contributing factors, certainly the reg- ulatory environment and supervision of the financial sec- tor have not been able to prevent excessive expansion of risk of harnessing the transmission of financial turmoil. The set of measures proposed by the Basel Committee, which will form the basis of the new Capital Accord of Basel 3, aims to redefine the important aspects of regula- tory, in line with the ambitious targets set by the G20. The new Accord of Basel 3 essentially confirms the basic philosophy of Basel 2, but it notes some limitations of the framework and introduces the necessary corrective measures to increase the capital adequacy of banks, es- pecially about the liquidity risk. In particular, the first ele- ment of strengthening the prudential rules is the increase in the quantity and quality of the regulatory capital. The new regulatory framework of Basel 3 also seems to con- firm the sensibility of the Committee about the increas- ing sophisticated models for calculating capital charges Although the research has been conducted jointly by the two authors, aragraphs 1, 2, 3 and 5 can be attributed to Vincenzo Pacelli, pa a- graphs 3.1 and 3.2 can be attributed to Michele Azzollini, while para- graph 4 is a collaborative effort of the two authors. 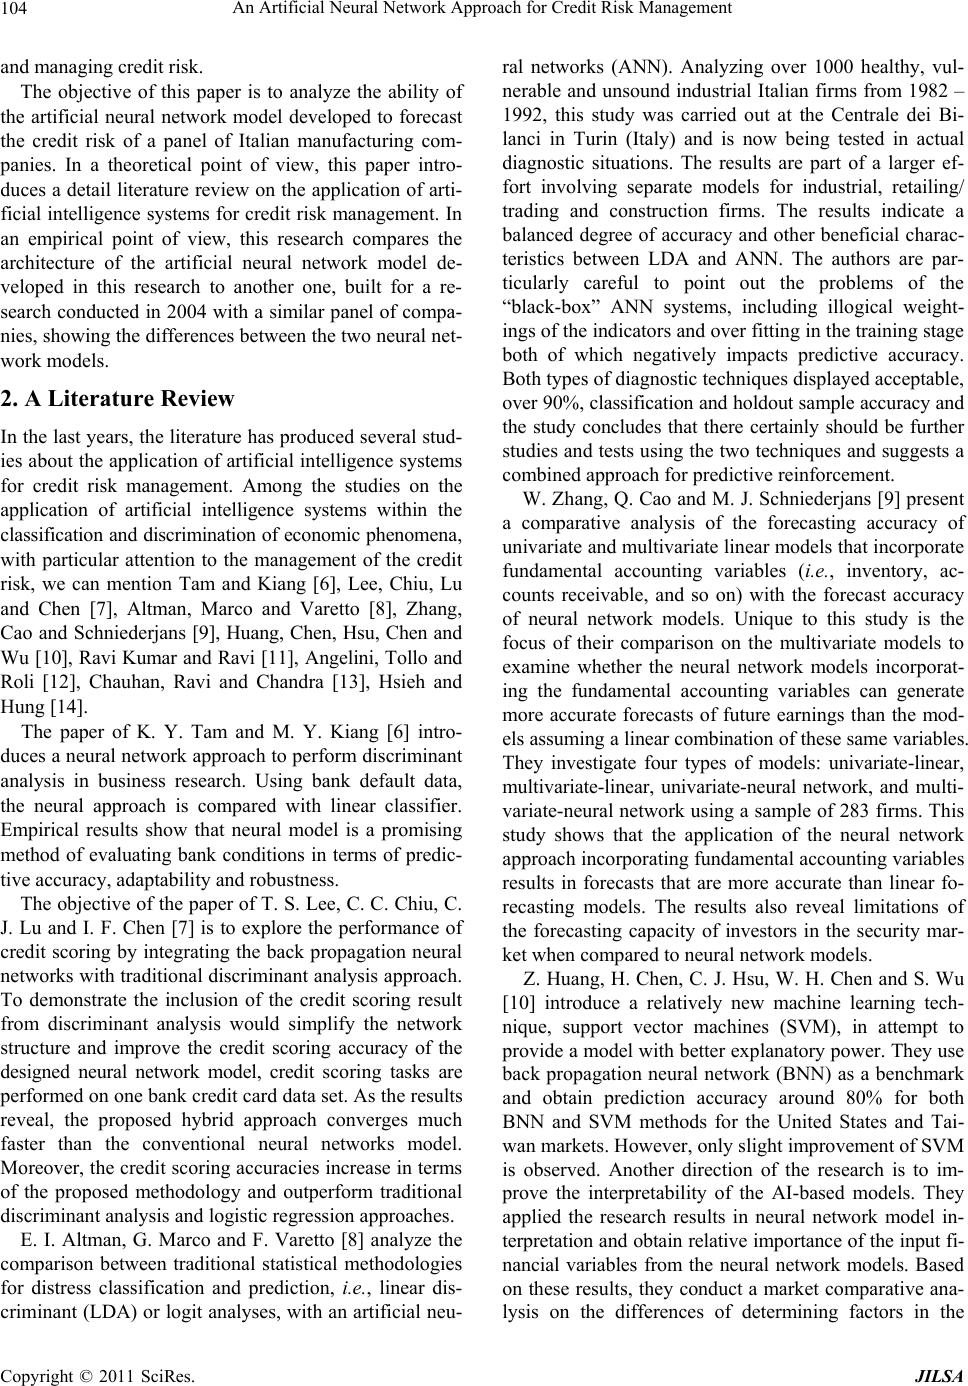 An Artificial Neural Network Approach for Credit Risk Management 104 and managing credit risk. The objective of this paper is to analyze the ability of the artificial neural network model developed to forecast the credit risk of a panel of Italian manufacturing com- panies. In a theoretical point of view, this paper intro- duces a detail literature review on the application of arti- ficial intelligence systems for credit risk management. In an empirical point of view, this research compares the architecture of the artificial neural network model de- veloped in this research to another one, built for a re- search conducted in 2004 with a similar panel of compa- nies, showing the differences between the two neural net- work models. 2. A Literature Review In the last years, the literature has produced several stud- ies about the application of artificial intelligence systems for credit risk management. Among the studies on the application of artificial intelligence systems within the classification and discrimination of economic phenomena, with particular attention to the management of the credit risk, we can mention Tam and Kiang [6], Lee, Chiu, Lu and Chen [7], Altman, Marco and Varetto [8], Zhang, Cao and Schniederjans [9], Huang, Chen, Hsu, Chen and Wu [10], Ravi Kumar and Ravi [11], Angelini, Tollo and Roli [12], Chauhan, Ravi and Chandra [13], Hsieh and Hung [14]. The paper of K. Y. Tam and M. Y. Kiang [6] intro- duces a neural network approach to perform discriminant analysis in business research. Using bank default data, the neural approach is compared with linear classifier. Empirical results show that neural model is a promising method of evaluating bank conditions in terms of predic- tive accuracy, adaptability and robustness. The objective of the paper of T. S. Lee, C. C. Chiu, C. J. Lu and I. F. Chen [7] is to explore the performance of credit scoring by integrating the back propagation neural networks with traditional discriminant analysis approach. To demonstrate the inclusion of the credit scoring result from discriminant analysis would simplify the network structure and improve the credit scoring accuracy of the designed neural network model, credit scoring tasks are performed on one bank credit card data set. As the results reveal, the proposed hybrid approach converges much faster than the conventional neural networks model. Moreover, the credit scoring accuracies increase in terms of the proposed methodology and outperform traditional discriminant analysis and logistic regression approaches. E. I. Altman, G. Marco and F. Varetto [8] analyze the comparison between traditional statistical methodologies for distress classification and prediction, i.e., linear dis- criminant (LDA) or logit analyses, with an artificial neu- ral networks (ANN). Analyzing over 1000 healthy, vul- nerable and unsound industrial Italian firms from 1982 – 1992, this study was carried out at the Centrale dei Bi- lanci in Turin (Italy) and is now being tested in actual diagnostic situations. The results are part of a larger ef- fort involving separate models for industrial, retailing/ trading and construction firms. The results indicate a balanced degree of accuracy and other beneficial charac- teristics between LDA and ANN. The authors are par- ticularly careful to point out the problems of the “black-box” ANN systems, including illogical weight- ings of the indicators and over fitting in the training stage both of which negatively impacts predictive accuracy. Both types of diagnostic techniques displayed acceptable, over 90%, classification and holdout sample accuracy and the study concludes that there certainly should be further studies and tests using the two techniques and suggests a combined approach for predictive reinforcement. W. Zhang, Q. Cao and M. J. Schniederjans [9] present a comparative analysis of the forecasting accuracy of univariate and multivariate linear models that incorporate fundamental accounting variables (i.e., inventory, ac- counts receivable, and so on) with the forecast accuracy of neural network models. Unique to this study is the focus of their comparison on the multivariate models to examine whether the neural network models incorporat- ing the fundamental accounting variables can generate more accurate forecasts of future earnings than the mod- els assuming a linear combination of these same variables. They investigate four types of models: univariate-linear, multivariate-linear, univariate-neural network, and multi- variate-neural network using a sample of 283 firms. This study shows that the application of the neural network approach incorporating fundamental accounting variables results in forecasts that are more accurate than linear fo- recasting models. The results also reveal limitations of the forecasting capacity of investors in the security mar- ket when compared to neural network models. Z. Huang, H. Chen, C. J. Hsu, W. H. Chen and S. Wu [10] introduce a relatively new machine learning tech- nique, support vector machines (SVM), in attempt to provide a model with better explanatory power. They use back propagation neural network (BNN) as a benchmark and obtain prediction accuracy around 80% for both BNN and SVM methods for the United States and Tai- wan markets. However, only slight improvement of SVM is observed. Another direction of the research is to im- prove the interpretability of the AI-based models. They applied the research results in neural network model in- terpretation and obtain relative importance of the input fi- nancial variables from the neural network models. Based on these results, they conduct a market comparative ana- lysis on the differences of determining factors in the Copyright © 2011 SciRes. JILSA 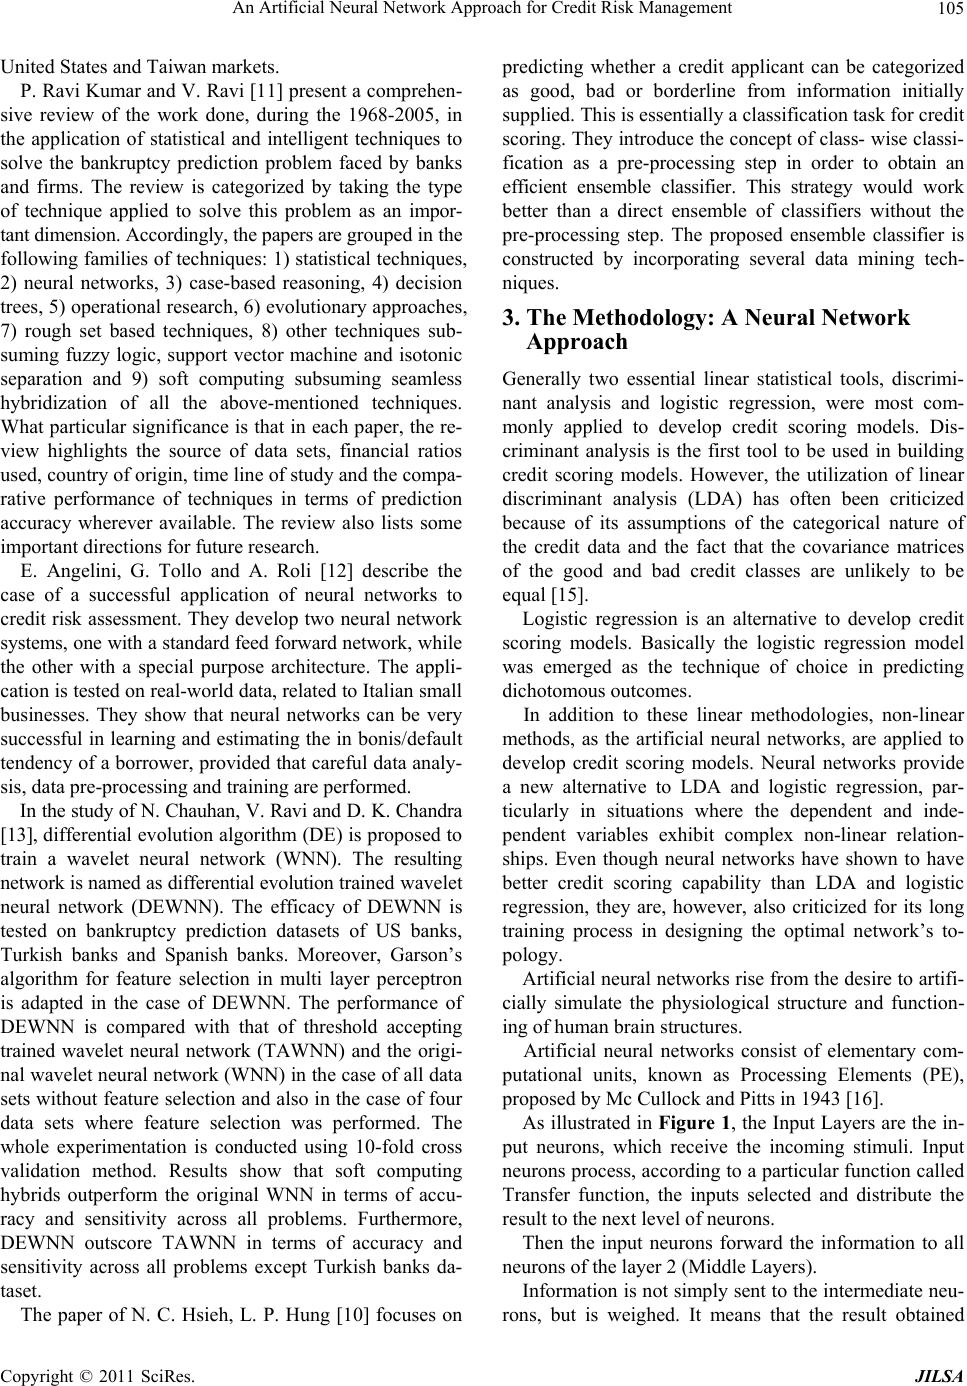 An Artificial Neural Network Approach for Credit Risk Management105 United States and Taiwan markets. P. Ravi Kumar and V. Ravi [11] present a comprehen- sive review of the work done, during the 1968-2005, in the application of statistical and intelligent techniques to solve the bankruptcy prediction problem faced by banks and firms. The review is categorized by taking the type of technique applied to solve this problem as an impor- tant dimension. Accordingly, the papers are grouped in the following families of techniques: 1) statistical techniques, 2) neural networks, 3) case-based reasoning, 4) decision trees, 5) operational research, 6) evolutionary approaches, 7) rough set based techniques, 8) other techniques sub- suming fuzzy logic, support vector machine and isotonic separation and 9) soft computing subsuming seamless hybridization of all the above-mentioned techniques. What particular significance is that in each paper, the re- view highlights the source of data sets, financial ratios used, country of origin, time line of study and the compa- rative performance of techniques in terms of prediction accuracy wherever available. The review also lists some important directions for future research. E. Angelini, G. Tollo and A. Roli [12] describe the case of a successful application of neural networks to credit risk assessment. They develop two neural network systems, one with a standard feed forward network, while the other with a special purpose architecture. The appli- cation is tested on real-world data, related to Italian small businesses. They show that neural networks can be very successful in learning and estimating the in bonis/default tendency of a borrower, provided that careful data analy- sis, data pre-processing and training are performed. In the study of N. Chauhan, V. Ravi and D. K. Chandra [13], differential evolution algorithm (DE) is proposed to train a wavelet neural network (WNN). The resulting network is named as differential evolution trained wavelet neural network (DEWNN). The efficacy of DEWNN is tested on bankruptcy prediction datasets of US banks, Turkish banks and Spanish banks. Moreover, Garson’s algorithm for feature selection in multi layer perceptron is adapted in the case of DEWNN. The performance of DEWNN is compared with that of threshold accepting trained wavelet neural network (TAWNN) and the origi- nal wavelet neural network (WNN) in the case of all data sets without feature selection and also in the case of four data sets where feature selection was performed. The whole experimentation is conducted using 10-fold cross validation method. Results show that soft computing hybrids outperform the original WNN in terms of accu- racy and sensitivity across all problems. Furthermore, DEWNN outscore TAWNN in terms of accuracy and sensitivity across all problems except Turkish banks da- taset. The paper of N. C. Hsieh, L. P. Hung [10] focuses on predicting whether a credit applicant can be categorized as good, bad or borderline from information initially supplied. This is essentially a classification task for credit scoring. They introduce the concept of class- wise classi- fication as a pre-processing step in order to obtain an efficient ensemble classifier. This strategy would work better than a direct ensemble of classifiers without the pre-processing step. The proposed ensemble classifier is constructed by incorporating several data mining tech- niques. 3. The Methodology: A Neural Network Approach Generally two essential linear statistical tools, discrimi- nant analysis and logistic regression, were most com- monly applied to develop credit scoring models. Dis- criminant analysis is the first tool to be used in building credit scoring models. However, the utilization of linear discriminant analysis (LDA) has often been criticized because of its assumptions of the categorical nature of the credit data and the fact that the covariance matrices of the good and bad credit classes are unlikely to be equal [15]. Logistic regression is an alternative to develop credit scoring models. Basically the logistic regression model was emerged as the technique of choice in predicting dichotomous outcomes. In addition to these linear methodologies, non-linear methods, as the artificial neural networks, are applied to develop credit scoring models. Neural networks provide a new alternative to LDA and logistic regression, par- ticularly in situations where the dependent and inde- pendent variables exhibit complex non-linear relation- ships. Even though neural networks have shown to have better credit scoring capability than LDA and logistic regression, they are, however, also criticized for its long training process in designing the optimal network’s to- pology. Artificial neural networks rise from the desire to artifi- cially simulate the physiological structure and function- ing of human brain structures. Artificial neural networks consist of elementary com- putational units, known as Processing Elements (PE), proposed by Mc Cullock and Pitts in 1943 [16]. As illustrated in Figure 1, the Input Layers are the in- put neurons, which receive the incoming stimuli. Input neurons process, according to a particular function called Transfer function, the inputs selected and distribute the result to the next level of neurons. Then the input neurons forward the information to all neurons of the layer 2 (Middle Layers). Information is not simply sent to the intermediate neu- rons, but is weighed. It means that the result obtained Copyright © 2011 SciRes. JILSA 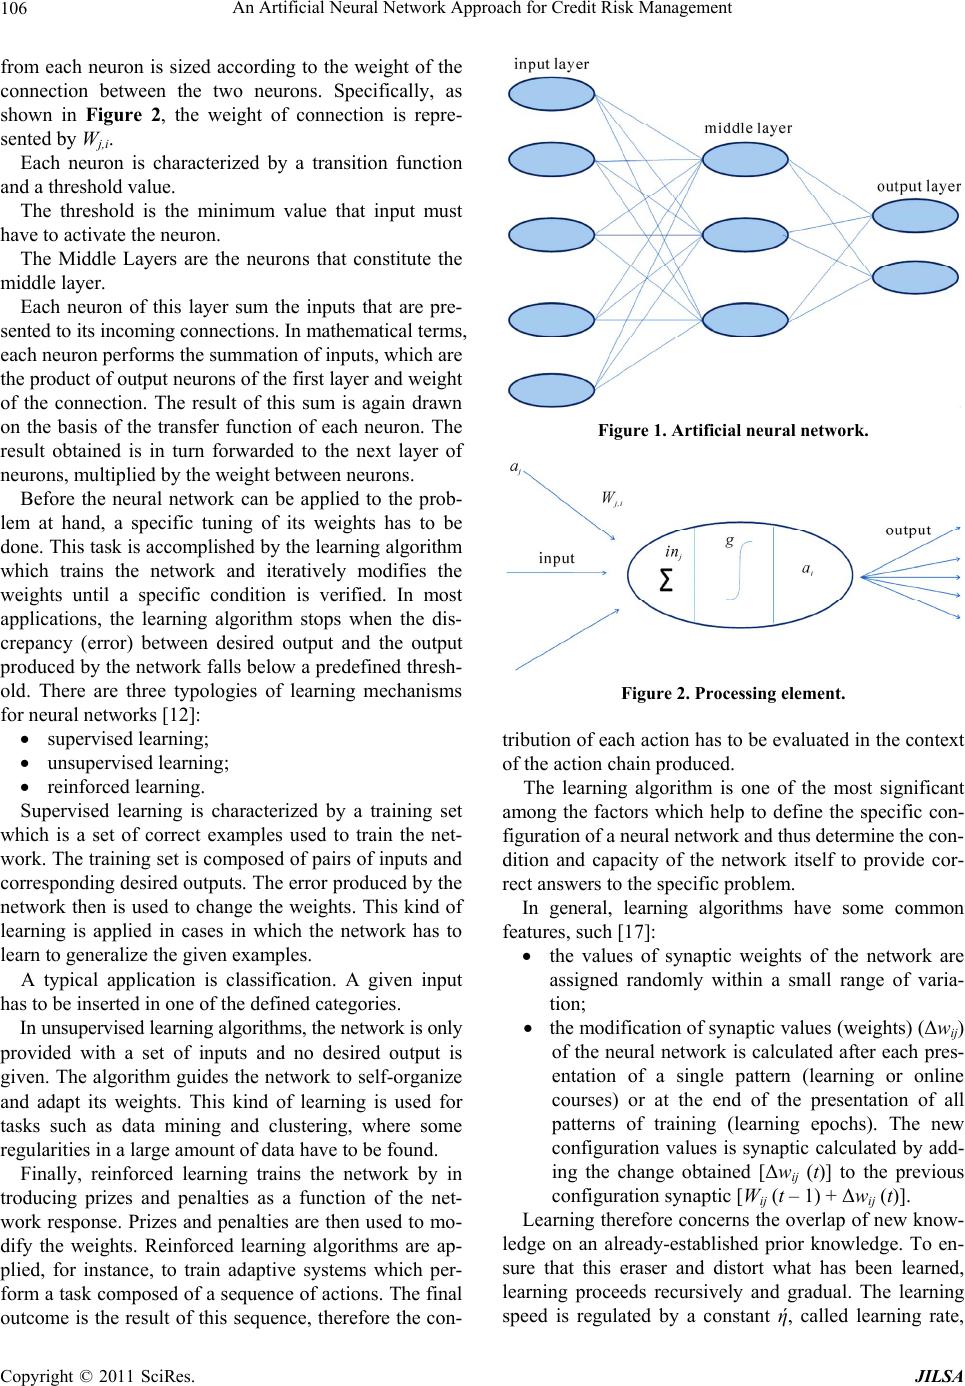 An Artificial Neural Network Approach for Credit Risk Management 106 from each neuron is sized according to the weight of the connection between the two neurons. Specifically, as shown in Figure 2, the weight of connection is repre- sented by Wj,i. Each neuron is characterized by a transition function and a threshold value. The threshold is the minimum value that input must have to activate the neuron. The Middle Layers are the neurons that constitute the middle layer. Each neuron of this layer sum the inputs that are pre- sented to its incoming connections. In mathematical terms, each neuron performs the summation of inputs, which are the product of output neurons of the first layer and weight of the connection. The result of this sum is again drawn on the basis of the transfer function of each neuron. The result obtained is in turn forwarded to the next layer of neurons, multiplied by the weight between neurons. Before the neural network can be applied to the prob- lem at hand, a specific tuning of its weights has to be done. This task is accomplished by the learning algorithm which trains the network and iteratively modifies the weights until a specific condition is verified. In most applications, the learning algorithm stops when the dis- crepancy (error) between desired output and the output produced by the network falls below a predefined thresh- old. There are three typologies of learning mechanisms for neural networks [12]: supervised learning; unsupervised learning; reinforced learning. Supervised learning is characterized by a training set which is a set of correct examples used to train the net- work. The training set is composed of pairs of inputs and corresponding desired outputs. The error produced by the network then is used to change the weights. This kind of learning is applied in cases in which the network has to learn to generalize the given examples. A typical application is classification. A given input has to be inserted in one of the defined categories. In unsupervised learning algorithms, the network is only provided with a set of inputs and no desired output is given. The algorithm guides the network to self-organize and adapt its weights. This kind of learning is used for tasks such as data mining and clustering, where some regularities in a large amount of data have to be found. Finally, reinforced learning trains the network by in troducing prizes and penalties as a function of the net- work response. Prizes and penalties are then used to mo- dify the weights. Reinforced learning algorithms are ap- plied, for instance, to train adaptive systems which per- form a task composed of a sequence of actions. The final outcome is the result of this sequence, therefore the con- Figure 1. Artificial neural network. Figure 2. Processing element. tribution of each action has to be evaluated in the context of the action chain produced. The learning algorithm is one of the most significant among the factors which help to define the specific con- figuration of a neural network and thus determine the con- dition and capacity of the network itself to provide cor- rect answers to the specific problem. In general, learning algorithms have some common features, such [17]: the values of synaptic weights of the network are assigned randomly within a small range of varia- tion; the modification of synaptic values (weights) (Δwij) of the neural network is calculated after each pres- entation of a single pattern (learning or online courses) or at the end of the presentation of all patterns of training (learning epochs). The new configuration values is synaptic calculated by add- ing the change obtained [Δwij (t)] to the previous configuration synaptic [Wij (t – 1) + Δwij (t)]. Learning therefore concerns the overlap of new know- ledge on an already-established prior knowledge. To en- sure that this eraser and distort what has been learned, learning proceeds recursively and gradual. The learning speed is regulated by a constant ή, called learning rate, Copyright © 2011 SciRes. JILSA 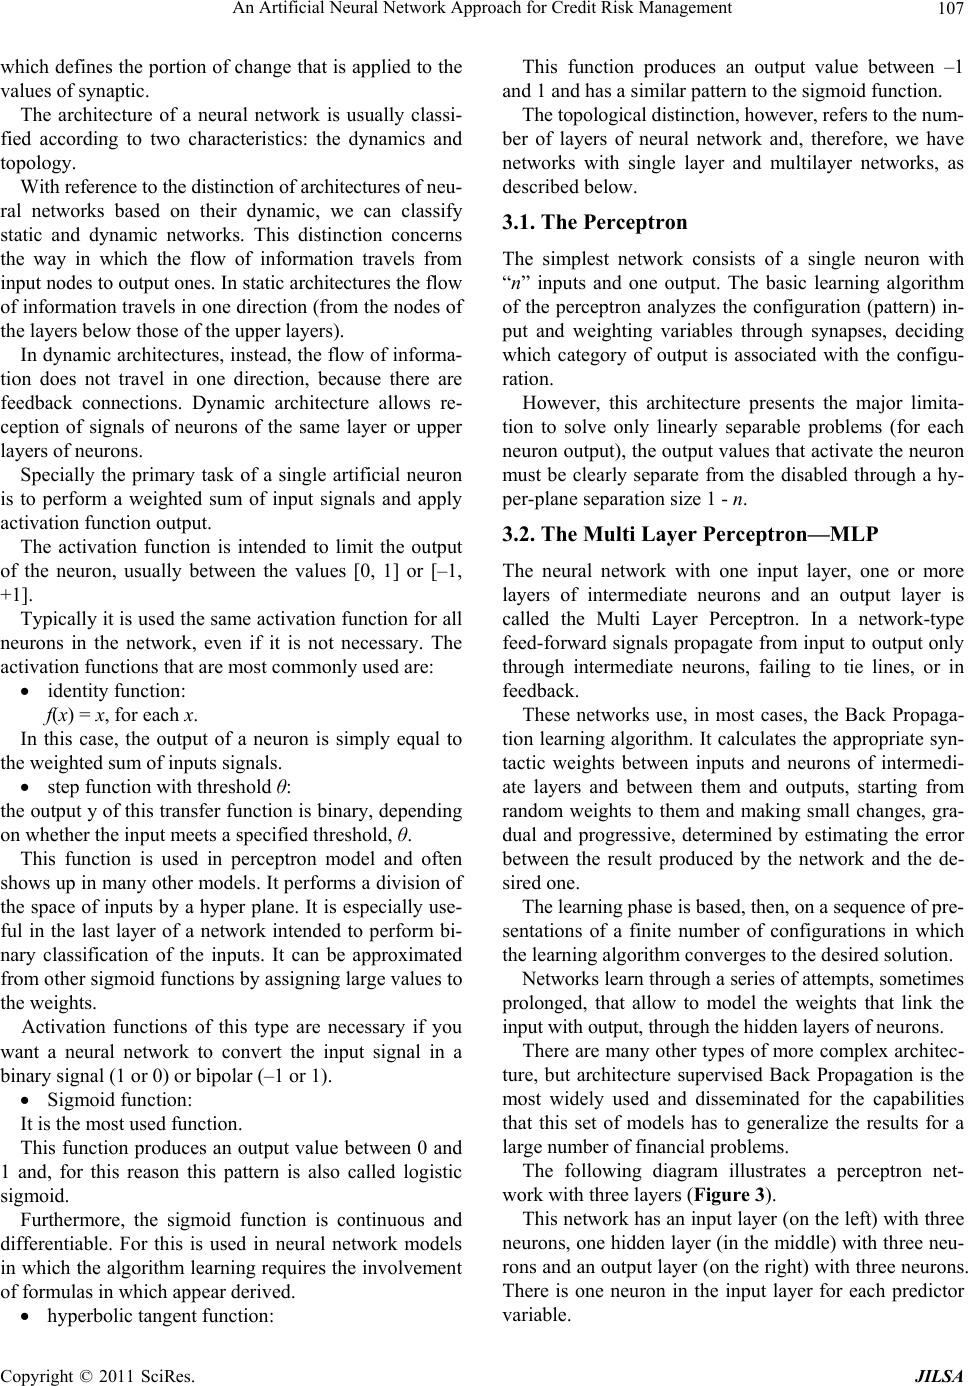 An Artificial Neural Network Approach for Credit Risk Management107 which defines the portion of change that is applied to the values of synaptic. The architecture of a neural network is usually classi- fied according to two characteristics: the dynamics and topology. With reference to the distinction of architectures of neu- ral networks based on their dynamic, we can classify static and dynamic networks. This distinction concerns the way in which the flow of information travels from input nodes to output ones. In static architectures the flow of information travels in one direction (from the nodes of the layers below those of the upper layers). In dynamic architectures, instead, the flow of informa- tion does not travel in one direction, because there are feedback connections. Dynamic architecture allows re- ception of signals of neurons of the same layer or upper layers of neurons. Specially the primary task of a single artificial neuron is to perform a weighted sum of input signals and apply activation function output. The activation function is intended to limit the output of the neuron, usually between the values [0, 1] or [–1, +1]. Typically it is used the same activation function for all neurons in the network, even if it is not necessary. The activation functions that are most commonly used are: identity function: f(x) = x, for each x. In this case, the output of a neuron is simply equal to the weighted sum of inputs signals. step function with threshold θ: the output y of this transfer function is binary, depending on whether the input meets a specified threshold, θ. This function is used in perceptron model and often shows up in many other models. It performs a division of the space of inputs by a hyper plane. It is especially use- ful in the last layer of a network intended to perform bi- nary classification of the inputs. It can be approximated from other sigmoid functions by assigning large values to the weights. Activation functions of this type are necessary if you want a neural network to convert the input signal in a binary signal (1 or 0) or bipolar (–1 or 1). Sigmoid function: It is the most used function. This function produces an output value between 0 and 1 and, for this reason this pattern is also called logistic sigmoid. Furthermore, the sigmoid function is continuous and differentiable. For this is used in neural network models in which the algorithm learning requires the involvement of formulas in which appear derived. hyperbolic tangent function: This function produces an output value between –1 and 1 and has a similar pattern to the sigmoid function. The topological distinction, however, refers to the num- ber of layers of neural network and, therefore, we have networks with single layer and multilayer networks, as described below. 3.1. The Perceptron The simplest network consists of a single neuron with “n” inputs and one output. The basic learning algorithm of the perceptron analyzes the configuration (pattern) in- put and weighting variables through synapses, deciding which category of output is associated with the configu- ration. However, this architecture presents the major limita- tion to solve only linearly separable problems (for each neuron output), the output values that activate the neuron must be clearly separate from the disabled through a hy- per-plane separation size 1 - n. 3.2. The Multi Layer Perceptron—MLP The neural network with one input layer, one or more layers of intermediate neurons and an output layer is called the Multi Layer Perceptron. In a network-type feed-forward signals propagate from input to output only through intermediate neurons, failing to tie lines, or in feedback. These networks use, in most cases, the Back Propaga- tion learning algorithm. It calculates the appropriate syn- tactic weights between inputs and neurons of intermedi- ate layers and between them and outputs, starting from random weights to them and making small changes, gra- dual and progressive, determined by estimating the error between the result produced by the network and the de- sired one. The learning phase is based, then, on a sequence of pre- sentations of a finite number of configurations in which the learning algorithm converges to the desired solution. Networks learn through a series of attempts, sometimes prolonged, that allow to model the weights that link the input with output, through the hidden layers of neurons. There are many other types of more complex architec- ture, but architecture supervised Back Propagation is the most widely used and disseminated for the capabilities that this set of models has to generalize the results for a large number of financial problems. The following diagram illustrates a perceptron net- work with three layers (Figure 3). This network has an input layer (on the left) with three neurons, one hidden layer (in the middle) with three neu- rons and an output layer (on the right) with three neurons. There is one neuron in the input layer for each predictor variable. Copyright © 2011 SciRes. JILSA 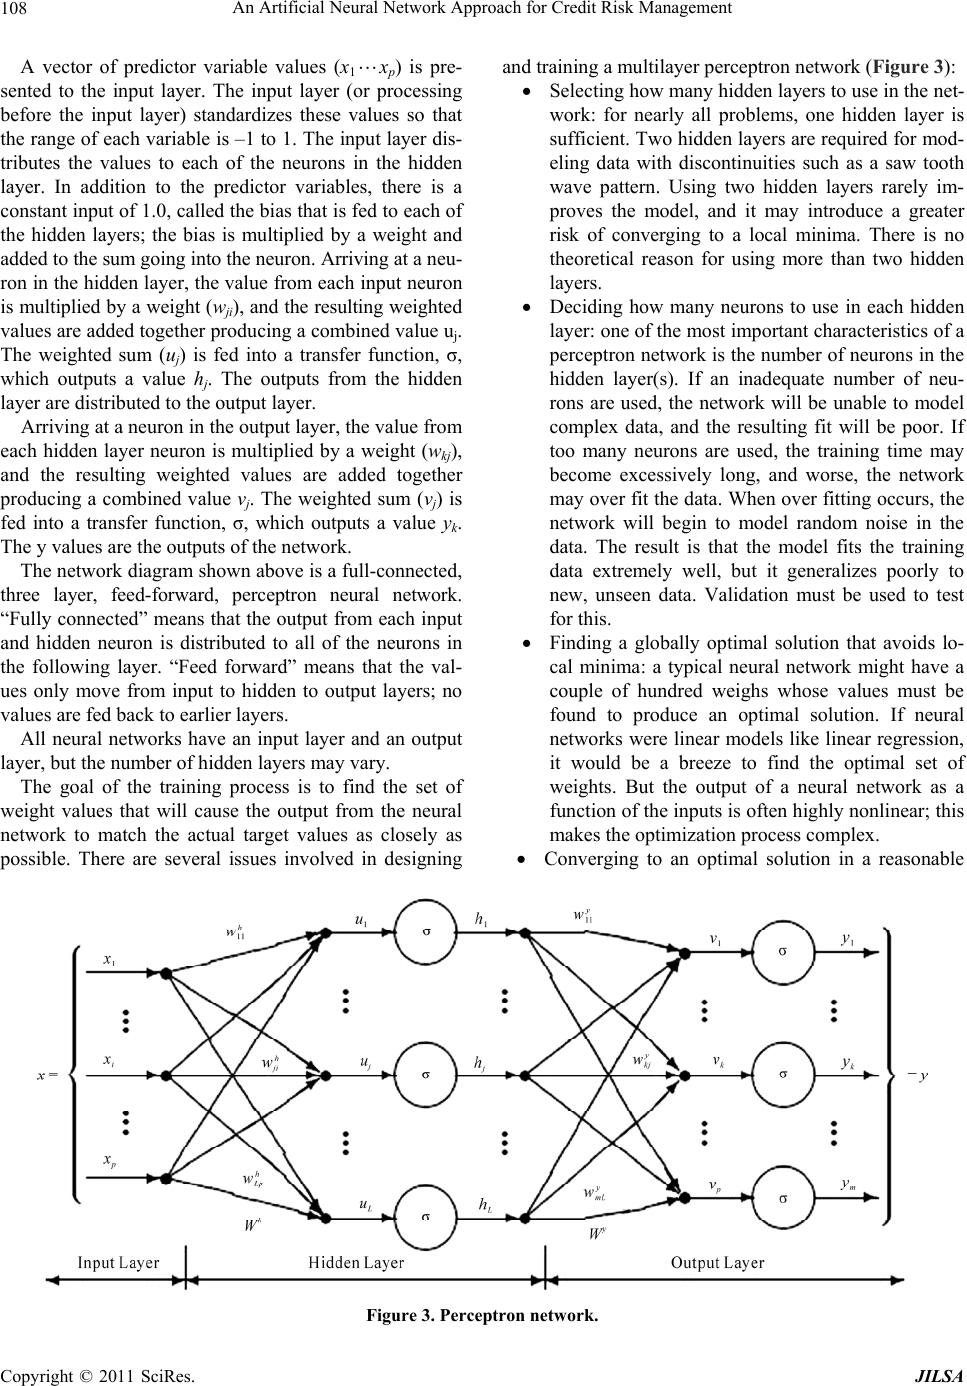 An Artificial Neural Network Approach for Credit Risk Management Copyright © 2011 SciRes. JILSA 108 A vector of predictor variable values (x1xp) is pre- sented to the input layer. The input layer (or processing before the input layer) standardizes these values so that the range of each variable is –1 to 1. The input layer dis- tributes the values to each of the neurons in the hidden layer. In addition to the predictor variables, there is a constant input of 1.0, called the bias that is fed to each of the hidden layers; the bias is multiplied by a weight and added to the sum going into the neuron. Arriving at a neu- ron in the hidden layer, the value from each input neuron is multiplied by a weight (wji), and the resulting weighted values are added together producing a combined value uj. The weighted sum (uj) is fed into a transfer function, σ, which outputs a value hj. The outputs from the hidden layer are distributed to the output layer. Arriving at a neuron in the output layer, the value from each hidden layer neuron is multiplied by a weight (wkj), and the resulting weighted values are added together producing a combined value vj. The weighted sum (vj) is fed into a transfer function, σ, which outputs a value yk. The y values are the outputs of the network. The network diagram shown above is a full-connected, three layer, feed-forward, perceptron neural network. “Fully connected” means that the output from each input and hidden neuron is distributed to all of the neurons in the following layer. “Feed forward” means that the val- ues only move from input to hidden to output layers; no values are fed back to earlier layers. All neural networks have an input layer and an output layer, but the number of hidden layers may vary. The goal of the training process is to find the set of weight values that will cause the output from the neural network to match the actual target values as closely as possible. There are several issues involved in designing and training a multilayer perceptron network (Figure 3): Selecting how many hidden layers to use in the net- work: for nearly all problems, one hidden layer is sufficient. Two hidden layers are required for mod- eling data with discontinuities such as a saw tooth wave pattern. Using two hidden layers rarely im- proves the model, and it may introduce a greater risk of converging to a local minima. There is no theoretical reason for using more than two hidden layers. Deciding how many neurons to use in each hidden layer: one of the most important characteristics of a perceptron network is the number of neurons in the hidden layer(s). If an inadequate number of neu- rons are used, the network will be unable to model complex data, and the resulting fit will be poor. If too many neurons are used, the training time may become excessively long, and worse, the network may over fit the data. When over fitting occurs, the network will begin to model random noise in the data. The result is that the model fits the training data extremely well, but it generalizes poorly to new, unseen data. Validation must be used to test for this. Finding a globally optimal solution that avoids lo- cal minima: a typical neural network might have a couple of hundred weighs whose values must be found to produce an optimal solution. If neural networks were linear models like linear regression, it would be a breeze to find the optimal set of weights. But the output of a neural network as a function of the inputs is often highly nonlinear; this makes the optimization process complex. Converging to an optimal solution in a reasonable Figure 3. Perceptron network. 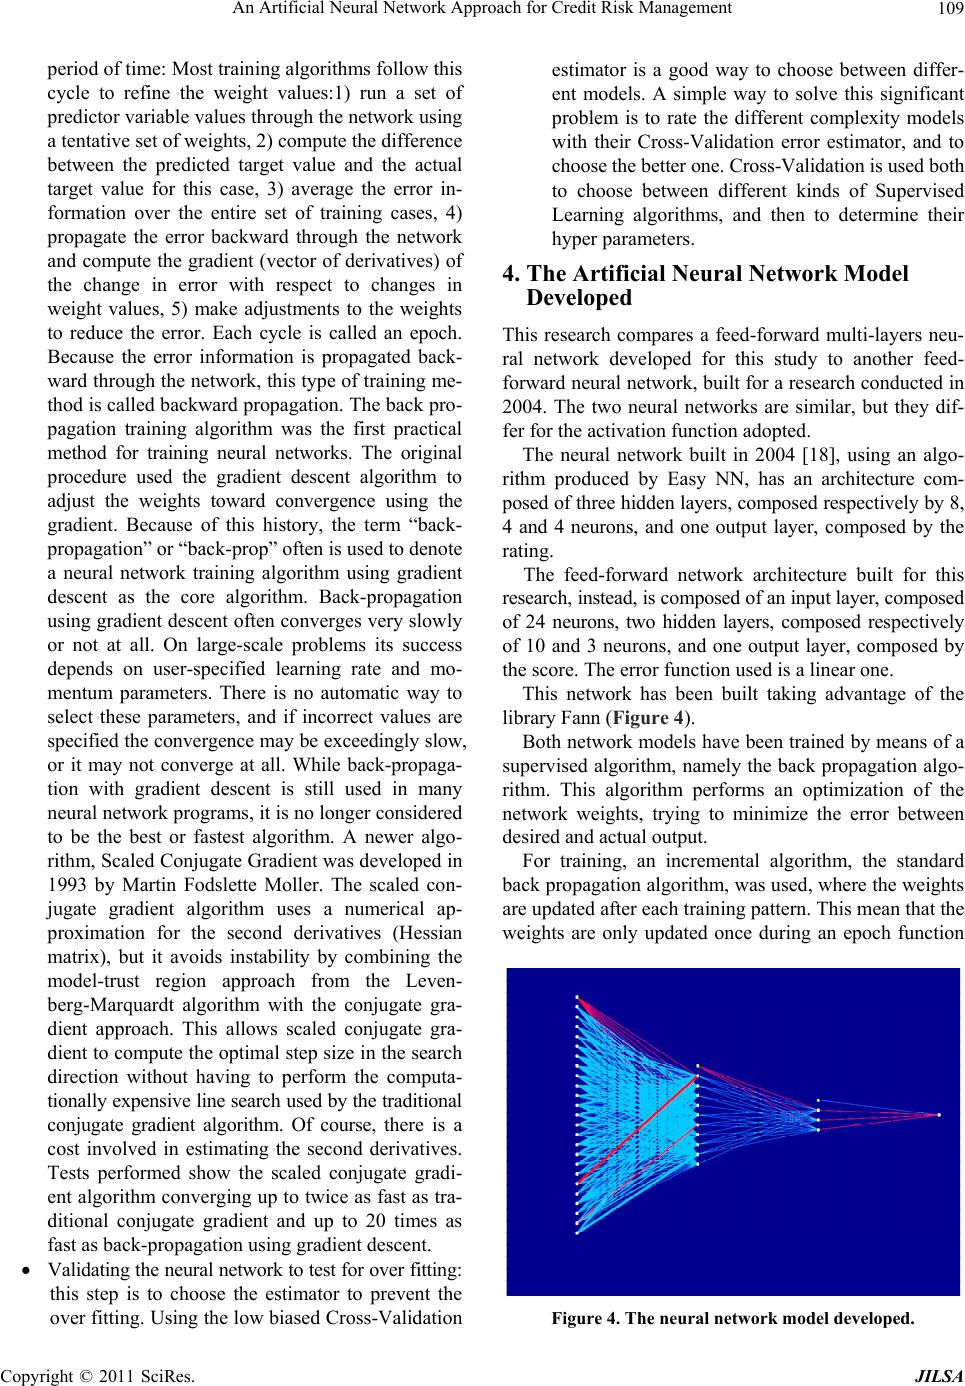 An Artificial Neural Network Approach for Credit Risk Management109 period of time: Most training algorithms follow this cycle to refine the weight values:1) run a set of predictor variable values through the network using a tentative set of weights, 2) compute the difference between the predicted target value and the actual target value for this case, 3) average the error in- formation over the entire set of training cases, 4) propagate the error backward through the network and compute the gradient (vector of derivatives) of the change in error with respect to changes in weight values, 5) make adjustments to the weights to reduce the error. Each cycle is called an epoch. Because the error information is propagated back- ward through the network, this type of training me- thod is called backward propagation. The back pro- pagation training algorithm was the first practical method for training neural networks. The original procedure used the gradient descent algorithm to adjust the weights toward convergence using the gradient. Because of this history, the term “back- propagation” or “back-prop” often is used to denote a neural network training algorithm using gradient descent as the core algorithm. Back-propagation using gradient descent often converges very slowly or not at all. On large-scale problems its success depends on user-specified learning rate and mo- mentum parameters. There is no automatic way to select these parameters, and if incorrect values are specified the convergence may be exceedingly slow, or it may not converge at all. While back-propaga- tion with gradient descent is still used in many neural network programs, it is no longer considered to be the best or fastest algorithm. A newer algo- rithm, Scaled Conjugate Gradient was developed in 1993 by Martin Fodslette Moller. The scaled con- jugate gradient algorithm uses a numerical ap- proximation for the second derivatives (Hessian matrix), but it avoids instability by combining the model-trust region approach from the Leven- berg-Marquardt algorithm with the conjugate gra- dient approach. This allows scaled conjugate gra- dient to compute the optimal step size in the search direction without having to perform the computa- tionally expensive line search used by the traditional conjugate gradient algorithm. Of course, there is a cost involved in estimating the second derivatives. Tests performed show the scaled conjugate gradi- ent algorithm converging up to twice as fast as tra- ditional conjugate gradient and up to 20 times as fast as back-propagation using gradient descent. Validating the neural network to test for over fitting: this step is to choose the estimator to prevent the over fitting. Using the low biased Cross-Validation estimator is a good way to choose between differ- ent models. A simple way to solve this significant problem is to rate the different complexity models with their Cross-Validation error estimator, and to choose the better one. Cross-Validation is used both to choose between different kinds of Supervised Learning algorithms, and then to determine their hyper parameters. 4. The Artificial Neural Network Model Developed This research compares a feed-forward multi-layers neu- ral network developed for this study to another feed- forward neural network, built for a research conducted in 2004. The two neural networks are similar, but they dif- fer for the activation function adopted. The neural network built in 2004 [18], using an algo- rithm produced by Easy NN, has an architecture com- posed of three hidden layers, composed respectively by 8, 4 and 4 neurons, and one output layer, composed by the rating. The feed-forward network architecture built for this research, instead, is composed of an input layer, composed of 24 neurons, two hidden layers, composed respectively of 10 and 3 neurons, and one output layer, composed by the score. The error function used is a linear one. This network has been built taking advantage of the library Fann (F i gure 4). Both network models have been trained by means of a supervised algorithm, namely the back propagation algo- rithm. This algorithm performs an optimization of the network weights, trying to minimize the error between desired and actual output. For training, an incremental algorithm, the standard back propagation algorithm, was used, where the weights are updated after each training pattern. This mean that the weights are only updated once during an epoch function Inputlayer middlelayer outputlayer Figure 4. The neural networ k model developed. Copyright © 2011 SciRes. JILSA  An Artificial Neural Network Approach for Credit Risk Management 110 error. So for training two vectors were used: one contain- ing the input patterns and another containing the pattern desired responses (targets). Each training pattern is then composed of a pair of input vectors/target. This is com- pared to the outputs provided by the network. As activation function, for the first network, a logistic function was chosen, as in previous studies it was that which provided more reliable results. This function is presented by the following formula: 1 1i i ye Generally the response of the function determines values between minimum and maximum in the case of neural networks “yi” lies between 0 and 1. In fact, the logistic function reaches the extreme values, 0 and 1, only with very high weights, and then in indi- vidual cases we are content to approximate values. The weight or intensity is determined by the process to maximize the degree of matching of model predictions to reality examined. The neural network makes it possible to change the learning rate set equal to 0.7, the momentum set equal to 0.8. The activation function used for the network built for this research is the sigmoid symmetric stepwise function. Stepwise linear approximation to symmetric sigmoid is faster than symmetric sigmoid but a bit less precise. This activation function gives output that is between –1 and 1. In this case the learning rate is equal to 0.8 and the mo- mentum is equal to 0.5. The data base on which were built the two networks consists of a set of Italian manufacturing companies hav- ing the legal form of limited liability companies. Only companies with a workforce of under 500 units and class turnover below 50 millions of euro were considered. We have excluded from our study companies that showed outliers, i.e. variables were much higher or lower than the generality of cases. The companies considered in the study of 2004 amounted to 273 units. The database was divided into 3 subgroups: training set, validation test and test set. The data used were provided by “Central Balance Sheet”, specializing in credit counseling for credit lines, which maintains a continuous system of monitoring the Italian companies. Here are the ten indicators that the network of 2004 considered the most discriminating of the 80 indicators provided by the Central Balance Sheet: total fixed capital to total fixed assets; revenues; Ebitda/revenues; Cash flow/assets; Number of employees; Working capital/assets; Equity/assets; Cash/assts; Functional operating working capital/net sales; Tangible equity + debt + group members and con- vertible bonds /Total debt – cash. The results obtained by network, after 101.470 cycles of learning are shown in Table 1. It is possible immediately to notice the increase in the percentage of correct classification for companies con- sidered safe and vulnerable by the Central Financial, while there is a clear condition of misclassification for companies at risk. So, according to the results obtained by the neural net- work, lots of mistakes in the model of Central Balance Sheet were found in the classification of companies, ini- tially considered at high risk. The companies considered for this study amounted to 507 units, of which 359 were used for the training phase and 148 for the stage of validation test. Specifically, the sample was divided into three classes: the first class includes the safe companies, the second class includes the vulnerable companies and the third class includes the risky ones. The 70% of companies belonging to each of the rating classes mentioned above was used for the training, while the remaining 30% of each class was used for validation testing. The objective of this choice lies in the wish to have uniform data in terms of classes for submission to the stage of training. The variables used as input to our network are: % turnover; % EBITDA; % capital; % equity; ROE; ROI; ROA; operating turnover; cash flow/assets; dividends/net income; tangible assets/operational value added; overall depreciation rate; degree of depreciation; operational value added/intangible assets; Table 1. Neural network’s results. Rating Safe Vulnerable Risk Safe 84.2% 15.8% 0% Vulnerable 23.1% 73.9% 3.0% Risk 15.2% 50.0% 34.8% Copyright © 2011 SciRes. JILSA  An Artificial Neural Network Approach for Credit Risk Management111 liquidity; short term debt; day average escort; credits vs customers; credits vs suppliers; equity/total debts; debts vs banks + ics/financial debts; financial burden./EBIDTA; self-financing/intangible assets; Equity/assets. All inputs were normalized between the values from –1 to +1. This step serves to ensure that data are processed, so that they are more easily readable by the network. The data are included in a given range; in our case the inter- val is equal to [–1, 1]1. The variable used as output is only one, and it is the score. The purpose of the network is to minimize the differ- ence between the desired response and the one provided by the network. The aim of this network is to correctly classify the companies of our sample, to create classes more homo- geneous internally and more heterogeneous among them- selves. The network has undergone a phase of training; spe- cifically, 10.000 iterations were performed on 359 units (Figure 5). As we can see from the graph chart above, the value of error, in this phase, provided by the network as a result is equal to 0.3308. Performing the validation with the 148 units used for the stage of validation set, we obtain the results shown in Figure 6. The green line represents the expected results. The graph shows that a subdivision of the companies into the three classes described above was expected from the net- work. The results obtained from the network do not match those expected. In fact, as we can see from the graph, the network has not been able to classify companies, putting all the 148 units used for the validation test in the first class, as the red line of the graph indicates. The value of error, in this phase, provided by the net- work as a result is equal to 0.3311. 5. Concluding Remarks The objective pursued by this paper is to describe the artificial neural network model developed to forecast the credit risk of a panel of Italian manufacturing companies. In an empirical point of view, this research compares the structure of the artificial neural network model developed in this research to another one, built for a research con- ducted in 2004 with a similar panel of companies. The results on the use of neural networks recognize these undoubted advantages. Neural networks represent an alternative to traditional methods of classification because they are adaptable to complex situations. As highlighted in other papers [19], in fact, the artificial neural networks are particularly suited to analyze and interpret—revea- ling hidden relationships that govern the data—complex and often obscure phenomena and processes, which are, for example, those governing the dynamics of the vari- ables in financial markets. The neural network models certainly present some limits as the risk of inability to exit from local minima, the need a lot of examples to extract the prototype cases to be included in the training set and the lack of transparency in the identification of parameters most discriminatory. We can conclude that the flexibility and objectivity of Figure 5. Training phase’s results. 1Normalization, which consists of a linear scaling of data, is done using the following formula: I = Imin + (Imax – Imin)*(D – Dmin)/(Dmax – Dmin) where Dmin and Dmax are the endpoints of the input ranges of vari- ables, D is the value actually observed (or on) and lmax and lminare the new ends of the range in which we report the standard variable whose value will become. Figure 6. Validation set’s results. Copyright © 2011 SciRes. JILSA  An Artificial Neural Network Approach for Credit Risk Management Copyright © 2011 SciRes. JILSA 112 neural networks models can provide strong support in combination with linear methods of analysis for the effi- ciency of the processes of credit risk management of a bank. It is not possible in fact to state if traditional me- thods are better than non-linear one in forecasting credit defaults, but only that the traditional methods and neural networks have different strengths and weaknesses, which must be carefully evaluated by the analyst during the elaboration of the credit risk forecasting model. 6. Acknowledgement The authors acknowledge to the anonymous referees for their thoughtful and constructive suggestions and Maria Rosaria Di Muro for the valuable support. REFERENCES [1] T. W. Anderson, “An Introduction to Multivariate Statis- tical Analysis,” Wiley, New York, 1984. [2] W. R. Dillon and M. Goldstein, “Multivariate Analysis Methods and Applications,” Wiley, New York, 1984. [3] D. J. Hand, “Dis- crimination and Classification,” Wiley, New York, 1981. [4] D. F. Morrison, “Multivariate Statistical Methods,” McGraw-Hill, New York, 1990. [5] R. A. Johnson and D. W. Wichern, “Applied Multivariate Statistical Analysis,” 4th Edition, Prentice-Hall, Upper Saddle River, 1998. [6] K. Y. Tam and M. Kiang, “Managerial Applications of Neural Networks: The Case of Bank Failure Predictions,” Management Science, Vol. 38, No. 7, 1992, pp. 926-947. [7] T. S. Lee, C. C. Chiu, C. J. Lu and I. F. Chen, “Credit Scoring Using the Hybrid Neural Discriminant Tech- nique”, Expert System with Applications, Vol. 23, No. 3, 2002, pp. 245-254. [8] E. I. Altman, G. Marco and F. Varetto, “Corporate Dis- tress Diagnosis: Comparisons Using Linear Discriminant Analysis and Neural Networks (the Italian Experience),” Journal of Banking and Finance, Vol. 18, No. 3, 1994, pp. 505-529. [9] W. Zhang, Q. Cao and M. J. Schniederjans, “Neural Network Earnings per Share Forecasting: A Comparative Analysis of Alternative Methods,” Decision Science, Vol. 35, No. 2, 2004, pp. 205-237. [10] Z. Huang, H. Chen, C. J. Hsu, W. H. Chen and S. Wu, “Credit Rating Analysis with Support Vector Machines and Neural Networks: A Market Comparative Study,” Decision Support System, Vol. 37, No. 4, 2004, pp. 543-558. [11] P. Ravi Kumar and V. Ravi, “Bankruptcy Prediction in Banks and Firms via Statistical and Intelligent Tech- niques-A Review,” European Journal of Operational Research, Vol. 180, No. 1, 2007, pp. 1-28. [12] E. Angelini, G. Tollo and A. Roli, “A Neural Network Approach for Credit Risk Evaluation,” The Quarterly Re- view of Economics and Finance, Vol. 48, No. 4, 2008, pp. 733-755. [13] N. Chauhan, V. Ravi and K. Chandra, “Differential Evo- lution Trained Wavelet Neural Networks: Application to Bankruptcy Prediction in Banks,” Expert System with Ap- plications, Vol. 36, No. 4, 2009, pp. 7659-7665. [14] N. C. Hsieh and L. P. Hung, “A Data Driven Ensemble Classifier for Credit Scoring Analysis,” Expert Systems with Applications, Vol. 37, No. 1, January 2010, pp. 534-545. doi:10.1016/j.eswa.2009.05.059 [15] J. A. Anderson and E. Rosenfeld, “Neurocomputing: Foundations of Research,” MIT Press, Cambridge, 1988. [16] W. McCulloch and W. Pitts, “A Logical Calculus of Ideas Immanent in Nervous Activity,” Bulletin of Mathematical Biophysics, Vol. 5, No. 1-2, 1943, pp. 99-115. [17] V. Pacelli, “Un Modello Interpretativo Delle Dinamiche dei Corsi Azionari delle Banche: Elaborazione Teorica e Applicazione Empirica,” Banche e Banchieri, No. 6, 2007. [18] D. Summo and M. Azzollini, “L’Analisi Discriminante e la Rete Neurale per la Previsione delle Insolvenze Azi- endali: Analisi Empirica e Confronti,” Quaderni di Dis- cussione, No. 24, Istituto di Statistica e Matematica Università degli studi di Napoli “Parthenope,” 2004. [19] V. Pacelli, “An Intelligent Computing Algorithm to Ana- lyze Bank Stock Returns,” In: Huang et al. Eds. Emerg- ing Intelligent Computing Technology and Applications, Lectures Notes on Computer Sciences, No. 5754, Springer Verlag, New York, 2009, pp. 1093-1104.
|