Vol.1, No.1, 10-15 (2011) Open Journal of Animal Sciences
doi:10.4236/ojas.2011.11002
Copyright © 2011 SciRes. Openly accessible at http://www.scirp.org/journal/ojas/
Evaluation of sensory properties and their correlation
coefficients with physico-chemical indices in Turkish
settype yoghurts
Correlations between sensory and chemical parameters of Turkish yoghurts
Zehra Güler1, Young W. Park2*
1Department of Food Engineering, Mustafa Kemal University, 31034-Antakya-Hatay, TURKEY
2Georgia Small Ruminant Research and Extension Center, Fort Valley State University, Fort Valley, GA 31030,USA; parky@fvsu.edu
Received March 2,2011;revised April 2,2011;accepted April 9,2011
ABSTRAC T
Sensory properties and physico-chemical para-
meters of 10 most popular brands of commer-
cial set-type Turkish yoghurts were evaluated
and correlation coefficients between the two
indices were investigated. The results indicated
that increases in volatile compounds (ace-
taldehyde, 2-butanone, 2-nanonane, ethyl ace-
tate), titratable acidity, ash and fat contents
inversely correlated with the overall accepta-
bility score of the yoghurt. However, diacetyl, C4
to C12 free fatty acids, pH, whiteness index and
texture positively correlated with overall accep-
tability of the yoghurt products. It was con-
cluded that the acceptability of the Turkish
set-type yoghurts is mainly governed by the
fifteen volatile compounds as well as the phy-
sico-chemical properties determined. Thus, the
overall acceptability of the yoghurts was not
influenced by a single characteristic, but rather
by complex in nature.
Keywords: Turkish Set-Type Yoghurt; Sensory
Properties; Physico-Chemical Parameters;
Correlation Coefficient
1. INTRODUCTION
The sensory quality characteristics of cultured dairy
products are not as clearly defined as for other dairy
products. Specific geographical differences may exist in
consumer preferences for flavor intensity, body and tex-
ture characteristics, and /or color and appearance fea-
tures of many cultured dairy products (Bodyfelt et al.
1988). Consumers are very heterogeneous in their
likings and not all consumers prefer sweeter yoghurt.
For example, the apparent preference of Turkish consu-
mers is more acid, delicious and fatty flavor of yoghurt.
Pohjanheimo and Sandell (2009) have indicated that
food choice motives are connected to the liking. Subjects
who are considered natural content, ethical concern, and
health as important food choice motives perceived sourer,
thicker, and more genuine yoghurt flavour as more
pleasant, compared to subjects who are considered
convenience, price, mood, and familiarity more impor-
tant, considered sweeter and smoother yoghurt as more
pleasant. In addition, brand information is significantly
increased the liking for domestic yoghurts but did not
alter the main connections between food choice motives
and liking.
The sensory properties of Turkish set-type yoghurt as
well as gross-chemical composition are stated in Turkish
yoghurt standard (TSI 2006). Unfortunately, systematic
or routine sensory evaluation of cultured milk products
has received less attention than most other traditional
dairy products as cheeses. Yoghurt sensory character-
ristics may be influenced by different factors such as the
chemical composition of milk base, type of milk, pro-
cessing conditions, the ratio, activity and strains of
starter culture during the incubation period (Beshkova et
al. 1998; Kneifel et al. 1992; Tamime and Robinson
2001; Ulbert and Kneifel 1992).
Since sensory attributes play a key role in determining
consumer preference, elucidation of sensory causing
components of Turkish yoghurts is of paramount im-
portance to yoghurt producers. In Turkey, yoghurt is one
of the greatest volume of dairy products, which is
1,010,000 tons/per year (FAO 2006). However, no data
on the correlations the between sensory and physico-
chemical properties are available in literature. Thus, the
Z. Güler et al. / Open Journal of Animal Sciences 1 (2011) 10-15
Copyright © 2011 SciRes. Openly accessible at http://www.scirp.org/journal/ojas/
11
11
aim of this study was to determine the correlations
between some physicochemical characteristics and sen-
sory properties of the commercially marketed Turkish
set-type yoghurts.
2. MATERIAL AND METHODS
2.1. Preparation of experimental yoghurts
Ten commercially produced cow milk set-type
yoghurts samples from different manufacturers, pac-
kaged in PS (Polystrene) plastic cap of about 1 kg, were
purchased from local markets in Hatay, Turkey. Taking
into consideration packing information, all of the
yoghurts were corresponded with regulations stated in
Turkish Yoghurt Standart (TSI 2006). Four yoghurt
samples were obtained from each brand during two
different periods, such as March and December, 2007.
All samples were analyzed at the last 14th day before
their shelf life expire.
2.2. Sensory Analysis
Sensory evaluation was performed by 14 experienced
panelists (ten males and four female) who have been
trained with yoghurt sensory scores characteristics. The
panel consisted of academic staff and students from
Food Engineering Department of Mustafa Kemal
University, Hatay, Turkey. Yoghurts were removed from
refrigerator (4˚C) 1 h prior to sensory evaluation, kept at
room temperature (22 ± 2˚C). Appearance (unnatural
color to natural color), acid taste and atypical yoghurt
flavor scores by hedonic scales (none to extremely
strong) rated immediately after opening yoghurt caps.
Whey drainage was examined by visually observing the
gel surface of the products and after inserting a spoon
into gel. The evaluation of the texture (weak to very firm)
was also based on visual observation after stirring the
product with spoon. Each sensory attribute was clearly
defined to the panelists as described by Bodyfelt et al.
(1988). The intensity of sensory attributes was measured
on a 4-point hedonic scale where 3 corresponded to
„much too strong‟ and 0 corresponded to „none‟. By
using a 9-point hedonic sale (1 = dislike extremely, 5 =
neither like nor dislike, 9 = like extremely), consumers
rated overall acceptability. Yoghurt was evaluated in
duplicate by the panel members.
2.3. Chemical Analyses
2.3.1. Analyses of basic nutrients and
physicochemical indices
Total solids, fat, protein, ash contents and titratable
acidity value of yoghurts were determined according to
the Association of Official Analytical Chemist (AOAC,
2003) methods. pH was measured using a pH meter
(Orion, Thermo, USA). Lactose content was estimated
as the difference between total solids and the sum of fat,
protein and ash contents.
Color characterisitcs were measured by using a
Minolta Chromameter (model CR-400 Tokyo, Japan)
calibrated with a manufacturer-supplied white cali-
bration plate. The L (dark = 0 and light = 100), a (red=
+a and green= a) and b (yellow= +b and blue= b)
values were measured. The L*, a* and b* reading was
carried out in triplicate for each sample. Results were
expressed as Chroma (C* = [(a*)² + (b*)²]0.5), hue angle
(hab = tan1[(a*)(b*)1]), and whiteness index (WI = 100
[(100 L)2 + a2 + b2]0.5 ). Analyses were carried out in
duplicate obtaining Two yoghurt samples from each the
brand were collected at two experimental period (March
and December, 2007), and each sample was analyzed in
duplicates.
2.3.2. Analyses of free fatty acids (FFA) and
benzoic acid
Extraction and quantification of FFA and benzoic acid
were carried out according to the method of Deeth et al.
(1983) with slight modifications as reported by Güler
(2008). Heptanoic acid was added to all experimental
yoghurt samples at the time of extraction. FFAs were
analyzed by a GC-MS (Agilent 6890 gas chromatograph
and 5973 N mass selective detector; Agilent, Palo Alto,
CA, USA). Column used for FFA and benzoic acid
separation was a DB-FFAP-column (30 m × 0.25 mm id
× 0.25 µm film thickness). Analyses were carried out in
triplicate.
For GC operating conditions of FFA and benzoic acid
analysis, helium was used as a carrier gas with a
constant flow rate of 1 mL min1. The GC oven tempe-
rature was set to 50˚C for 5 min then raised to 230˚C at a
rate of 5˚C min1 and held at 230˚C for 20 min. The
injector temperature was 250˚C, and the run time was 58
min. The GC column was connected without splitting to
the ion source of the Agilent 5973N model quadrupole
mass selective detector which was operating in the scan
mode within a mass range 33 to 330 m z1 at 1 scan s1.
The interface line to MS was set at 280˚C. The MS was
operated in an electron impact mode at electron energy
of 70eV and was calibrated by auto-tuning. Identif-
ication of the compounds was performed by a computer-
matching of their mass spectral data with those of known
compounds from the Mass Spectral Database (Wiley7n.1
/Nist02.L.). To compensate the amount of loss during the
extraction and clean-up, heptanoic acid (C7) was used as
internal standard. Pre-analyses of the milk and yoghurt
had ensured that heptanoic acid was absent.
Z. Güler et al. / Open Journal of Animal Sciences 1 (2011) 10-15
Copyright © 2011 SciRes. Openly accessible at http://www.scirp.org/journal/ojas/
12
2.3.3. Analysis of volatile compounds (VC)
VCs were determined by static head space technique
according to Güler (2007). VCs were analyzed using a
Agilent model 6890 gas chromatography (GC) and 5973
N mass selective detector (MS) (Agilent, Palo Alto, CA,
USA). Columns used for FFA separation HP-INNOWAX
capillary column (30 m × 0.32 mm id × 0.25 µm film
thickness). The volatile compounds were separated un-
der the following conditions: injector temperature 200˚C;
carrier gas helium at a flow rate of 1.4 mL
min1; oven
temperature program initially held at 50˚C for 6 min and
then programmed from 50˚C to 180˚C at 8 ˚C
min1
held at 180˚C for 5 min. The interface line to MS was set
at 250˚C. Identification of the compounds was also con-
ducted by a computer-matching of their mass spectral
data with those of known compounds from the Nist 02.L.
Mass Spectral Database. Based on the peak resolution,
their areas were estimated from the integrations per-
formed on selected ions. The resulting peak areas were
expressed in the arbitrary area units. Quantification of
constituents was calculated by external standard tech-
nique.
2.4. Statistical Analysis
Statistical analysis was performed using the SPSS
version 9.05 for Macintosh (SPSS Inc./Chicago, III.,
U.S.A.). Data were expressed as means ± standard
deviation. The coefficient of variation (CV) between the
samples was expressed as relative standard deviation
(%). Sensory properties were submitted to one-way
analysis of variance (ANOVA). Duncan multiple mean
comparison test (P < 0.05) was used to state the
differences among the yoghurts. Pearsons correlation
coefficient (r) was also performed measure of the
strength of the association between the variables. Linear
Discriminat Analysis was applied to detect the presence
of classes within the yoghurt samples. The variables
were selected by forward stepwise analysis, and Wilk‟s
lambda and F-value were used to determine the signifi-
cance of the changes in lambda when a new variable is
tested. Validation of these results was performed by
leave-one-out cross validation.
3. RESULT AND DISCUSION
Results of sensory evaluation on the yoghurt samples
are presented in Figure 1. None of the yoghurts received
the maximum overall acceptability score of 9 (excellent)
described by the sensory evaluation form. Linear
Discriminant Analysis (LDA) was applied to distinguish
among yoghurt samples. Using the yoghurt samples as a
classification variable, the selected variables were the
scores of sensory properties. LDA achieved a high
recognition percentage for the classification of yoghurt
samples according to the sensory properties, reaching a
percentage of 91.2% for yoghurt samples (Figure 2).
According to the sensory scores, yoghurt samples fell
Figure 1. The sensory evaluation of yoghurt samples obtained
from 10 brands.
Figure2. Scattered plot of the samples projected in the plane
defined by the discriminant functions according to sensory
properties.
into four distinct groupings, where each group consisted
of yoghurts samples with similar characteristics. As
shown in Table 1, yoghurts are predominantly grouped
according to the magnitude of overall acceptability and
texture scores. This indicates that panelists were able to
distinguish differences among samples, as well as to
make similar assessments for duplicates within a sample.
There were significant differences in acid (P < 0.001)
and atypical (P < 0.05) taste scores in yoghurt samples
(Table 1). Pearsons correlation coefficeints of acid taste
Z. Güler et al. / Open Journal of Animal Sciences 1 (2011) 10-15
Copyright © 2011 SciRes. Openly accessible at http://www.scirp.org/journal/ojas/
13
13
scores were significant with titratable acidity (0.61, P<
0.001), appearence (0.59, P < 0.001) and overall
acceptability (0.57, P < 0.001). Similar results were
obtained by Chamnas et al. (2006) and Harper et al.
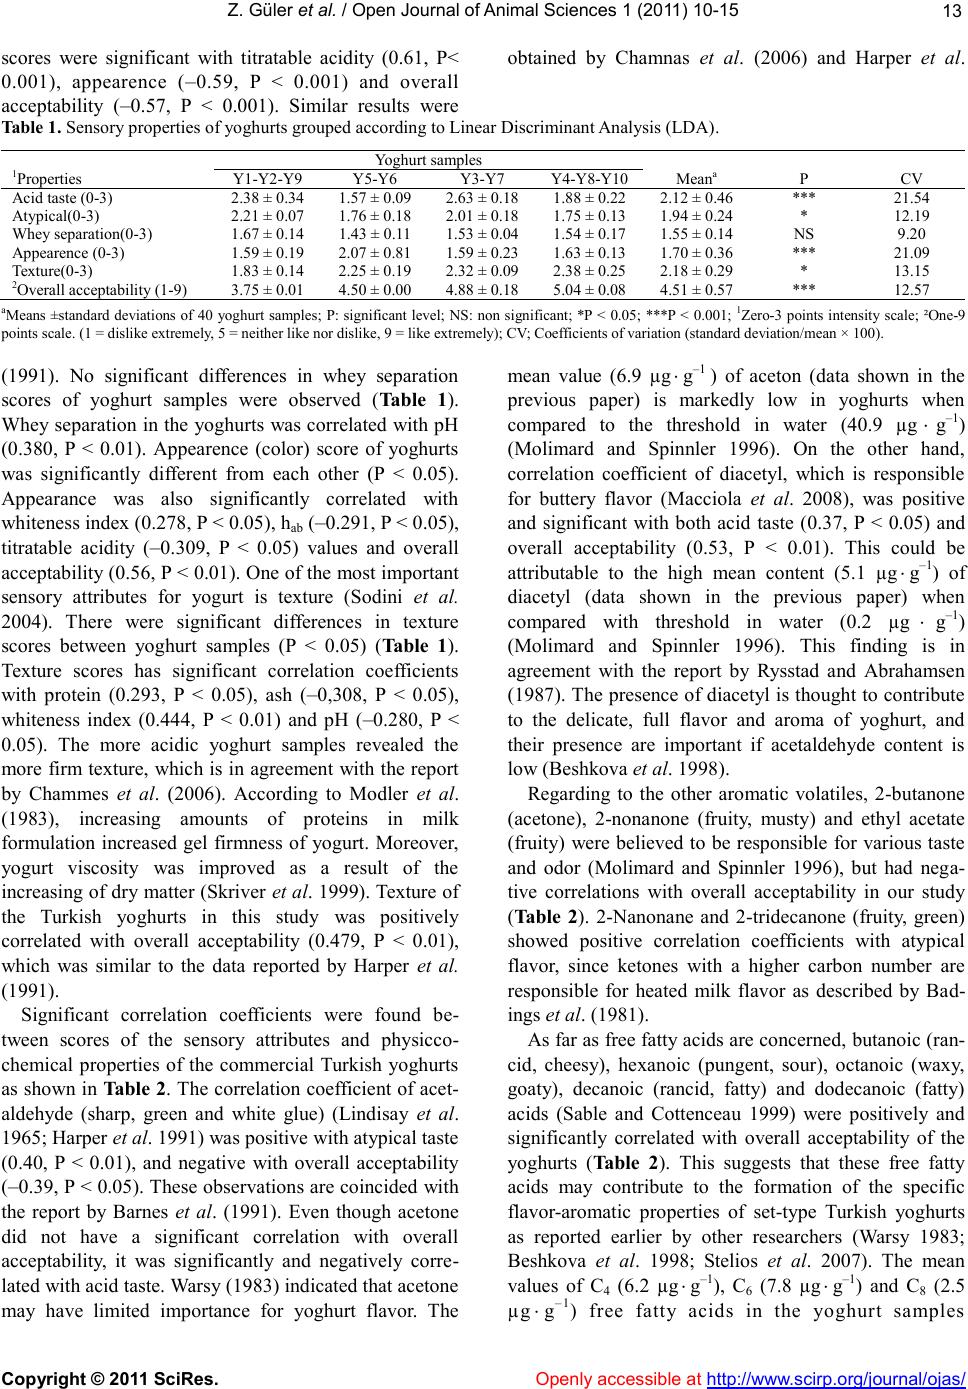
Table 1. Sensory properties of yoghurts grouped according to Linear Discriminant Analysis (LDA).
Yoghurt samples
1Properties
Y1-Y2-Y9
Y5-Y6
Y3-Y7
Y4-Y8-Y10
Meana
P
Acid taste (0-3)
2.38 ± 0.34
1.57 ± 0.09
2.63 ± 0.18
1.88 ± 0.22
2.12 ± 0.46
***
Atypical(0-3)
2.21 ± 0.07
1.76 ± 0.18
2.01 ± 0.18
1.75 ± 0.13
1.94 ± 0.24
*
Whey separation(0-3)
1.67 ± 0.14
1.43 ± 0.11
1.53 ± 0.04
1.54 ± 0.17
1.55 ± 0.14
NS
Appearence (0-3)
1.59 ± 0.19
2.07 ± 0.81
1.59 ± 0.23
1.63 ± 0.13
1.70 ± 0.36
***
Texture(0-3)
1.83 ± 0.14
2.25 ± 0.19
2.32 ± 0.09
2.38 ± 0.25
2.18 ± 0.29
*
2Overall acceptability (1-9)
3.75 ± 0.01
4.50 ± 0.00
4.88 ± 0.18
5.04 ± 0.08
4.51 ± 0.57
***
aMeans ±standard deviations of 40 yoghurt samples; P: significant level; NS: non significant; *P < 0.05; ***P < 0.001; 1Zero-3 points intensity scale; ²One-9
points scale. (1 = dislike extremely, 5 = neither like nor dislike, 9 = like extremely); CV; Coefficients of variation (standard deviation/mean × 100).
(1991). No significant differences in whey separation
scores of yoghurt samples were observed (Table 1).
Whey separation in the yoghurts was correlated with pH
(0.380, P < 0.01). Appearence (color) score of yoghurts
was significantly different from each other (P < 0.05).
Appearance was also significantly correlated with
whiteness index (0.278, P < 0.05), hab (0.291, P < 0.05),
titratable acidity (0.309, P < 0.05) values and overall
acceptability (0.56, P < 0.01). One of the most important
sensory attributes for yogurt is texture (Sodini et al.
2004). There were significant differences in texture
scores between yoghurt samples (P < 0.05) (Table 1).
Texture scores has significant correlation coefficients
with protein (0.293, P < 0.05), ash (0,308, P < 0.05),
whiteness index (0.444, P < 0.01) and pH (0.280, P <
0.05). The more acidic yoghurt samples revealed the
more firm texture, which is in agreement with the report
by Chammes et al. (2006). According to Modler et al.
(1983), increasing amounts of proteins in milk
formulation increased gel firmness of yogurt. Moreover,
yogurt viscosity was improved as a result of the
increasing of dry matter (Skriver et al. 1999). Texture of
the Turkish yoghurts in this study was positively
correlated with overall acceptability (0.479, P < 0.01),
which was similar to the data reported by Harper et al.
(1991).
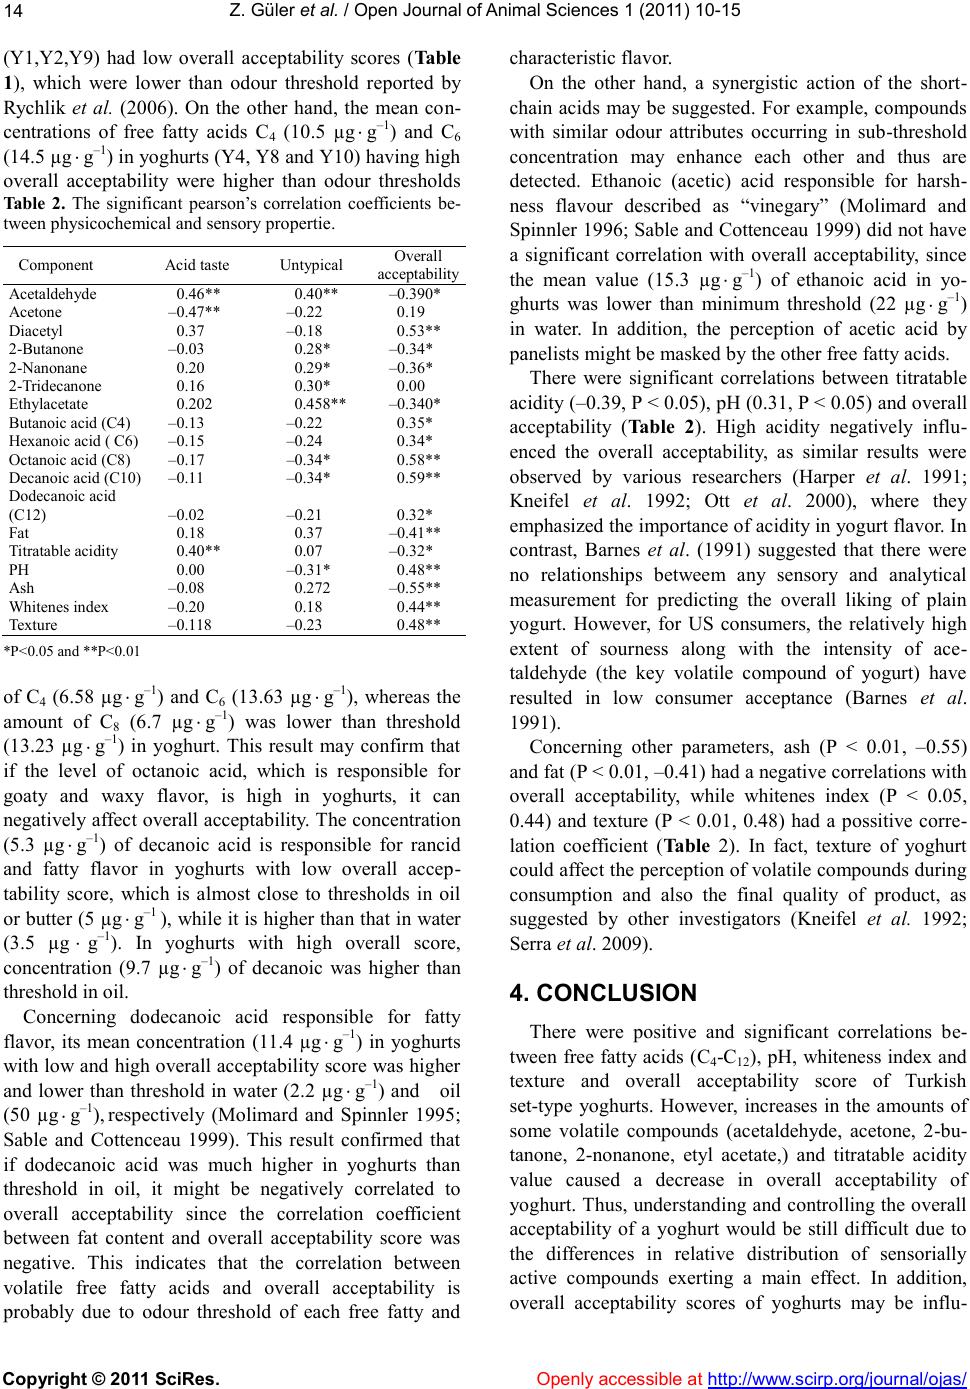
Significant correlation coefficients were found be-
tween scores of the sensory attributes and physicco-
chemical properties of the commercial Turkish yoghurts
as shown in Table 2. The correlation coefficient of acet-
aldehyde (sharp, green and white glue) (Lindisay et al.
1965; Harper et al. 1991) was positive with atypical taste
(0.40, P < 0.01), and negative with overall acceptability
(0.39, P < 0.05). These observations are coincided with
the report by Barnes et al. (1991). Even though acetone
did not have a significant correlation with overall
acceptability, it was significantly and negatively corre-
lated with acid taste. Warsy (1983) indicated that acetone
may have limited importance for yoghurt flavor. The
mean value (6.9 µg
g1 ) of aceton (data shown in the
previous paper) is markedly low in yoghurts when
compared to the threshold in water (40.9 µg
g1)
(Molimard and Spinnler 1996). On the other hand,
correlation coefficient of diacetyl, which is responsible
for buttery flavor (Macciola et al. 2008), was positive
and significant with both acid taste (0.37, P < 0.05) and
overall acceptability (0.53, P < 0.01). This could be
attributable to the high mean content (5.1 µg
g1) of
diacetyl (data shown in the previous paper) when
compared with threshold in water (0.2 µg
g1)
(Molimard and Spinnler 1996). This finding is in
agreement with the report by Rysstad and Abrahamsen
(1987). The presence of diacetyl is thought to contribute
to the delicate, full flavor and aroma of yoghurt, and
their presence are important if acetaldehyde content is
low (Beshkova et al. 1998).
Regarding to the other aromatic volatiles, 2-butanone
(acetone), 2-nonanone (fruity, musty) and ethyl acetate
(fruity) were believed to be responsible for various taste
and odor (Molimard and Spinnler 1996), but had nega-
tive correlations with overall acceptability in our study
(Table 2). 2-Nanonane and 2-tridecanone (fruity, green)
showed positive correlation coefficients with atypical
flavor, since ketones with a higher carbon number are
responsible for heated milk flavor as described by Bad-
ings et al. (1981).
As far as free fatty acids are concerned, butanoic (ran-
cid, cheesy), hexanoic (pungent, sour), octanoic (waxy,
goaty), decanoic (rancid, fatty) and dodecanoic (fatty)
acids (Sable and Cottenceau 1999) were positively and
significantly correlated with overall acceptability of the
yoghurts (Table 2). This suggests that these free fatty
acids may contribute to the formation of the specific
flavor-aromatic properties of set-type Turkish yoghurts
as reported earlier by other researchers (Warsy 1983;
Beshkova et al. 1998; Stelios et al. 2007). The mean
values of C4 (6.2 µg
g1), C6 (7.8 µg
g1) and C8 (2.5
µg
g1) free fatty acids in the yoghurt samples
Z. Güler et al. / Open Journal of Animal Sciences 1 (2011) 10-15
Copyright © 2011 SciRes. Openly accessible at http://www.scirp.org/journal/ojas/
14
(Y1,Y2,Y9) had low overall acceptability scores (Table
1), which were lower than odour threshold reported by
Rychlik et al. (2006). On the other hand, the mean con-
centrations of free fatty acids C4 (10.5 µg
g1) and C6
(14.5 µg
g1) in yoghurts (Y4, Y8 and Y10) having high
overall acceptability were higher than odour thresholds
Table 2. The significant pearson‟s correlation coefficients be-
tween physicochemical and sensory propertie.
Component
Acid taste
Untypical
Overall
acceptability
Acetaldehyde
0.46**
0.40**
0.390*
Acetone
0.47**
0.22
0.19
Diacetyl
0.37
0.18
0.53**
2-Butanone
0.03
0.28*
0.34*
2-Nanonane
0.20
0.29*
0.36*
2-Tridecanone
0.16
0.30*
0.00
Ethylacetate
0.202
0.458**
0.340*
Butanoic acid (C4)
0.13
0.22
0.35*
Hexanoic acid ( C6)
0.15
0.24
0.34*
Octanoic acid (C8)
0.17
0.34*
0.58**
Decanoic acid (C10)
0.11
0.34*
0.59**
Dodecanoic acid
(C12)
0.02
0.21
0.32*
Fat
0.18
0.37
0.41**
Titratable acidity
0.40**
0.07
0.32*
PH
0.00
0.31*
0.48**
Ash
0.08
0.272
0.55**
Whitenes index
0.20
0.18
0.44**
Texture
0.118
0.23
0.48**
*P<0.05 and **P<0.01
of C4 (6.58 µg
g1) and C6 (13.63 µg
g1), whereas the
amount of C8 (6.7 µg
g1) was lower than threshold
(13.23 µg
g1) in yoghurt. This result may confirm that
if the level of octanoic acid, which is responsible for
goaty and waxy flavor, is high in yoghurts, it can
negatively affect overall acceptability. The concentration
(5.3 µg
g1) of decanoic acid is responsible for rancid
and fatty flavor in yoghurts with low overall accep-
tability score, which is almost close to thresholds in oil
or butter (5 µg
g1 ), while it is higher than that in water
(3.5 µg
g1). In yoghurts with high overall score,
concentration (9.7 µg
g1) of decanoic was higher than
threshold in oil.
Concerning dodecanoic acid responsible for fatty
flavor, its mean concentration (11.4 µg
g1) in yoghurts
with low and high overall acceptability score was higher
and lower than threshold in water (2.2 µg
g1) and oil
(50 µg
g1), respectively (Molimard and Spinnler 1995;
Sable and Cottenceau 1999). This result confirmed that
if dodecanoic acid was much higher in yoghurts than
threshold in oil, it might be negatively correlated to
overall acceptability since the correlation coefficient
between fat content and overall acceptability score was
negative. This indicates that the correlation between
volatile free fatty acids and overall acceptability is
probably due to odour threshold of each free fatty and
characteristic flavor.
On the other hand, a synergistic action of the short-
chain acids may be suggested. For example, compounds
with similar odour attributes occurring in sub-threshold
concentration may enhance each other and thus are
detected. Ethanoic (acetic) acid responsible for harsh-
ness flavour described as “vinegary” (Molimard and
Spinnler 1996; Sable and Cottenceau 1999) did not have
a significant correlation with overall acceptability, since
the mean value (15.3 µg
g1) of ethanoic acid in yo-
ghurts was lower than minimum threshold (22 µg
g1)
in water. In addition, the perception of acetic acid by
panelists might be masked by the other free fatty acids.
There were significant correlations between titratable
acidity (0.39, P < 0.05), pH (0.31, P < 0.05) and overall
acceptability (Table 2). High acidity negatively influ-
enced the overall acceptability, as similar results were
observed by various researchers (Harper et al. 1991;
Kneifel et al. 1992; Ott et al. 2000), where they
emphasized the importance of acidity in yogurt flavor. In
contrast, Barnes et al. (1991) suggested that there were
no relationships betweem any sensory and analytical
measurement for predicting the overall liking of plain
yogurt. However, for US consumers, the relatively high
extent of sourness along with the intensity of ace-
taldehyde (the key volatile compound of yogurt) have
resulted in low consumer acceptance (Barnes et al.
1991).
Concerning other parameters, ash (P < 0.01, 0.55)
and fat (P < 0.01, 0.41) had a negative correlations with
overall acceptability, while whitenes index (P < 0.05,
0.44) and texture (P < 0.01, 0.48) had a possitive corre-
lation coefficient (Table 2). In fact, texture of yoghurt
could affect the perception of volatile compounds during
consumption and also the final quality of product, as
suggested by other investigators (Kneifel et al. 1992;
Serra et al. 2009).
4. CONCLUSION
There were positive and significant correlations be-
tween free fatty acids (C4-C12), pH, whiteness index and
texture and overall acceptability score of Turkish
set-type yoghurts. However, increases in the amounts of
some volatile compounds (acetaldehyde, acetone, 2-bu-
tanone, 2-nonanone, etyl acetate,) and titratable acidity
value caused a decrease in overall acceptability of
yoghurt. Thus, understanding and controlling the overall
acceptability of a yoghurt would be still difficult due to
the differences in relative distribution of sensorially
active compounds exerting a main effect. In addition,
overall acceptability scores of yoghurts may be influ-
Z. Güler et al. / Open Journal of Animal Sciences 1 (2011) 10-15
Copyright © 2011 SciRes. Openly accessible at http://www.scirp.org/journal/ojas/
15
15
enced by consumers‟ ethical concern, health, sex and age,
etc.
5. ACKNOWLEDGEMENTS
The authors gratefully acknowledge the members of the sensory
panel conducted this study. We also thank Gökhan DİLER and Ersin
GÖK for assisting in labratory analyses.
REFERENCES
[1] Badings H T, Van der Pol JG and Neeter R (1981) Aroma
compounds which contribute to the difference in flavor
between pasteurized milk and UHT milk. In Flavor „81‟,
pp 685-692, Schreier P, ed. Berlin: Walter de Gruyter.
[2] Barnes DL, Harper SJ, Bodyfelt FW and McDaniel MR
(1991) Prediction of consumer acceptability of yogurt by
sensory and analytical measures of sweetness and
sourness. Journal Dairy Science 74 3746-54.
[3] Beshkova D, Simova E, Frengova G and Simov Z (1998).
Production of flavour compounds by yogurt starter
cultures. J. Industrial Microbiology & Biotechnology, 20,
180-186
[4] Bodyfelt FW, Tobias J, Trout GM (1988) The sensory
evaluation of dairy products. Pp.598. New York, USA:
Van Nostrand Reinhold.
[5] Chammas G, Saliba R and Beal C (2006) Charac-
terization of the Fermented Milk “Laban” with Sensory
Analysis and Instrumental Measurements Journal of
Food Science 71 156-162.
[6] FAO (2006) Food Agricultural Organization.
www.faostat.fao.org
[7] Harper SJ, Barnes DL, Bodyfelt FW and McDaniel MR
(1991) Sensory ratings of commercial plain yogurts by
consumer and descriptive panels. Journal Dairy Science
74 2927-35.
[8] Kneifel W, Ulbert F, Erhard F and Jaros D (1992) Aroma
profiles and sensory properties of yoghurt and yoghurt
related products. I. Screening of commercially available
starter cultures. Milchwissenchaft 47 362-365.
[9] Lindsay R C, Day E A and Sandine W E (1965) Green
flavor defect in lactic starter cultures. Journal Dairy
Science 48 863.
[10] Macciola V, Candela G and De Leonardis A (2008) Rapid
gas-chromatographic method for the determination of
diacetyl in milk, fermented milk and butter. Food Control
19 873-878.
[11] Modler HW, Larmond ME, Lin CS, Froehlich D, and
Emmons DB (1983) Physical and
[12] sensory properties of yogurt stabilized with milk proteins.
Journal Dairy Science 66 422-9.
[13] Molimard P and Spinnler HE (1996) Compound Involved
in the Flavor of Surface Mold-Ripened Cheeses: Origins
and Properties. Journal of Dairy Science 79 169-184.
[14] Ott A, Germond JE and Chaintreau A (2000) Vicinal
diketone dormation in yoghurt: 13C precursors and effect
of branched-chain amino acids. Journal of Agricultural
and Food Chemistry 48 724-731.
[15] Pohjanheimo T and Sandell M (2009) Explaining the
liking for drinking yoghurt: The role of sensory quality,
food choice motives, health concern and product
information. International Dairy Journal 19 459-466.
[16] Rychlik M, Sax M and Schieberle P (2006) On the role of
short-chain free fatty acids for the development of a
cheese-like off-note in pasteurized yoghurt. LWT 39
521-527.
[17] Rysstad G and Abrahamsen RK (1987) Formation of
volatile aroma compounds and carbon dioxide in yogurt
starter grown in cows‟ and goats‟ milk Journal of Dairy
Research 54 257-266.
[18] Sable S and Cottenceau G (1999) Current Knowladge of
Soft Cheeses Flavor and Related Compounds. Journal
Agricural Food Chemistry 47 4825-4836.
[19] Serra M, Trujillo AJ, Guamis B and Ferragut V (2009)
Flavour profiles and survival of starter cultures of
yoghurt produced from high-pressure homogenized milk.
International Dairy Journal 19 100-106.
[20] Skriver A, Holstborg J and Qvist KB (1999) Relation
between sensory texture analysis
[21] and rheological properties of stirred yogurt. Journal
Dairy Research 66 609-18.
[22] Sodini I, Remeuf F, Haddad S and Corrieu H (2004) The
Relative Effect of Milk Base,
[23] Starter, and Process on Yogurt Texture: A Review
Critical Reviews in Food Science and Nutrition 44
113-137.
[24] Stelios K, Stamou P and Massouras T (2007)
Comparision of The Characterstics of Set Type Yohurt
Made From Ovine Milk of Different Fat Content.
International Journal Food Science and Technology 42
1019-1028.
[25] Tamime A Y and Robinson RK (2001) Yoghurt Science
and Technology. pp 619, New York US: CRC Pres.
[26] TSI (2006) Yogurt. TS 1330. Ankara: Turkish Standar
Institution.
[27] Ulbert F and Kneifel W (1992) Aroma profiles and
sensory properties of yoghurt and yoghurt-related pro-
ducts. II. Classification of starter cultures by means of
cluster analysis. Milchwissenchaft 47 432-434.
[28] Warsy J D (1983) production of volatile aroma com-
pounds in Dahi. Journal Agricultural Research 21 (1)
31-36.