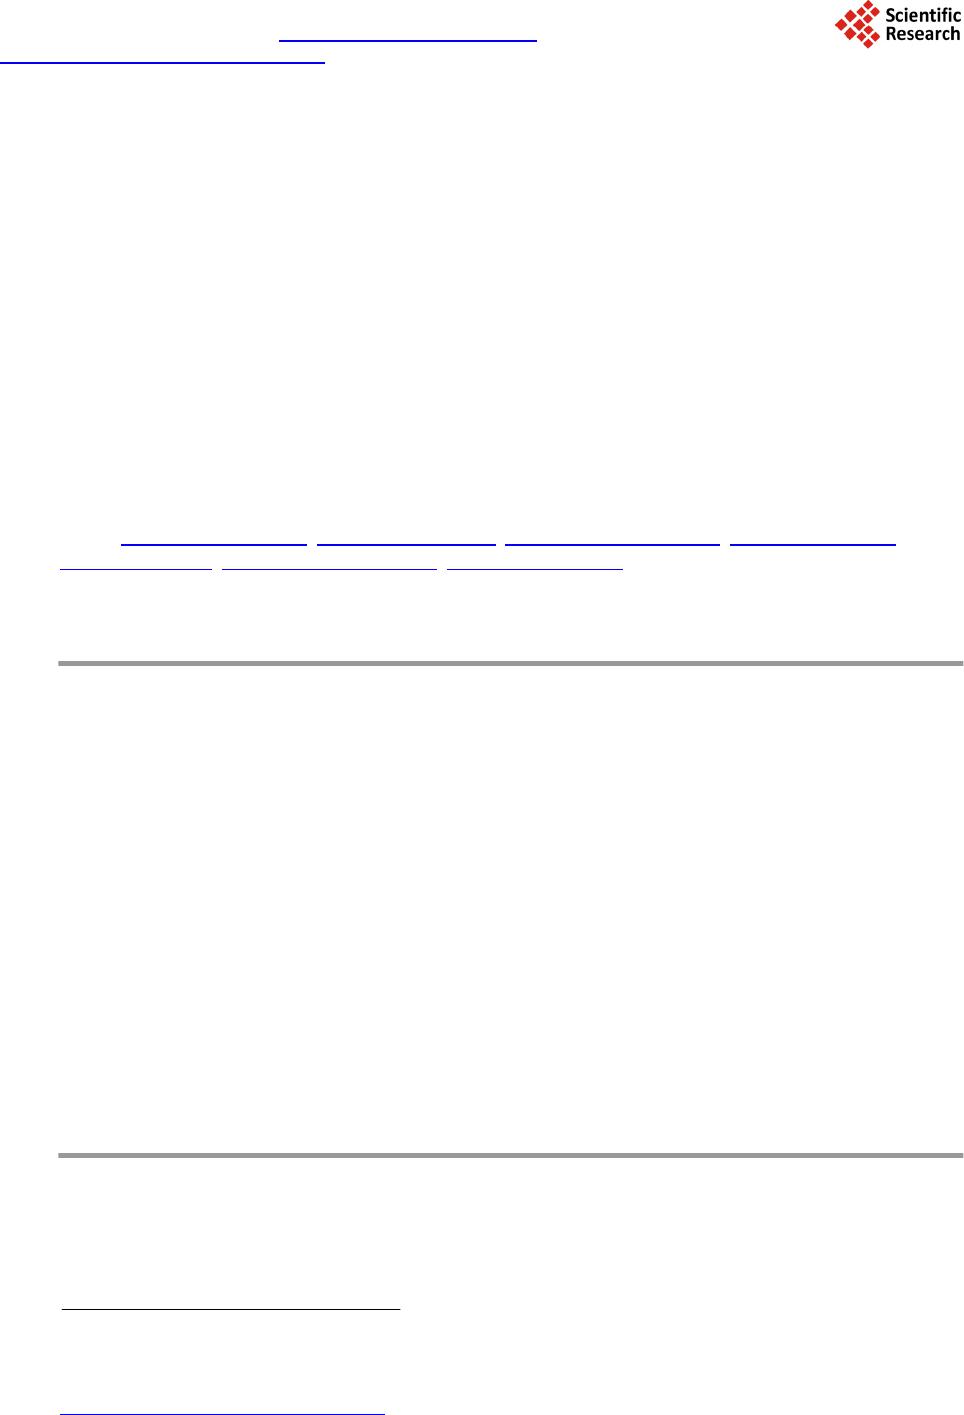
 Journal of Applied Mathematics and Physics, 2014, 2, 77-87 Published Online April 2014 in SciRes. http://www.scirp.org/journal/jamp http://dx.doi.org/10.4236/jamp.2014.25011 How to cite this paper: Mahmood, S.H., et al. (2014) Magnetic Properties and Hyperfine Interactions in M-Type BaFe12-2xMoxZnxO19 Hexaferrites. Journal of Applied Mathematics and Physics, 2, 77-87. http://dx.doi.org/10.4236/jamp.2014.25011 Magnetic Properties and Hyperfine Interactions in M-Type BaFe12-2xMoxZnxO19 Hexaferrites Sami H. Mahmood1*, Ghada H. Dushaq1, Ibrahim Bsoul2, Mufeed Awawdeh3, Hassan K. Juwhari1, Bashar I. Lahlouh1, Murad A. AlDamen4 1Physics Department, The University of Jordan, Amman, Jordan 2Physics Department, Al al-Bayt University, Mafraq, Jordan 3Physics department, Yarmouk University, Irbid, Jordan 4Chemistry Department, The University of Jordan, Amman, Jordan Email: *s.mahmood@ju.edu.jo, ghb1905@yahoo.com, ibrahimbsoul@yahoo.com, amu feed @yu.edu.jo, h.juhari@ju.edu.jo, bashar_lahlouh@ju.edu.jo, maldamen@ju.edu.jo Received January 2014 Abstract A series of M-Type barium hexaferrites with the general composition BaFe12-2xMoxZnxO19 were synthesized at 1100˚C by a simple wet chemical mixture route. The properties of the prepared samples were examined by X-ray diffraction, scanning electron microscopy, vibrating sample magnetometry, and Mössbauer spectroscopy. The diffraction patterns for all samples were found to agree well with the standard pattern of BaFe12O19 hexaferrite with no extraneous diffraction peaks. The products formed as well crystallized hexagonal platelet-like particles while the EDS measurements revealed the stoichiometric cationic ratios of the prepared samples. The spectral variations elucidated by Mössbauer spectroscopy were utilized to determine the different cation preferential site occupations as a function of x. Finally, the saturation magnetizations, magnetic anisotropies, and the anisotropy fields, determined from the magnetic measurements, showed consistency with the relative subspectral Mössbauer intensities and the single ion model for the anisotropy constant. Keywords Mössbauer Spectroscopy Magnetic Properties, Hysteresi s, Crystal Field, Sint ering; Magnetic Materi als 1. Introduction M-type barium hexaferrite with the formula BaFe 12O19 belongs to a class of hexagonal ferrites with relatively high saturation magnetization and tunable coercive fields. The magnetic properties, in addition to corrosion re- *  S. H. Mahmood et al. sistance and low production cost, make these ferrites of great commercial and technological importance [1,2]. The great current scientific and technological interest in M-type ferrites was driven by their potential for a wide range of applications in permanent magnets, high density magnetic recording and data storage media, micro - wave absorption and next-generation microwave devices [1-8]. The unit cell of BaM consists of two spinel (S) blocks and two hexagonal (R) blocks with a stacking sequence RSR*S*, where R* and S* are rotated by 180˚ around the hexagonal c-axis. The unit cell contains two formula units, where the Ba2+ ion replaces an oxygen ion substitutionally in the middle layer of the R block, and the fer- ric ions reside in the three octahedral (12k, 4f2 and 2a) sites, the tetrahedral (4f1)site and the trigonalbi-pyramidal (2b) site. The spin orientations of the Fe3+ ions in the 2a, 2b, and 12k sites are parallel (spin-up sublattices), and the spins of the ions in the 4f1 and 4f2 sites are parallel to each other and in opposite direction to spin-up sublat- tices (spin-down sublattices). The prefix number associated with the symbol for each site is the number of me- tallic ions per unit cell occupying that site. Accordingly, the magnetic moment per formula can be expressed as follows: 12224 142 6 22 kba ff mm mmmm= ++−− (1) The magnetocrystalline anisotropy in these ferrites arises from the coupling of the spins of Fe3+ at different sites. The contributions of the various sites to the magnetic anisotropy was calculated on the basis of single-ion model [9], and it was shown that iron ions at 2b sites have the largest positive contribution, and those at 12k sites have a relatively weak negative contribution, while the remaining sites have a relatively weak postive contribu- tion. Accordingly, the magnetic properties of the hexaferrites were modified by substituting Fe3+ ions by a triva- lent metal ion such as Al, Ga, In, Sc, As, Cr [10-16], or combinations of a tetravalent ion such as Ti4+, Ru4+, Zr4+, or Sn4+ with a divalent ion such as Mn2+, Ni2+, Mg2+, Co2+, Zn2+, Ti2+ or Sn2+ [4,17-22]. The structural and phys- ical properties of the fabricated hexaferrite powders were found to be affected by the physical or chemical prep- aration method, as well as the experimental conditions such as stoichiometry, heat treatment, and binder addi- tives [11,17,18,23-30]. Among other techniques used to characterize the hexaferrites, magnetic measurements and Mössbauer spec- troscopy were extensively used in the last five decades. While the magnetic measurements give some sort of an average of the magnetic propertie over the whole sample investigated, 57Fe Mössbauer spectroscopy gives in- formation on the local chemical and structural environment, in addition to the valence state of the iron ions in the lattice. This valuable information was used to explain the magnetic behavior and the magnetic interactions in barium and strontium based hexaferrites [5,11,31-34]. The Mössbauer data available in the literature for pure barium hexaferrites at room temperature demonstrated a wide range of variability in the hyperfine parameters of the hexaferrites. Although the parameters for the 12k and 2b components are clearly distingushable from the remaining components due to the high rlative intensity of the first and the large quadrupole splitting of the second, clear disagreements were found even on the parameters of these components. Hyperfine fields for the 4f2were reported between about 512 kOe [35,36] and 528 kOe [37], which differ by more than the usual experimental uncertainty of 5 kOe. Furthe r more, the intensity for this com- ponent (with a theoretical value of 50%) was reported between 46.4% [38] and 50.6% [35,36]. While on the other hand, values of the quadrupole splitting for the 2b component were reported between as low as 2.03 mm/s [39] and as high as 2.30 mm/s [40], with a variation significantly higher than the usually accepted experimental uncertainty of 0.02 mm/s. The intensity for this component was reported between 3.7% [39] and 6.7% [35], and the isomer shift between 0.18 mm/s [35] and 0.32 mm/s [41]. The variations in the hyperfine parameters and relative intensity for the 2b component could be due to the low intensity of this component and the complexity of the spectrum. Also, significant variations in the hyperfine parameters and relative intensities for the 4f2, 2a, and 4f1 components were reported in the literature [13,35,36,40,42]. Such variations, we believe, arise from the similarity of the parameters for these components which lead to the mixing of the corresponding subspectra and the difficulty to resolve the low intensity 2a component. The proximity of the parameters for these components lead the majority of investigators to consider mixing of the 2a-4f1 components into one subspectrum and few others to consider 2a-4f2 [36,39] mixing in their fitting procedure. In a recent study [43], the magnetic properties and hyperfine parameters were reported for the system BaFe11.6Mo xZn0.4-xO19 (x =0.1, 0.2, 0.4) with the focus on the distribution of Mo ions with different valencies (Mo4+ and Mo6+) and its effects on the magnetic properties. In this study the magnetic properties and hyperfine interactions for the system BaFe12-2xMoxZnxO19 (x = 0, 0.05, 0.1, 0.15, 0.2, 0.3) prepared by wet chemical mix-  S. H. Mahmood et al. ture method were investigated. The structural properties of the samples were investigated by powder x-ray dif- fraction, and the morphology of the particles and the stoichiometry of the samples were checked by scanning electron microscopy (SEM) equipped with energy dispersive x-ray spectroscopy (EDS) facility. Also, the effects of Mo4+Zn2+ concentration on the cationic distribution and the magnetocrystalline anisotropy were evaluated. 2. Experimental The precursors of BaFe12-2xMoxZn0.4-xO19(x = 0.00, 0.05, 0.10, 0.15, 0.20, 0.30) were synthesized by the wet chemical mixture method described earlier [43]. The required molarities of at least 99% pure Fe2O3, BaCO3, ZnO and MoO3 were added to distilled water and mixed together in a beaker with continuous stirring on a mag- netic stirrer. The mixture was refluxed at 150˚C for 24 hrs, filtered and then left to dry in air. The resulting powders were pressed into pellets 1.5 cm in diameter, and sintered in air atmosphere at 1100˚C for 2 hr. The Fe/Ba ratio was 11 to avoid the persistence of α-Fe2O3 secondary phase. Samples containing small amounts of BaFe2O4 intermediate phase were sintered again at 1100˚C for better reaction and elimination of intermediate phases. The structure of the samples and the unit cell volumes were determined from XRD patterns using Philips X’Pert PRO X-ray diffractometer (PW3040/60) with CuKα radiation (λ = 1.54 Å).The patterns were recorded in the angular range 15˚ < 2θ < 75˚ with scanning step of 0.017˚. The morphology of the particles and the stoichi- ometry of the prepared samples were examined using scanning electron microscope (SEM FEI-Inspect F50/FEG) equipped with energy dispersive X-ray analysis (EDS) facility. 57Fe Mössbauer spectra were recorded using a standard constant acceleration Mössbauer spectrometer with a 57Co/Cr source. The spectra were calibrated using iron metal spectrum at room temperature and the experimental spectra were fitted using routines based on least squares analysis. Room temperature magnetic measurements were obtained using a vibrating sample magnetometer (VSM Mi- croMag 3900, Princeton Measurements Corporation), with a maximum applied field of 10 kOe. The needle- shaped samples for magnetic measurements were cut from the sintered sample disks. 3. Results and Discussion 3.1. X-Ray Diffraction Figure 1 sho ws representative XRD patterns together with the standard pattern for comparison. XRD patterns for all samples show BaFe12O19 M-type hexaferrite phase with lattice parameters consistent with the standard pattern (JCPDS 00-043-0002). The lattice parameters are a = 5.887 ± 0.002 Å and c = 23.17 ± 0.005 Å, and the cell volume is 695.9 ± 0.5 Å3. The X-ray density increases from 5.30 g/cm3 for the sample with x = 0.00 to 5.40 g/cm3 for that with x = 0.3. The average crystallite sizes for the samples were calculated from the positions of the (107) and (114) peaks using the well-known Scherrer formula [44]: (2) Here D is the crystallite size, k is the Scherrer constant, λ is the wavelength of radiation (1.54 Å), β is the peak width at half maximum, and θ is the peak position. The average crystallite sizes of all samples were found to decrease slightly from 52 nm for the sample with x = 0.00 to 45 nm for that with x = 0.30. 3.2. Scanning Electron Microscopy The morphology and average particle size, and the stoichiometry of the samples under investigation were ex- amined using SEM imaging a nd EDS. Figure 2 s hows representative images for the samples with x = 0.15 and x = 0.20. Other images were investigated for statistical purposes. We noticed that the prepared samples consisted mainly of hexagonal platelet-like particles with diameters ranging from about 100nm to about 500nm for low Mo-Zn concentrations, and platelets with diameters larger than 1 μm were observed at higher concentrations. From these observations it seems that the Mo-Zn cations in the lattice improve the inter-particle connectivity and leads to crystal growth. Energy dispersive spectra for the samples were examined and the atomic ratios of the constituents were ob- tained. The spectra were collected by focusing the electron beam at one particle at a time. Weak peaks corres- 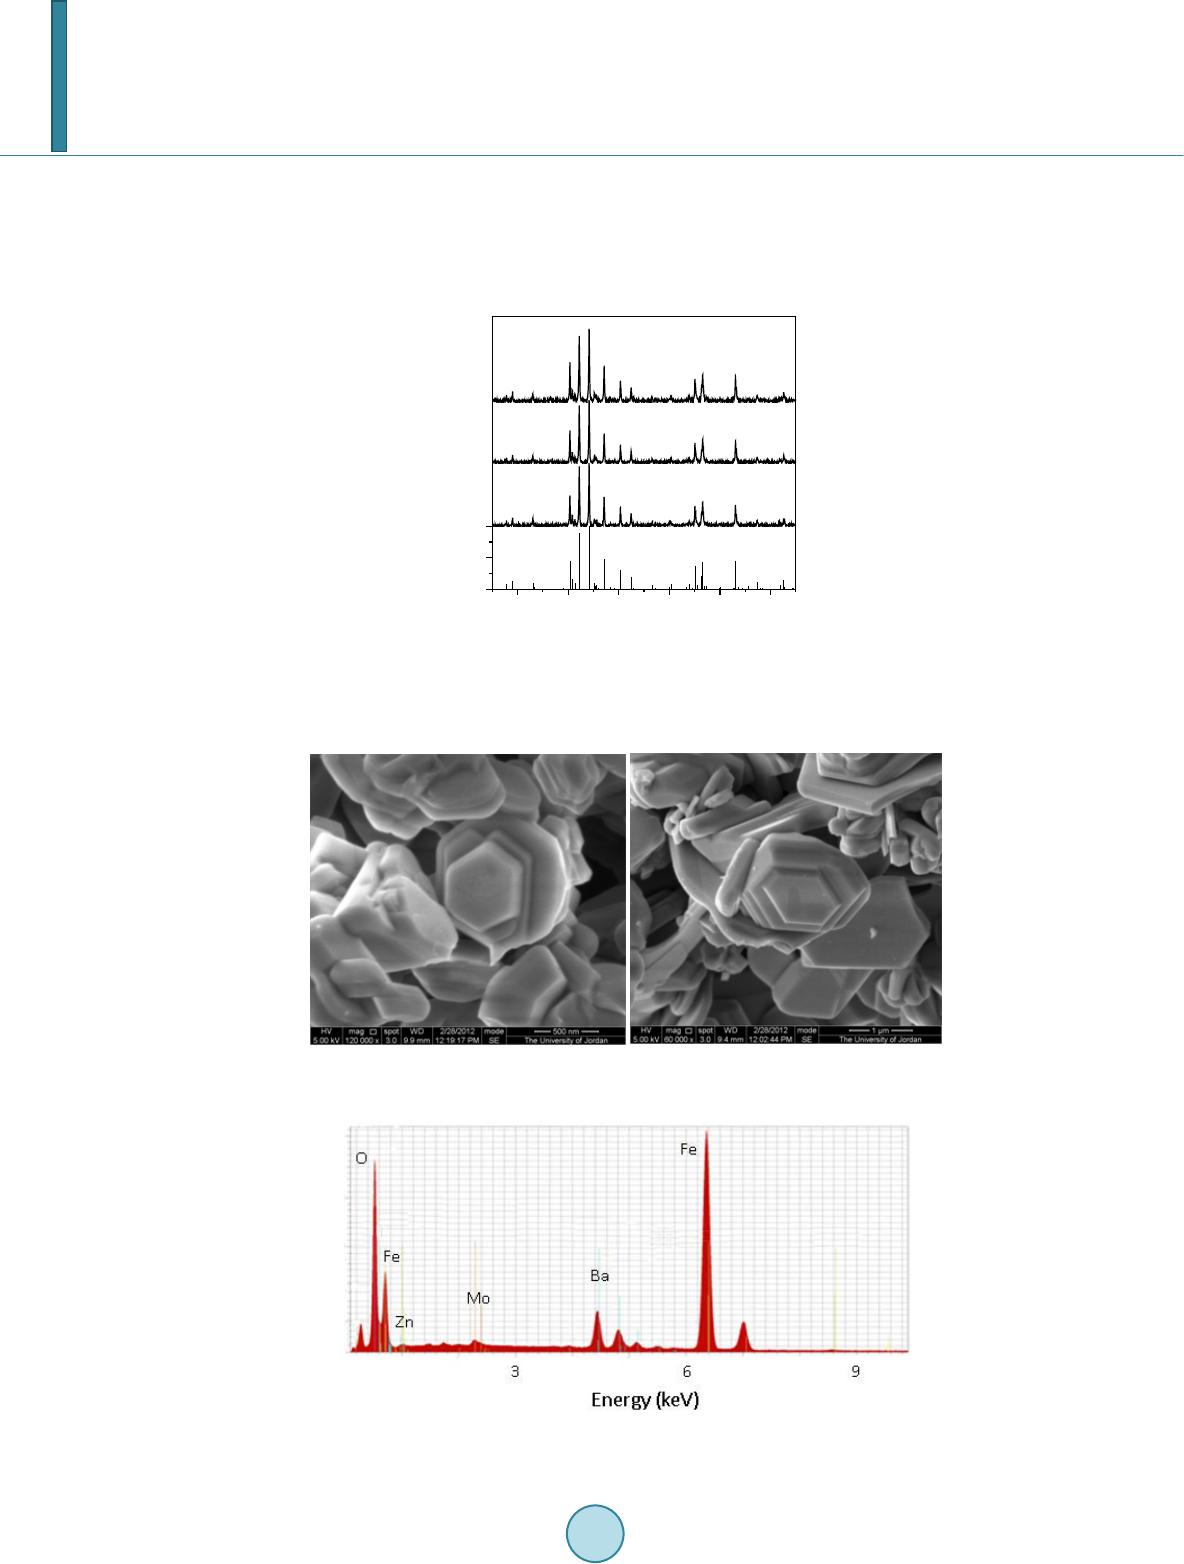 S. H. Mahmood et al. ponding to Zn and Mo were observed, indicating the incorporation of the metal ions in the hexaferrite lattice (see for example Figure 3 for the samples with x = 0.20). The relative peak intensities derived from this spec- trum correspond to atomic concentrations of (0.97 ± 0.13) Ba, (10.6 ± 0.6) Fe, (0.10 ± 0.10) Zn, and (0.21 ± 0.10) Mo. These atomic concentrations reflect the stoichiometric composition, and correspond to Fe/Ba ratio within 10% of the stoichiometric ratio. Similar results were obtained for the other samples. 20 30 40 50 60 70 0 50 100 2θ (deg.) BaFe 12 O 19 JCPDS: 00-043-0002 x = 0 x = 0.15 Intensity x = 0.2 Figure 1. XRD patterns forBaFe12-2xMoxZnxO19 (x = 0.00, 0.15, 0.20) samples. The standard pattern for M-type barium hexaferrite (file no: 043-0002) is included for comparison. Figure 2. SEM micrographs for (a) the sample with x = 0.15, and (b) the sample with x = 0.2. Figure 3. Energy dispersive spectrum for the sample with x = 0.20. 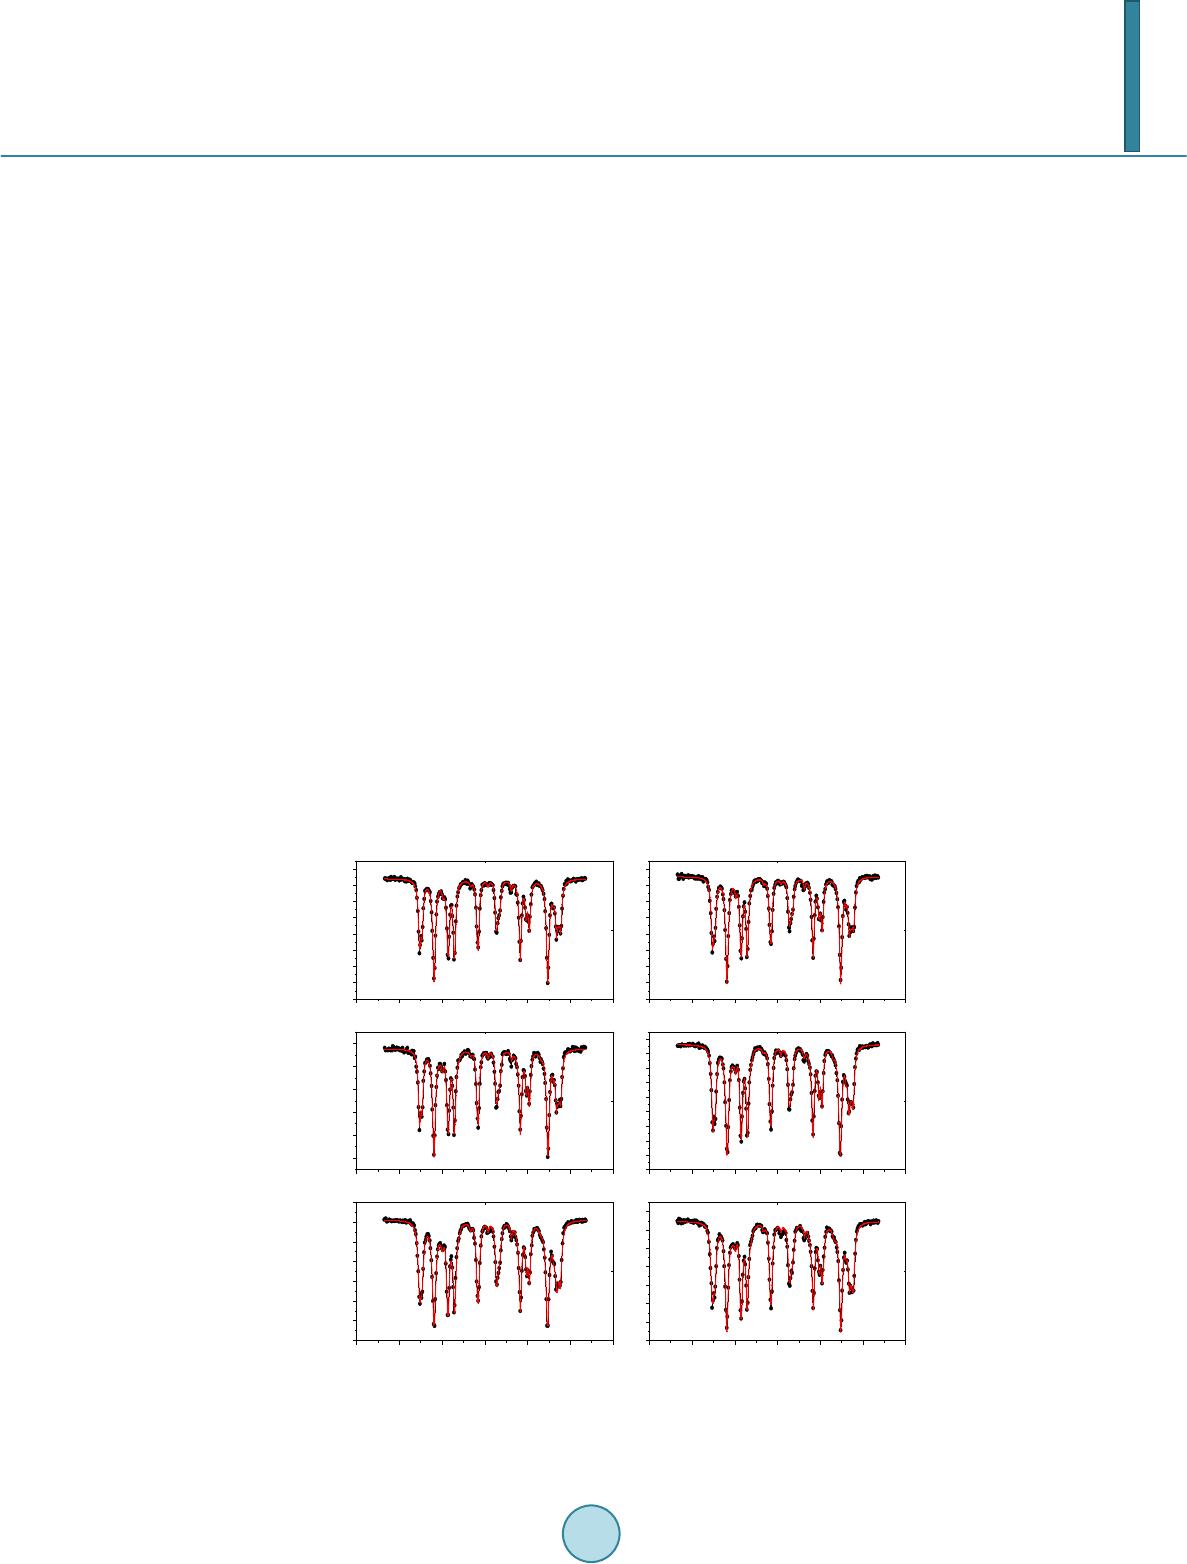 S. H. Mahmood et al. 3.3. Mössbauer Spectroscopy Mössbauer spectra of all samples are shown in Figure 4. Each spectrum was fitted with magnetically split sextet components corresponding to iron ions in the five crystallographic sites 4f2, 4f1, 2a, 12k, 2b of the BaM hexafer- rite structure, and the fitting parameters are listed in Table 1. The hyperfine parameters for pure sample are in good agreement with the results of previous studies [40,41]. The observed deviations of the relative intensities form the theoretical values of 16.7%:8.3%:16.7%, 50.0%:8.3%, respectively, could be due to differences in Mössbauer Lamb factors for the different sites, leading to different absorption efficiencies. Assuming that the absorption efficiencies do not vary with the low level of substitution in our samples, the number of Fe3+ ions at each site per formula was derived by multiplying the corresponding relative intensity by the number of Fe ions in the molecule. Figure 5 shows the site multiplicity for the 2b and 12k sites (normalized to their values for the un-substituted sample). It is well known that the substitution of non-magnetic ions at 2b sites reduces the hyper- fine fields at neighboring 12k and 4f2 sites [15]. As a consequence, the intensities of the 2a and 4f1 components would increase and spectral line-width of the 12k component would enhance for small amounts of substituents (as observed in the sample with x = 0.05, where the inner lines for the 12k component increases from 0.27 mm/s to 0.32 mm/s). For higher concentrations of the substituents, the 12k component could split into two components, with the lower field component (12k1) corresponding to those 12k sites neighboring substituted sites. Further, the substitution at 4f1 site (which is the preferred site for Zn2+ ions) perturbs the 2a and 12k sites, which results in the reduction in hyperfine fields for the sites neighboring Zn2+ ions. As a consequence, the 12k1 component appears at higher concentration levels. The splitting of the 12k component was observed in other hexaferrite systems with some kinds of substituents for Fe ions [34,43,45,46]. The data shown in Table 1 (and Figure 5) demonstrate preference for substitution at 2b, 12k and 4f2 sites for low x values. Since ions with high valence states energetically favor octahedral sites, we can assign the drop in relative intensity for the 2b spectral component to partial substitution of Zn2+ ions at 2b sites in this concentration region, and the drop in the relative intensities for the 12k and 4f2 components to substitution of Mo4+ions at these sites. It is also observed that as x increases from 0.05 to 0.15 the 2b and 12k sites get less substituted, where Zn2+ starts partially entering 4f1 site and Mo4+partially occupying other octahedral sites (4f2 and 2a). For the samples with x = 0.2 and 0.3 the 2b site is only slightly occupied, while substitution of the 12k site becomes evident. However, the overlap of the 2a, 4f1 -15 -10-5 05 1015 -15-10-5 05 10 15 -15 -10-5 05 1015 -15 -10-5 05 10 15 -15 -10-5 05 1015 -15-10-5 05 10 15 Int. (arb. units) x = 0 Int. (arb. units) x = 0.05 Int. (arb. units) x = 0.10 Int. (arb. units) x = 0.15 Int. (arb. units) Velocity (mm/s) x = 0.20 Int. (arb. units) Velocity (mm/s) x = 0.30 Figure 4. Mössbauer spectra for the BaFe12-2xMoxZnxO19 samples (filled circles) together with the theoretical spectrum obtained from the fitting (continuous line). 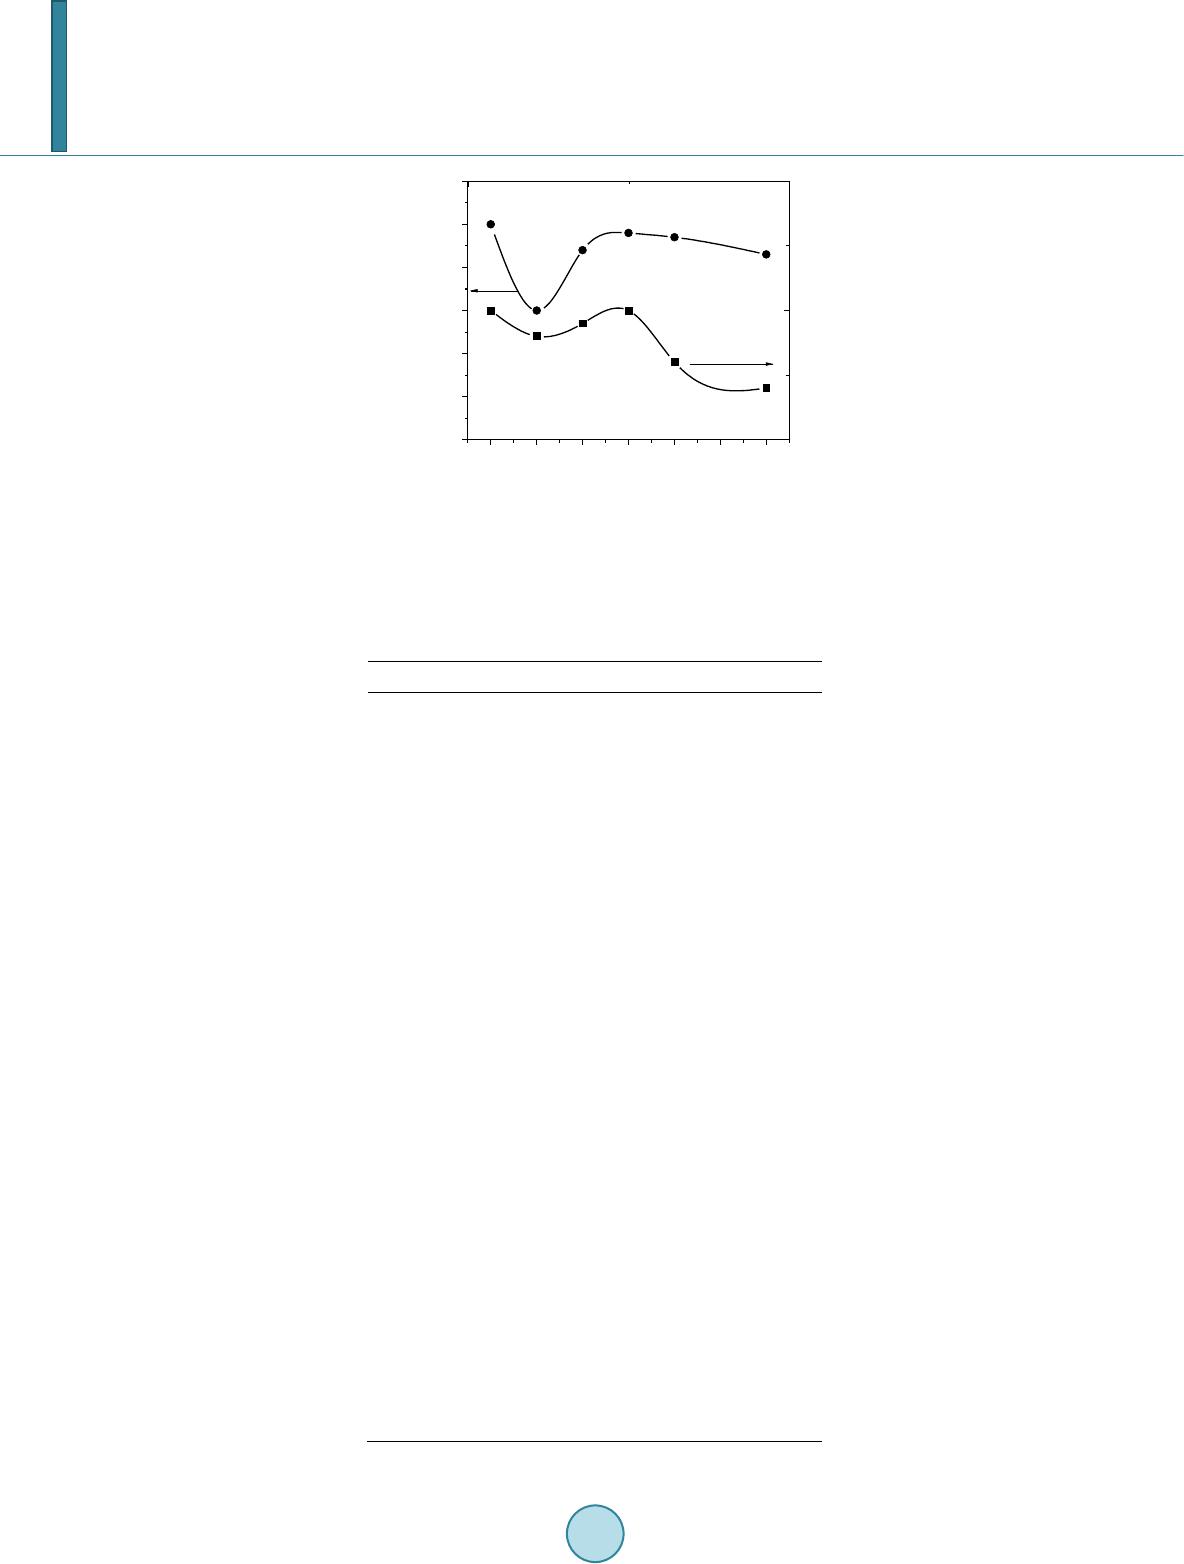 S. H. Mahmood et al. 0.00 0.05 0.10 0.15 0.20 0.25 0.30 0. 5 0. 6 0. 7 0. 8 0. 9 1. 0 1. 1 n(2b) x 0. 9 1. 0 1. 1 n(12k ) Figure 5. Normalized 2b and 12k site multiplicities de- rived from the relative component intensities of Mössbauer spectra for BaFe12-2xMoxZnxO19samples. Table 1. The hyperfine (Bhf) fields [kOe], center shifts (CS) [mm/s], quadrupole splittings (QQ)[mm/s], and percentage rel- ative intensities (I) of the components of the spectra. Site 0.00 0.05 0.10 0.15 0.20 0.30 Bhf1 4f2 517 517 517 515 517 517 Bhf2 2a 511 512 511 508 498 515 Bhf3 4f1 493 493 493 491 495 493 Bhf4 12k 417 417 418 415 416 418 Bhf5 2b 403 405 4 07 405 407 406 Bhf 6 12k1 - - 372 366 3 70 372 CS1 0.38 0.38 0.38 0.38 0.38 0.38 CS2 0.37 0.36 0.37 0.39 0.53 0.38 CS3 0.27 0.27 0.27 0.27 0.26 0.28 CS4 0.37 0.37 0.37 0.36 0.36 0.37 CS5 0.32 0.32 0.31 0.31 0.30 0.31 CS6 - - 0.37 0.34 0.33 0.36 QQ1 0.23 0.25 0.23 0.21 0.15 0.21 QQ2 0.07 0.06 0.06 0.07 0.06 0.14 QQ3 0.22 0.22 0.22 0.21 0.19 0.21 QQ4 0.42 0.42 0.42 0.40 0.39 0.41 QQ5 2.20 2.17 2.17 2.19 2.20 2.16 QQ6 - - 0.34 0.34 0.35 0.35 I1 16. 9 16.1 16.5 17.3 17.3 17.7 I2 10.7 11.9 10. 9 6.8 4.1 10. 3 I3 16. 8 17.8 16.8 18.9 23.0 17. 2 I4 50.4 50.0 48. 7 49.6 47.3 46.2 I5 5.1 4.1 4.9 5.1 5.3 5.0 I6 - - 2.1 2.3 3.0 3.6  S. H. Mahmood et al. and 4f2 components due to perturbation induced by the substituents make it difficult to consider their hyperfine parameters with high confidence. Thus it suffices here to observe the general behavior of variations of the rela- tive intensities to explain the magnetic data, keeping in mind the preferential site occupation of the different ca- tions. 3.4. Magnetic Measurements The hysteresis loops for all samples are shown in Figure 6, where σ is the specific magnetization per gram sam- ple. It is obvious that saturation was not achieved by applying fields up to 10 kOe. The magnetization in the high -field region is dominated by domain rotation, and the magnetization is given by the law of approach to sa- turation [47]: (3) Here χH is the forced magnetization term, Ms is the spontaneous saturation magnetization of the domains per unit volume, A is a constant representing the contributions of inclusions and microstress, and B represents the contribution of magnetocrystalline anisotropy. For hexagonal crystals we have: Here χH is the forced magnetization term, Ms is the spontaneous saturation magnetization of the domains per unit volume, A is a constant representing the contributions of inclusions and microstress, and B represents the contribution of magnetocrystalline anisotropy. For hexagonal crystals we have: . (4) . (5) whe r e Ha is the anisotropy field and K1 is the first anisotropy constant. A plot of σ vs. 1/H2 in the field region 8 kOe < H < 10 kOe for each sample gave a straight line, the intercept of which determined the saturation magnetization for the sample. The slope of the straight line was used to de- termine the anisotropy field and the first anisotropy constant according to Equations (4) and (5). Figure 7 shows the obtained saturation magnetizations for the samples, as well as the coercivity, determined directly from the hysteresis loops. The observed saturation magnetization is higher than that reported previously for BaM ferrites prepared by other techniques [26,27]. In our system, the saturation magnetization increases initially with x as a result of the increased level of substitution of Zn2+ ions at 4f1 and Mo4+ ions at 4f2 spin-down sites, and peaks at x = 0.15. The drop in saturation magnetization at higher x values results from the increased substitution of Mo4+ ions at 12k sites at the expense of 4f2 sites. This is consistent with Mössbauer intensities which indicated that the populations of the 4f2 sites by Fe3+ ions for the samples with x = 0.2 and 0.3 were almost equal to that for the pure sample, while the population of the 12k sites decreased appreciably. The saturation magnetization behavior for these two samples was dictated by the competition between the tendency to increase due to the increased concentration of Zn2+ ions in 4f1 spin-down site, and the tendency to decrease due to the increased concentration of Mo4+ in 12k spin-up site. Figure 8 shows the anisotropy fields and the anisotropy constants for the samples. The slight decrease in the anisotropy constant K1for x = 0.05 is consistent with Mössbauer relative intensities discussed above. The sin- gle-ion model can be used to calculate the anisotropy constants of our samples based on the contributions of the various sites [9] and the relative populations of these sites as derived from Mössbauer relative intensities. As- suming random distribution of Mo4+ ions at 12k and 4f2 sites and Zn2+ ions occupying 2b sites in the sample with x = 0.05 the calculated anisotropy constant is only 2% smaller than that for the pure sample, which is in good agreement with the value obtained from our magnetic data (2% decrease in Ha and 1.5% decrease in K1). The more significant drop in the anisotropy field for this sample is a consequence of the inverse dependence of this parameter on the saturation magnetization. A similar behavior with a more significant relative decrease is ob- served in the coercivity behavior. This can be explained by the dependence of the coercive field on the satura- tion magnetization. According to Stoner-Wohlfarth model for the random assembly of platelet-like particles with crystal anisotropy easy axis parallel to the c-axis and shape anisotropy easy axis in plane the coercive field is given by: . (6) whe r e Nd is the demagnetization factor. 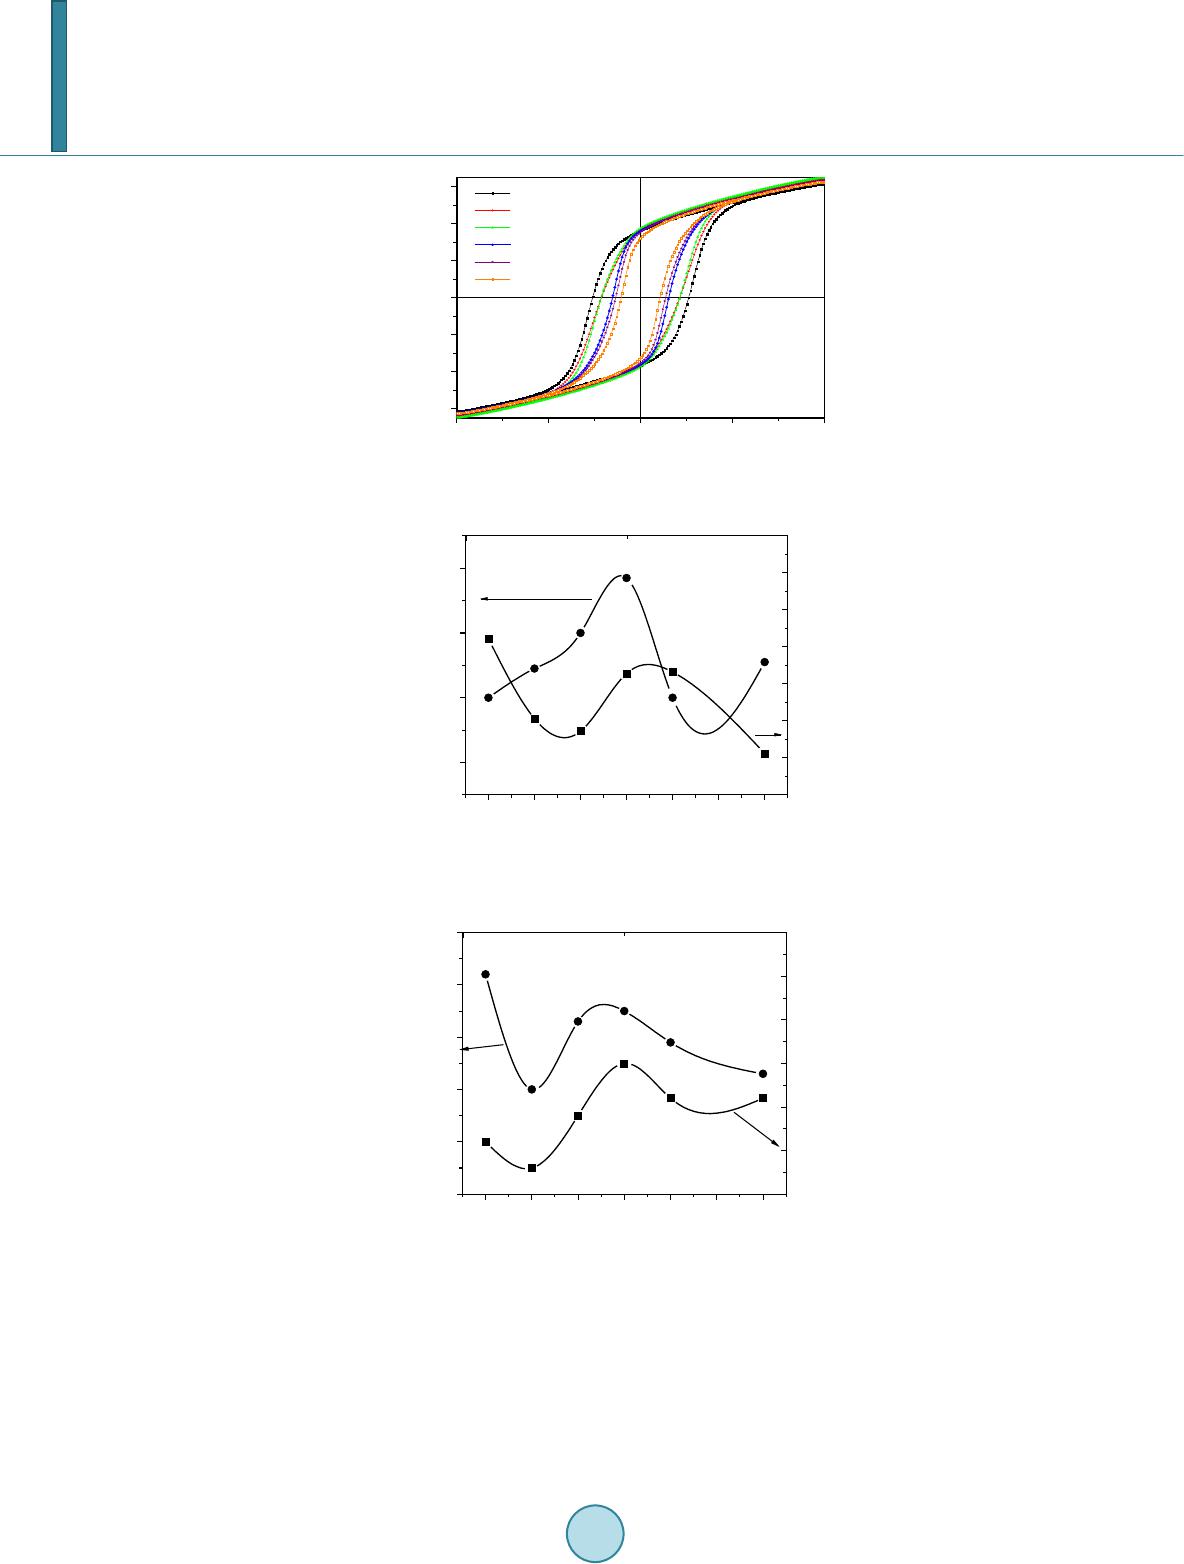 S. H. Mahmood et al. -1.0x10 4 -5.0x10 3 0.0 5.0x 10 3 1. 0x10 4 -60 -40 -20 0 20 40 60 σ (emu/g) H (Oe) x = 0.00 x = 0.20 x = 0.15 x = 0.05 x = 0.10 x = 0.30 Figure 6. Hysteresis loops for BaFe12-2xMoxZnxO19 samples. 0.00 0.05 0.10 0.15 0.20 0.25 0.30 66 68 70 72 σ s (emu/g) x 0. 5 1. 0 1. 5 2. 0 2. 5 3. 0 3. 5 4. 0 H C (kOe) Figure 7. Saturation magnetization and coercivity as a function of x. 0.00 0.05 0.10 0.15 0.20 0.25 0.30 11. 6 11. 7 11. 8 11. 9 12. 0 12. 1 Ha (kOe) x 2. 10 2. 15 2. 20 2. 25 2. 30 2. 35 2. 40 K1 (106erg/ c m3) Figure 8. The magnetic anisotropy field and the first aniso- tropy constant as a function of x. For the sample with x = 0.05, the anisotropy constant decreases and the saturation magnetization increases, both effects leading to a decrease in coercivity, which is demonstrated by the significant drop in the coercivity for this sample. For the samples with higher x = 0.10 and 0.15 both the saturation magnetization and the aniso- tropy constant increase, leading to competition between these two effects, and resulting in an initial decrease and then an increase in coercivity. The coercivities for these two samples are still below that for the pure sample, in-  S. H. Mahmood et al. dicating that the effect of the rise in saturation magnetization is dominant in these two samples. For x = 0.20, both the anisotropy constant and the saturation magnetization decrease, resulting also in competition between the two effects. Also, the weakening of the super exchange interactions induced by the reduction of the spin- down and spin-up sublattices could play a role in reducing the anisotropy field. Competition between these fac- tors appears to have the same effect on the coercivity as for the sample with x = 0.15. The further decrease in coercivity for the sample with x = 0.30 could be partially associated with the increase in saturation magnetiza- tion with respect to the sample with x = 0.20, and partially due to the further reduction in the strength of the su- perexchange interactions as demonstrated by the reduction in the anisotropy field. The reduced remnant magne- tization (σr/σs) for samples with 0.0 ≤ x ≤ 0.2 fall between 0.47 and 0.51, indicating that these samples consist of single domain particles. However, the reduced remanence for the sample with x = 0.3 is 0.44, which could indi- cate the presence of a significant fraction of multidomain particles in this sample. These multidomain particles could also be partially responsible for the observed significant decrease in coercivity. 4. Conclusion The simple wet chemical mixture method used to prepare BaFe12-2xMoxZnxO19 hexaferrite precursors gave sam- ples with relatively high saturation magnetization (68 - 72 emu/g) and low coercivity (1.1 - 2.6 kOe). These magnetic parameters are suitable for applications in high density magnetic recording. The partial substitution of Fe3+ ions lead to a redistribution of the ions at the various sites of the hexaferrite lattice, and resulted in changes of the magnetic properties consistent with the relative intensities of Mössbauer sub-spectra. Acknowledgements This work was supported by a generous grant from the Deanship of Scientific research at the University of Jor- dan under contract number 1404. References [1] Pullar, R.C. (2012) Progress in Materials Science, 57, 1191. http://dx.doi.org/10.1016/j.pmatsci.2012.04.001 [2] Özgü r, U., Alivov, Y. and Mor koç, H.J. (20 09 ) Journal of Materials Science: Materials in Electronics, 20, 789. http://dx.doi.org/10.1007/s10854-009-9923-2 [3] Qiu , J., La n , L., Zhang, H. and Gu, M. (20 06 ) Materials Science and Engineering: B, 133, 191. http://dx.doi.org/10.1016/j.mseb.2006.06.049 [4] Ghase mi, A. and Moris ako, A. (2008) Journal of Alloys and Compounds, 456, 485. http://dx.doi.org/10.1016/j.jallcom.2007.02.101 [5] Ghase mi, A., Hossienpour, A., Morisak o, A., Liu , X. and Ashrafiz ad eh, A. (2008 ) Materials & Design, 29, 112. http://dx.doi.org/10.1016/j.matdes.2006.11.019 [6] Dursu n, S., Top kaya, R., Akdo gan , N. and Al k o y, S. (2012) Ceramics International, 38, 3801. [7] http://dx.doi.org/10.1016/j.ceramint.2012.01.028 [8] Wis e, A.T., Rocks J. Laughlin, D.E., McHenry, M.E., Yo o n , S.D., Vittoria, C. and Harris, V.G. (2011) Journal of Ap- plied Physics, 109 , 07 E53 5. [9] Zhang, W., Bai, Y., Han, X., Wang, L., Lu , X. an d Qi ao, L. (2013) Journal of Alloys and Compounds, 546, 234. http://dx.doi.org/10.1016/j.jallcom.2012.08.029 [10] Xu, Y., Yang, G.L., Chu, A.P . and Z hai, H.R. (1990) Physica Status Solidi (B), 157, 685. http://dx.doi.org/10.1002/pssb.2221570221 [11] Awawdeh, M., Bsoul, I. and Mahmood, S.H. (20 14) Journal of Alloys and Compounds, 585, 465. http://dx.doi.org/10.1016/j.jallcom.2013.09.174 [12] Bsoul, I. and Mahmood, S.H. (2010 ) Journal of Alloys and Compounds, 489, 11 0. http://dx.doi.org/10.1016/j.jallcom.2009.09.024 [13] Qiu, J., Wan g, Y. an d Gu , M. (2006 ) Materials Letters, 60, 272 8. http://dx.doi.org/10.1016/j.matlet.2006.01.079 [14] Meaz, T.M. and Bender Koch, C. (2005) Hyperfine Interactions, 166, 45 5. http://dx.doi.org/10.1007/s10751-006-9308-3 [15] Dha ge, V.N., Man e, M.L., Babrekar, M.K., Kale, C .M. and Jadhav, K.M. (2011 ) Journal of Alloys and Compounds, 509, 4394. http://dx.doi.org/10.1016/j.jallcom.2011.01.040  S. H. Mahmood et al. [16] Kreber , E. and Gonser, U. (1973) Applied Physics, 1, 339. http://dx.doi.org/10.1007/BF00884403 [17] Shirtcliffe, N.J., Thompson, S., O’ K e efe, E.S., Appleton, S. and Perry, C.C. (2007) Mater. Res. Bull., 42, 281. http://dx.doi.org/10.1016/j.materresbull.2006.06.001 [18] Bsoul, I., Mahmood, S.H. and Lehlooh, A.-F. (2010) Journal of Alloys and Compounds, 498, 157. http://dx.doi.org/10.1016/j.jallcom.2010.03.142 [19] Tan g, X., Yang, Y. an d Hu, K.A. (2009) Journal of Alloys and Compounds, 477, 488. http://dx.doi.org/10.1016/j.jallcom.2008.10.052 [20] Mendo za-Suár ez, G., Riva s-V ázquez, L.P., Corral-Huacu z, J.C., Fuent es, A. F. an d Escalan te-García, J.I. (2003) Mat e- rials Research Bulletin, 339, 110. http://dx.doi.org/10.1016/j.physb.2003.08.120 [21] Gao , X., Du, Y., Li u , X., Xu, P. an d Han, X. (2011) Mater. Res. Bull., 46, 643. http://dx.doi.org/10.1016/j.materresbull.2011.02.002 [22] S oman, V.V., Nanot i, V .M . and Kulkarni, D.K. (2013) Ceramics International, 39, 5713. http://dx.doi.org/10.1016/j.ceramint.2012.12.089 [23] Ven kateshwarlu , Ch., Ashok, Ch., Appa Rao, B., R avind er, D. and Boyanov, B.S. (2006) Journal of Alloys and Com- pounds, 426, 1. http://dx.doi.org/10.1016/j.jallcom.2006.02.001 [24] Topal, U. (2011 ) Materials Science and Engineering: B, 176, 1531. http://dx.doi.org/10.1016/j.mseb.2011.09.019 [25] Du, Y., Gao, H., Liu , X., Wan g, J., Xu, P. and Han, X. (2010) Journal of Materials Science, 45, 2442. http://dx.doi.org/10.1007/s10853-010-4215-z [26] Teh , G.B., Saravanan, N. and Jefferson , D.A. (2007) Materials Chemistry and Physics, 105, 25 3. http://dx.doi.org/10.1016/j.matchemphys.2007.04.054 [27] Sӧzer i, H., Durmuş, Z., Baykal, A., Uysal, E. (2012) Materials Science and Engineering: B, 177, 949. [28] Marti rosyan, K.S., Galst yan, E., Hossain , S.M., Wang, Y.-J. and Litvinov, D. (2011) Materials Science and Engineer- ing: B, 176, 8. http://dx.doi.org/10.1016/j.mseb.2010.08.005 [29] Tan g, X., Zhao , B. Y . and Hu, K.A. (2006) Journal of Materials Science, 41, 3867. http://dx.doi.org/10.1007/s10853-006-6676-7 [30] Han, M., Ou, Y., C hen , W. and De ng, L. (2009) Journal of Alloys and Compounds, 474, 185. http://dx.doi.org/10.1016/j.jallcom.2008.06.047 [31] Iqbal, M.J., Ash i q , M.N. an d Gomez, P.H. (2009) Journal of Alloys and Compounds, 478, 736. http://dx.doi.org/10.1016/j.jallcom.2008.11.136 [32] Albanese, G. (1977) Journal of Physics, 38, C1-85. http://dx.doi.org/10.1051/jphys:019770038010100 [33] Qiu, J., Lan , L., Zhang, H. and Gu, M. (2008 ) Journal of Alloys and Compounds, 453, 26 1. http://dx.doi.org/10.1016/j.jallcom.2006.11.059 [34] González-Ang eles, A., Li p ka , J., Grusková, A., Jančárik, V ., Tóth, I. and Slá ma , J. (2008) Hyperfine Interactions, 184, 135. http://dx.doi.org/10.1007/s10751-008-9778 -6 [35] Bsoul, I., Mahmood, S.H., Lehlo oh , A.-F. and Al-Ja me l, A. (2013) Journal of Alloys and Compounds, 551, 490. http://dx.doi.org/10.1016/j.jallcom.2012.11.062 [36] Lip ka , J., Grusková, A., Orlicky, O., Sitek, J., Miglierini, M., Gr one , R., Hucl, M. and Tóth, I. (1990) Hyperfine Inter- actions, 59, 381. http://dx.doi.org/10.1007/BF02401253 [37] Kreber , E. and Gonser, U. (1976) Applied Physics, 10, 175. http://dx.doi.org/10.1007/BF00896336 [38] Jacob o, S.E., Domingo-Pascual, C., Rod rigu ez-C lemente, R. and Bl esa, M.A. (1997) Journal of Materials Science, 32, 1025. http://dx.doi.org/10.1023/A:1018582423406 [39] Grusková, A., Slá ma , J., Dosoudil, R., Kevická, D., Jančárik, V. and Tót h , I. (2002) Journal of Magnetism and Mag- netic Materials, 242 -245, 423. http://dx.doi.org/10.1016/S0304-8853(01 )01 13 9-8 [40] Chen , Y.L., Li, X.D. and Xu, B.F. (1990 ) Hyperfine Interactions, 62, 219. http://dx.doi.org/10.1007/BF02397701 [41] Evan s, B.J., Grandjean , F., Lilot, A.P., V o gel, R.H. and Gérard, A. (1987) Journal of Magnetism and Magnetic Mate- rials, 67, 123. http://dx.doi.org/10.1016/0304-8853(87)90728-1 [42] Gao , F., Li, D. and Zhang, S. (2003) Journal of Physics: Condensed Matter, 15, 5079. http://dx.doi.org/10.1088/0953-8984/15/29/319 [43] Meaz, T.M. and Bender, Koch C. (2004) Hyperfine Interactions, 156/15 7, 341. http://dx.doi.org/10.1023/B:HYPE.0000043251.88839.a1 [44] Dushaq , G.H., Mahmood, S.H., Bsoul, I., Juwhari, H.K., Lahlouh, B. and AlDame n, M. A. (2013) Acta Metallurgica  S. H. Mahmood et al. Sinica, 26, 509. http://dx.doi.org/10.1007/s40195-013-0075-2 [45] Warren, B.E. (19 69) X-Ray Diffr action. Addison-Wesley, Reading, MA. [46] Kaur, B., Bh a t , M. , Licci, F., Kumar, R., Kulkarni, S.D., Jo y, P.A., Bamzai, K.K. and Ko t r u , P.N. (2006) Journal of Magnetism and Magnetic Materials, 305, 392. http://dx.doi.org/10.1016/j.jmmm.2006.01.110 [47] González-Ang eles, A., Mendoza-Suárez, G., Grusková, A., Pap áno vá, M. and Sl áma, J. (2005) Materials Letters, 59, 26. http://dx.doi.org/10.1016/j.matlet.2004.09.012s [48] Cullity, B.D. and Grah a m, C.D. (2009) Introduction to Magnetic Materials. Wiley, Hoboken, New Jersey.
|