Paper Menu >>
Journal Menu >>
 Applied Mathematics, 2011, 2, 504-507 doi:10.4236/am.2011.24065 Published Online April 2011 (http://www.SciRP.org/journal/am) Copyright © 2011 SciRes. AM A New Bandwidth Interval Based Forecasting Method for Enrollments Using Fuzzy Time Series Hemant Kumar Pathak1, Prachi Singh2 1S. O. S. in Mathematics, Pandit Ravishankar Shukla University, Raipur, India 2Government VYT Post Graduate Autonomous College, Durg, India E-mail: hkpathak@sify.com, prachibksingh@gmail.com Received February 25, 2011; revised March 11, 2011; accepted March 14, 2011 Abstract In this paper, we introduce the concept of (4/3) bandwidth interval based forecasting. The historical en- rollments of the university of Alabama are used to illustrate the proposed method. In this paper we use the new simplified technique to find the fuzzy logical relations. Keywords: Fuzzy Sets, Fuzzy Time Series, Fuzzy Logical Relations 1. Introduction For planning the future forecasting plays an important role. During last few decades, various approaches have been developed for forecasting data of dynamic and non- linear in nature. Fuzzy theory [1] has been successfully employed to prediction. Many studies on forecasting using fuzzy logic time series have been discussed such as enrollments, the stock index, temperature and fi- nancial forecasting. Some researchers used time invariant model and some used time variant model. The traditional statis- tical approaches can not predict problems in which the values are in linguistic terms. After introduction of fuzzy sets by Zadeh [1], Song and Chissom [2] presented the definition of fuzzy time series and outlined its model by means of fuzzy relation equations, and approximate reasoning. They applied the model for forecasting under fuzzy environment in which historical data are of linguistic values. In that article, they showed that a universal forecasting method using fuzzy sets can be derived from the model of his process. After then many researchers ([2-7]) used this data to forecast. Cheng et al. [8] presented the trend-weighed fuzzy time model for TAIEX forecasting. Song et al. [2] and [9] used the relationship model, in which they constructed a relation matrix to relate the fuzzified enrollments of year (i – 1) and year i. Chen [3] presented a method which has the advantage of reducing the calculation time and sim- plifying the calculation process. Chen et al. [10] used the differences of the enrollments to present a method to forecast the enrollments of the University of Alabama. Huang [11] extended Chen’s [3] work and used simpli- fied calculations with the addition of heu- ristic rules to forecast the enrollments. Chen [4] presented a forecasting method based on high-order fuzzy time series for fore- casting the enrollments of the University of Alabama. Most of the forecasting methods require fuzzy relation. All such methods have following drawbacks: 1) Framing of fuzzy relation requires a lot of computa- tions. 2) Computation cost is very high. However, obtaining accurate forecast of student enroll- ment is not an easy task, as many factors determine the impact of the enrolment numbers. So, in the proposed method we introduced the interval based forecasting, wh- ich gives most plausible range of enrollments. 2. Basic Concepts of Fuzzy Time Series Let U = {u1, u2, u3, u4, ···, un} be the universe of dis- course and let A = |fA (u1)/u1| + |fA (u2)/u2 + ··· + |fA (un)/un| be the fuzzy set defined on U. Here fA: U[0,1] is the membership function of A, fA (ui), i [1,n] indicates the grade of membership of ui in the fuzzy set A. 2.1. Fuzzy Time Series Let X(t) (t = 0,1,2, ···) be the universe of discourse and the fuzzy set defined on X(t) be fi(t) (t = 0,1,2, ···). Then F(t) = fi(t) t = 0,1,2, ···, i = 1,2, ··· the collection of all fuzzy sets defined on X(t) is called a fuzzy time series of X(t) (t = 0,1,2, ···).  H. K. PATHAK ET AL. Copyright © 2011 SciRes. AM 505 2.2. Fuzzy Relation If F(t) is caused by F(t – 1), denoted by F(t) F(t – 1), then this relationship can be represented by F(t) = F(t – 1) * R(t, t – 1), where * denotes the composition operator and R(t, t – 1) is a fuzzy relation between F(t) and F(t – 1). 2.3. First Order Model The model in which the relation R(t, t – 1) is a fuzzy re- lation between F(t) and F(t – 1) is called the first order model of F(t). 2.4. Time Invariant Fuzzy Time Series If in first order model of F(t) relation R(t, t – 1) = R(t – 1, t – 2) for any time t, then F(t) is called time invariant fuzzy time series. 2.5. Time Variant Fuzzy Time Series If in first order model of F(t) relation R(t, t – 1) ≠ R(t – 1, t – 2) for any time t, then F(t) is called time invariant fuzzy time series. 3. Proposed Method We now discuss our proposed method. The historical data and proposed method are shown in Tabl e 1. Repeat Steps 1-3 of the method of Chen and Hsu [7] as follows. Step 1: Define the universe of discourse U = [13 000, 20 000] and partition it into several even and length intervals u1 = [13 000, 14 000], u2 = [14 000, 15 000], u3 = [15 000, 16 000], u4 = [16 000, 17 000], u5 = [17 000, 18 000], Table 1. Historical data and proposed method. Year Actual data Fuzzified input Fuzzified output Calculated enrollmnt Forecasted interval 1971 13 055 A1 1972 13 563 A2 A1 13 250 [12 104, 14 396] 1973 13 867 A2 A2 13 750 [12 604, 14 896] 1974 14 696 A3 A2 13 750 [12 604, 14 896] 1975 15 460 A5 A3 14 500 [13 354, 15 646] 1976 15 311 A5 A5 15 375 [14 229, 16 521] 1977 15 603 A6 A5 15 375 [14 229, 16 521] 1978 15 861 A7 A6 15 625 [14 479, 16 771] 1979 16 807 A9 A7 15 875 [14 729, 17 021] 1980 16 919 A9 A9 16 833 [15 687, 17 979] 1981 16 388 A8 A9 16 833 [15 687, 17 979] 1982 15 433 A5 A8 16 500 [15 354, 17 646] 1983 15 497 A5 A5, A6 15 500 [14 354, 16 646] 1984 15 145 A4 A5, A6 15 500 [14 354, 16 646] 1985 15 163 A4 A4 15 125 [13 979, 16 271] 1986 15 984 A7 A4 15 125 [13 979, 16 271] 1987 16 859 A9 A9 16 833 [15 687, 17 979] 1988 18 150 A10 A8, A9 16 667 [15 521, 17 813] 1989 18 970 A11 A10 18 125 [16 979, 19 271] 1990 19 328 A12 A11 18 750 [17 604, 19 896] 1991 19 337 A12 A12 19 500 [18 354, 20 646] 1992 18 876 A11 A12 19 500 [18 354, 20 646]  H. K. PATHAK ET AL. Copyright © 2011 SciRes. AM 506 u6 = [18 000, 19 000], u7 = [19 000, 20 000]. Sort the intervals based on the number of historical en- rollment data in each interval from the highest to lowest and find the interval having largest number of data. Re- divide this interval into four equal parts. Find the interval having second largest number data and re-divide it in three equal length sub-intervals find the interval having third largest number of data and re-divide it in two equal length sub-intervals. If there are no data in any interval then discard this interval. In this case the new distribu- tion is shown in Table 2. Step 2: Re-divide the intervals and rename them as follows: u1 = [13 000, 13 500], u2 = [13 500, 14 000], u3 = [14 000, 15 000], u4 = [15 000, 15250, u5 = [15 250,15 500], u6 = [15 500, 15 750], u7 = [15 750, 16 000], u8 = [16 333, 16 667], u9 = [16 667, 17 000], u10 = [18000, 18 500], u11 = [18 500, 19 000], u12 = [19 000, 20 000]. Step 3: Define each fuzzy set based on the re-divided intervals and fuzzify the data shown in Table 1, where fuzzy set Ai denotes a linguistic value of the data re- presented by a fuzzy set. A1 = very4 few = 1/u1 + 0.5/u2 A2 = very3 few = 0.5/u1 + 1/u2 + 0.5/u3 A3 = very2 few = 0.5/u2 + 1/u3 + 0.5/u4 A4 = very few = 0.5/u3 + 1/u4+ 0.5/u5 A5 = few = 0.5/u4 + 1/u5+ 0.5/u6 A6 = moderate = 0.5/u5 + 1/u6 + 0.5/u7 A7 = many = 0.5/u6 + 1/u7 + 0.5/u8 A8 = very many = 0.5/u7 + 1/u8 + 0.5/u9 A9 = too many = 0.5/u8 + 1/u9 + 0.5/u10 A10 = too many2 = 0.5/u9 + 1/u10 + 0.5/u11 A11 = toomany3 =0.5/u10 + 1/u11 + 0.5/u12 A12 = too many4 = 0.5/u11 + 1/u12 For simplicity the membership values of fuzzy set Ai are either 0, 0.5, 1. Notice that we have not displayed the membership value 0. Now we give the steps of our proposed method. Step 4: Fuzzify the data on Table 1. The reason for fuzzifying is to translate crisp values fuzzy sets to get a fuzzy time series. Now establish fuzzy logical relation- ships based on fuzzified data as “Aj Ak” means if the fuzzified enrollments of year (n – 1) is Aj then the fuzzi- fied enrollments of year n is Ak. Step 5: By Table 3 it is clear that the fuzzy logical re- lationship groups are as follows. Step 6: The fuzzified output is obtained by fuzzified input of previous years if 1) fuzzified input of nth year is Ai then fuzzified output of (n + 1)th year is also Ai (as in years 1971,1972, ···). 2) If the fuzzified input of nth year Table 2. Frequency of data. Intervals No. of data [13 000,14 000] 3 [14 000,15 000] 1 [15 000,16 000] 9 [16 000,17 000] 4 [17 000,18 000] 0 [18 000,19 000] 3 [19 000,20 000] 2 Table 3. Logical groups. Serial No. Fuzzy logical relationship groups 1 A1→A2 2 A2→A2, A2→A3 3 A3→A5 4 A4→A4, A4→A7 5 A5→A4, A5→A5, A5→A6 6 A6→A7 7 A7→A9 8 A8→A5 9 A9→A9, A9→A8, A9→A10 10 A10→A11 11 A11→A12 12 A12→A11, A12→A12 is Ai and in previous years we have got more relations as AiAj, AiAk, ··· then the fuzzified output will be (Aj, Ak, ···) (as in years 1983, 1984, 1988). Step 6: The fuzzified output is obtained by fuzzified input of previous years if 1)fuzzified input of nth year is Ai then fuzzified output of (n+1)th year is also Ai (as in years 1971,1972, ···). 2)If the fuzzified input of nth year is Ai and in previous years we have got more relations as AiAj, AiAk, ··· then the fuzzified output will be (Aj, Ak, ···) (as in years 1983, 1984, 1988). Step 7: Output values are the mid-values of the inter- vals in which the fuzzified output occurs. Step 8: Next we calculate the mean, standard devia- tion( ) of output and interval by formula [output –2/3 , output +2/3 ]. Step 9: Now we can plot graphs of intervals lower limit of forecasted interval(LL of fore), upper limit of forecasted interval(UL of fore) and actual data to see that 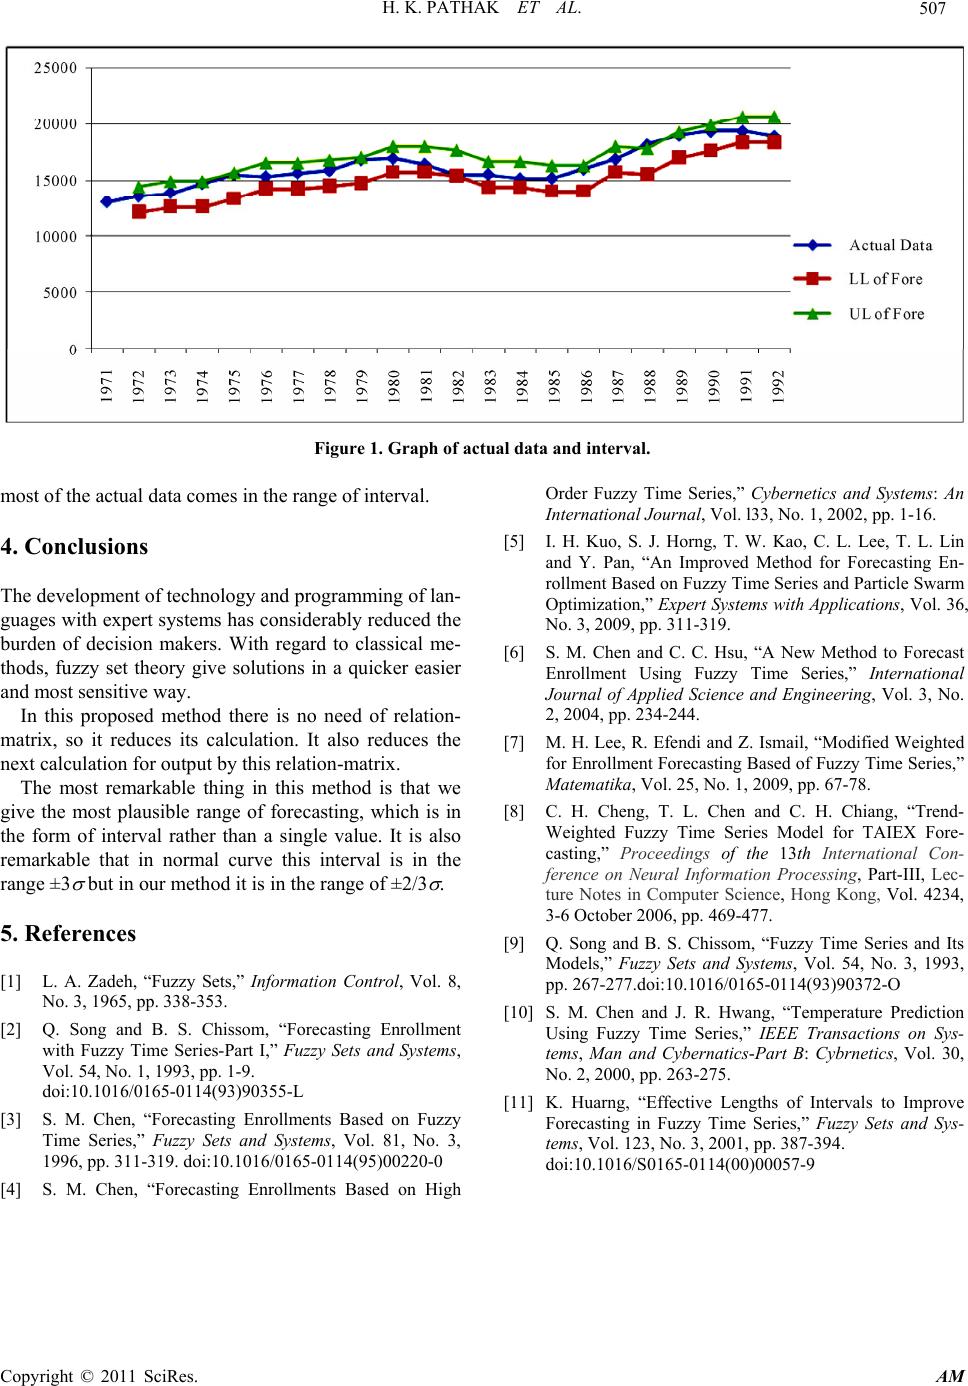 H. K. PATHAK ET AL. Copyright © 2011 SciRes. AM 507 Figure 1. Graph of actual data and interval. most of the actual data comes in the range of interval. 4. Conclusions The development of technology and programming of lan- guages with expert systems has considerably reduced the burden of decision makers. With regard to classical me- thods, fuzzy set theory give solutions in a quicker easier and most sensitive way. In this proposed method there is no need of relation- matrix, so it reduces its calculation. It also reduces the next calculation for output by this relation-matrix. The most remarkable thing in this method is that we give the most plausible range of forecasting, which is in the form of interval rather than a single value. It is also remarkable that in normal curve this interval is in the range ±3 but in our method it is in the range of ±2/3 . 5. References [1] L. A. Zadeh, “Fuzzy Sets,” Information Control, Vol. 8, No. 3, 1965, pp. 338-353. [2] Q. Song and B. S. Chissom, “Forecasting Enrollment with Fuzzy Time Series-Part I,” Fuzzy Sets and Systems, Vol. 54, No. 1, 1993, pp. 1-9. doi:10.1016/0165-0114(93)90355-L [3] S. M. Chen, “Forecasting Enrollments Based on Fuzzy Time Series,” Fuzzy Sets and Systems, Vol. 81, No. 3, 1996, pp. 311-319. doi:10.1016/0165-0114(95)00220-0 [4] S. M. Chen, “Forecasting Enrollments Based on High Order Fuzzy Time Series,” Cybernetics and Systems: An International Journal, Vol. l33, No. 1, 2002, pp. 1-16. [5] I. H. Kuo, S. J. Horng, T. W. Kao, C. L. Lee, T. L. Lin and Y. Pan, “An Improved Method for Forecasting En- rollment Based on Fuzzy Time Series and Particle Swarm Optimization,” Expert Systems with Applications, Vol. 36, No. 3, 2009, pp. 311-319. [6] S. M. Chen and C. C. Hsu, “A New Method to Forecast Enrollment Using Fuzzy Time Series,” International Journal of Applied Science and Engineering, Vol. 3, No. 2, 2004, pp. 234-244. [7] M. H. Lee, R. Efendi and Z. Ismail, “Modified Weighted for Enrollment Forecasting Based of Fuzzy Time Series,” Matematika, Vol. 25, No. 1, 2009, pp. 67-78. [8] C. H. Cheng, T. L. Chen and C. H. Chiang, “Trend- Weighted Fuzzy Time Series Model for TAIEX Fore- casting,” Proceedings of the 13th International Con- ference on Neural Information Processing, Part-III, Lec- ture Notes in Computer Science, Hong Kong, Vol. 4234, 3-6 October 2006, pp. 469-477. [9] Q. Song and B. S. Chissom, “Fuzzy Time Series and Its Models,” Fuzzy Sets and Systems, Vol. 54, No. 3, 1993, pp. 267-277.doi:10.1016/0165-0114(93)90372-O [10] S. M. Chen and J. R. Hwang, “Temperature Prediction Using Fuzzy Time Series,” IEEE Transactions on Sys- tems, Man and Cybernatics-Part B: Cybrnetics, Vol. 30, No. 2, 2000, pp. 263-275. [11] K. Huarng, “Effective Lengths of Intervals to Improve Forecasting in Fuzzy Time Series,” Fuzzy Sets and Sys- tems, Vol. 123, No. 3, 2001, pp. 387-394. doi:10.1016/S0165-0114(00)00057-9 |