 Journal of Power and Energy Engineering, 2014, 2, 438-447 Published Online April 2014 in SciRes. http://www.scirp.org/journal/jpee http://dx.doi.org/10.4236/jpee.2014.24059 How to cite this paper: Li, J.Q. and Chilukuri, M.V. (2014) Power Supply Quality Analysis Using S-Transform and SVM Clas- sifier. Journal of Power and Energy Engineering, 2, 438-447. http://dx.doi.org/10.4236/jpee.2014.24059 Power Supply Quality Analysis Using S-Transform and SVM Classifier Jiaqi Li1, M. V. Chilukuri2 1University of Nottingham, Nottingham, UK 2SMIEEE, University of Nottingham, Semen yih, Malaysia Email: guildlijiaqi@gmail.com Received January 2014 Abstract In this paper, a SVM cl assi fier based on S-Transform is presented for power quality disturbances classification. Firstly, seven types of PQ events are created using Matlab simulation. These signals are analyzed to detect and localize PQ events via S-Transform by visual inspection. Then five sig- nificant features of the PQ disturbances are extracted from the S-Transform output. Afterwards, PQ disturbance samples with the five features are fe d to SVM for training and automatic classifica- tion. Besides, particle swarm optimiz ation is implemented to improve the performance of SVM. The results of the classification indicate that SVM classifier is an effective mech anism to detect and classify power quality disturbances. Keywords Power Quality Disturbance; S-Tr ansfo rm; SVM 1. Introduction Nowadays, the electronic equipment and converting technology with high power quality demand are widely ap- plied. Therefore, increasing the electrical power quality has become a significant issue. There are 6 major PQ distortions na me ly voltage sags, swells, interruption, flicker, oscillatory transients and harmonics. To enhance the electrical power quality, the sources and courses of PQ disturbances have to be detected and classified. Normally, fuzzy expert system cluster classifier and SVM are applied. Recently, these classification technolo- gies include pattern recognition, data mining and order making. Raw data is pre-processed and features are ex- tracted to analyze the received data for automatic PQ problems resolution [1]. Traditionally, it is popular to analyze stationary signal with the Fourier Transform (FT) based method, which loses time the time imagination. In order to achieve effective extraction of information for non-stationary signals, Short Time Fourier Transform (STFT) depicting time-frequency domain i ss ue d. However, STFT can partly solve the problem because of the Heisenberg uncertainty principle [2], which makes it hard to detect short time resolution and high frequency resolution. Consequently, another analytical method called Wavelet Transform (WT) [3] is found to have better time-frequency characterization. It provides good frequency resolution for low- frequency events while offer nice time resolution for high-frequency events. In addition, WT is able to furnish the feature extraction of signals with continuous wavelet transform (CWT) and discrete wavelet transform  J. Q. Li, M. V. Chilukuri (DWT) [4]. However, wavelet transform is sensitive to noise. In 1996, Stockwell proposed a better approach called S-Transform (ST), which has a hybrid property of STFT and WT. Not only being immu ne to noise, but also ST utilizes a variable window length and preserves phase information during the decomposition with the application of the FT kernel [5]. Therefore, this paper reveals a group of optimal feature vectors extracted from ST for training the support vector machine (SVM). Then the trained SVM is enabled to classify different PQ disturbances. It should be no- ticed that the accuracy of the support vector machine is affected by the chosen features and the amount of train- ing data. The PQ disturbance data are simulated using Matlab GUI. Besides, the accuracy of SVM can also be improved by Particle Swarm Optimization. 2. S-Transform S-Transform can be presented in many methods. In this paper , ST is described as continuous wavelet transform (CWT) with Gaussian Window proportional to frequency. CWT of a function h(t) as: (,)()(,)Wdh tw dtdt ττ +∞ −∞ = − ∫ (1) where d is the scale parameter inverted from the fundamental frequency f defining the width of the wavelet . The S-Transform of can be obtained by multiplying a CWT, including a particular mother wave- let, with the phase factor (2) besides, the mother wavelet is 22 2 2 (, )2 tf i ft f wt fee π π −− = (3) The Equation (2) is not a strict CWT because of the failure of satisfying the value of zero mean for a wavelet shown in Equation (3). In the following, the ST can be defined as 22 () 2 2 (,)( )() 2 tf i ft f Sfh teedt τ π τπ − − ∞− −∞ = ∫ (4) and the width of the Gaussian window is defined as (5) with Fourier spectrum of , the ST can be expressed as 22 2 2 2 (, )(),0 a i ft f SfHfeed f π α τα α − ∞− −∞ =+≠ ∫ (6) In the discrete expression, the disturbance signal is written as with a sampling time space T and a total sampling number N. Its discrete FT can be presented as (2 ) 1 1 1() i nk NN k n Hh kT e NT N π − − = = ∑ (7) wit h . From the Equation (6), the S-Transform of a discrete time series can be achieved via making and to be and respectively. 2 1 0 ,(,), 0 i mj NN m n mn SjTHGm n en NT NT π − = + = ≠ ∑ (8) whe re (9)  J. Q. Li, M. V. Chilukuri , and N is the sampling number. When , [ ] 1 0 1 ,0 N m m S kTH N NT − = = ∑ (10) therefore, the discrete inverse of S-Transform can be achieved 2 11 00 1 () , i nk NN N nj n h kTSjTe N NT π −− = = = ∑∑ (11) The application of the FFT and the convolution theorem makes the discrete ST a quick way of computation. 3. Pq Analysis Using St In this section, six types of power quality disturbances, involving sag, swell, interruption, flicker, oscillatory transient and harmonic, are analyzed. It is not easy to obtain these complex PQ disturbances from utility power quality monitoring system due to confidentiality, thus above signals are simulated using MATLAB GUI. The results of power quality signals simulated are shown from Figures 1-6. In each figure, the first plot display the original waveform of a signal that amplitude versus time. The second axes contours the time—frequency plot revealing normalized frequency versus time ST-amplitude. In the following plot c, the time—maximum ampli- tude plot displaying maximum amplitude versus time can be achieved by seeking columns of ST-amplitude at every frequency. Besides, it demonstrates the ST-amplitude at fundamental frequency. In the fourth graph, it plots the frequency—maximum amplitude. In this plot, rows of ST amplitude are sought at every frequency to display maximum amplitude versus normalized frequenc y. The simulated power quality signals are displayed in the first part of Figures 1-6. In the second part, the out- comes of S-transform matrix are shown in contour plot. Besides, the maximum amplitude of each column and row in the S-transform matrix are illustrated in the third graph and the graph of Figures 1-6 respectively. Normalized Frequency Figure 1. PQ disturbance of sag.  J. Q. Li, M. V. Chilukuri No rmal ized Frequency Figure 2. PQ disturbance of swell. Normalized Frequency Figure 3. PQ disturbance of interruption.  J. Q. Li, M. V. Chilukuri Normalized Frequency Figure 4. PQ disturbance of flicker. Normalized Frequency Figure 5. Oscillatory transient. 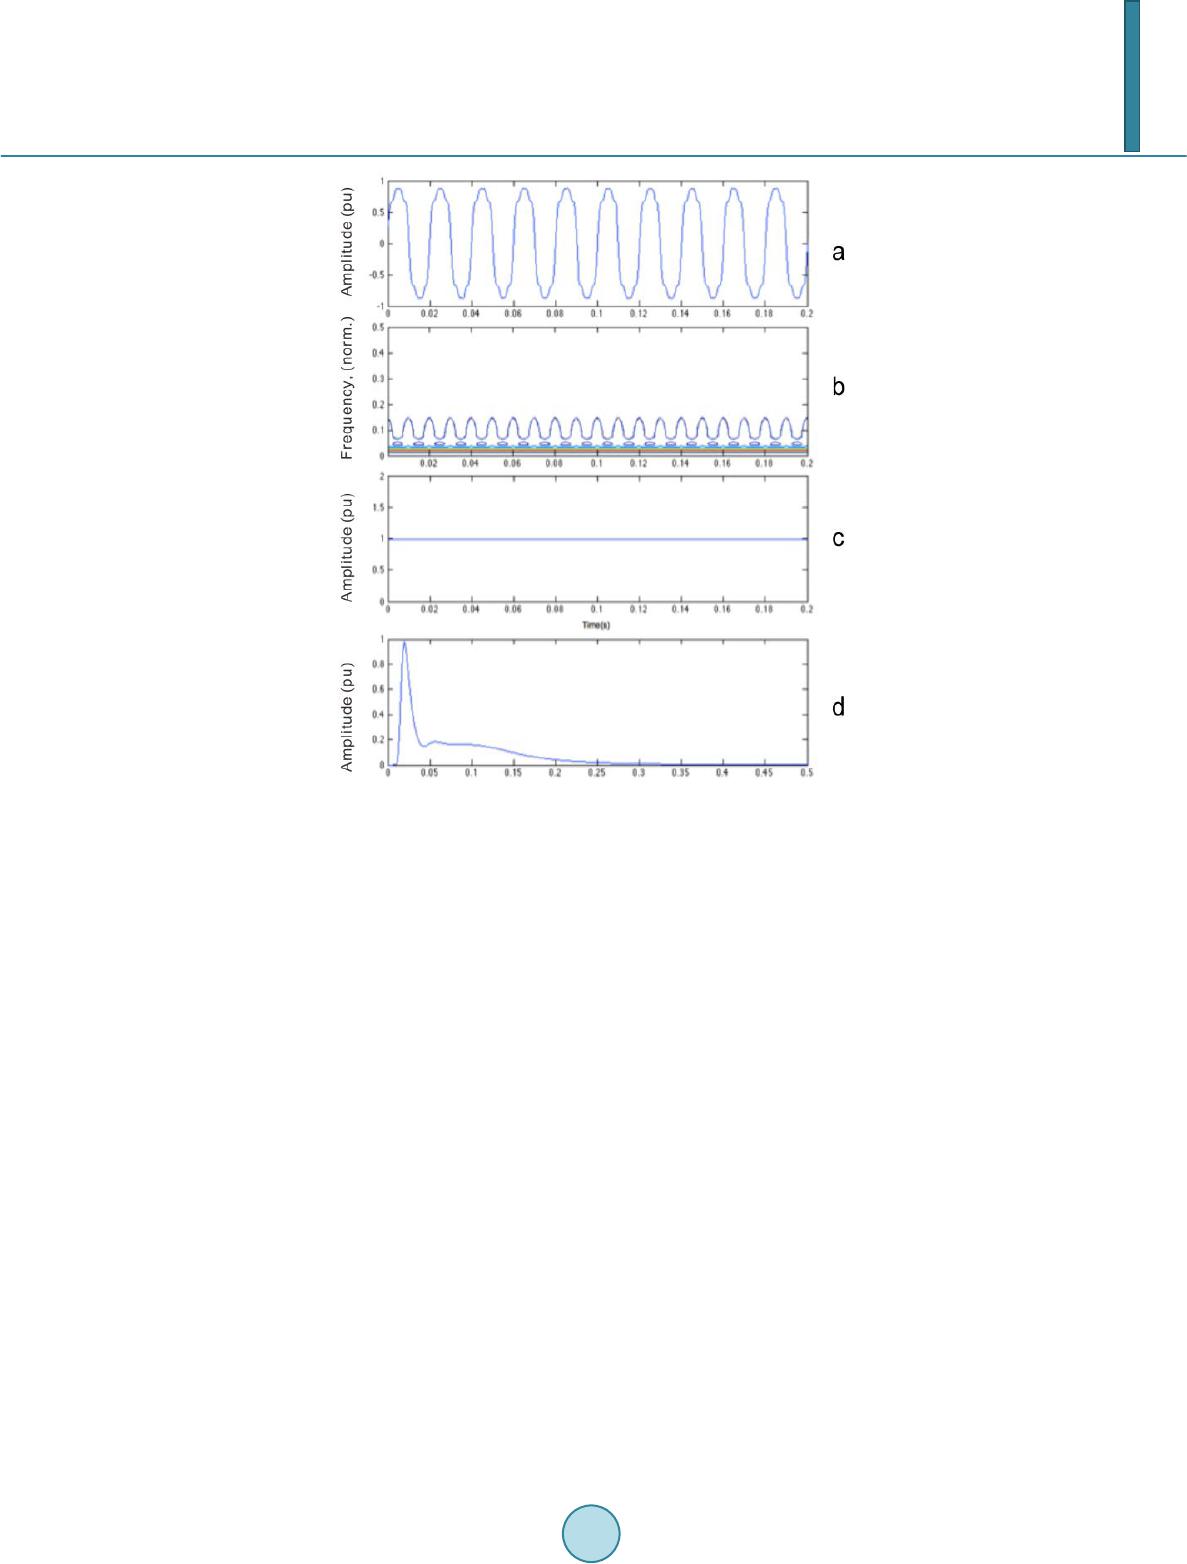 J. Q. Li, M. V. Chilukuri Normalized Frequency Figure 6. PQ disturbance of harmonic. 4. Features Extraction From the PQD plots shown above, major features of power quality disturbance can be extracted. According to the characteristics of seven PQ events, which are normal signal, voltage sag, swell, interruption, flicker, oscilla- tory transient and harmonic, the following five significant features are computed to classify distur b a nces. (a) refers to the standard deviation of the time-maximum amplitude plot (TmA-plot) presenting the am- plitude of fundamental frequency. (b) is the maximum value of frequency in the time-frequency plot. (c) refers to the frequency-maximum amplitude plot (FmA-plot). (d) is the mean value of TmA-plot. (e) distinguishes voltage sag and interruption by searching the number of peaks in the time-frequency plot. To demonstrate the relation between the features defined above, 45 sets data of each kind of the seven power quality cases are sampled at a sampling frequency of 2.56 kHz. Besides, random white noises with SNR (signal to ratio) rating from 50 to 20 and zero mean is added to these PQ events [6]. For instance, two results are dis- played in Figures 7 and 8. In Figure 7, it presents the seven PQ cases in the plot of Feature 1 versus Feature 2. The magnitudes of dis- turb ances and noises added to the cases are changing for displaying the difference in the feature scatter. From this graph, normal signal, oscillatory and harmonic are clearly separated from the other four power quality dis- turbances. Figure 8 shows that voltage swell, flicker, sag and interruption are classified. The black crowd is a group of oscillatory transient, normal signal and harmonic, which does not interfering the classification for the front four disturbances. It proves that feature4 is able to differentiate voltage swell, flicker, sag and interruption effectively. From these graphs, it is easy to be observed that different types of power quality cases showing varying fea- tures can be classified automatically. 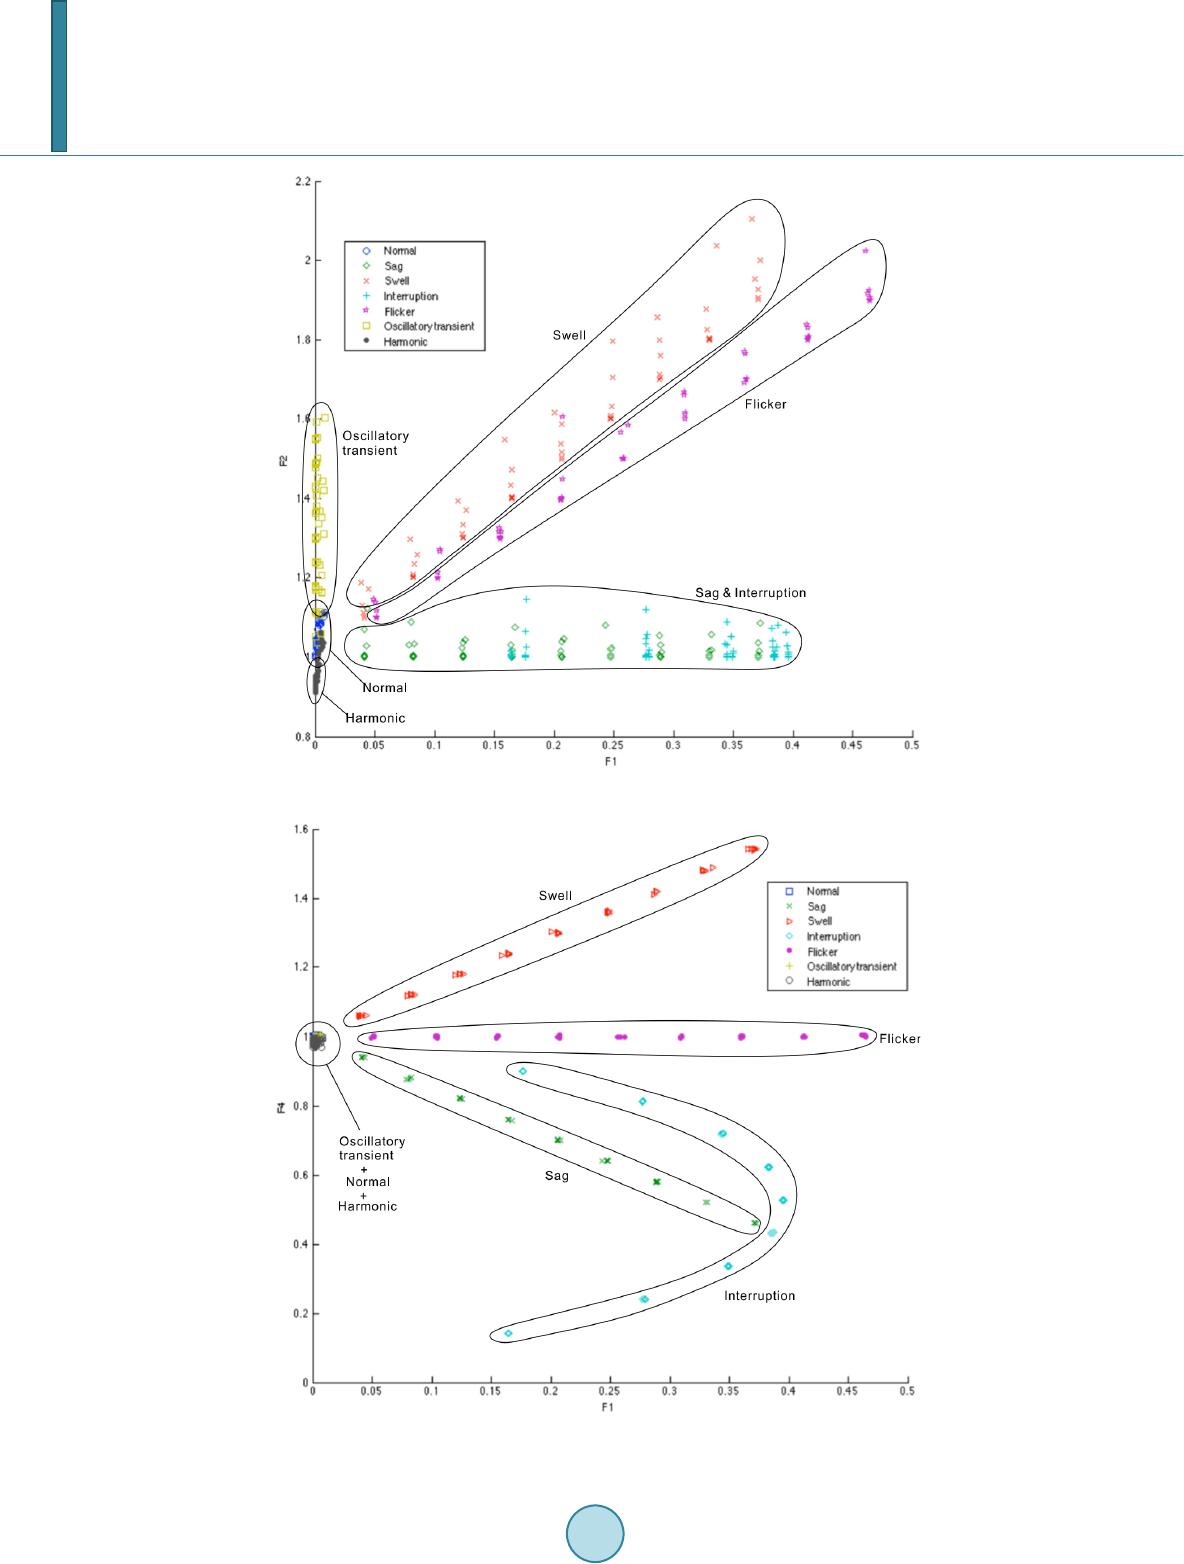 J. Q. Li, M. V. Chilukuri Figure 7. Feature 1 versus Feature 2 scatter. Figure 8. Feature 1 versus Feature 4 plot.  J. Q. Li, M. V. Chilukuri is a good evidence to distinguish between the group of normal voltage signal, oscillatory transient and harmonic with the group of voltage sag, swell, interruption and flicker. separates harmonic and oscillatory transient while can differentiate normal voltage signal and oscillatory transient in most cases. is a strong distinguishing base. For voltage sag and interruption, should be smaller than 0.96. Besides, approximately equals to 1 for flicker whereas is bigger than 1.05 for voltage swell. Therefore, the following rule base is defined corresponding to different type of power quality disturbances. 5. Power Quality Disturbance Classification Using Support Vector Machine Support vector machine (SVM) is an algorithm with great advantages for classification developed from Statis- tical Learning Theory by Vapnik [7]. Firstly, it provides accurate classifier with support vectors, which is robust to noise. Secondly, the application of kernel function facilitates SVM to solve nonlinear problems without con- structing a feature space with explicit high dimension. Thirdly, SVM is capable to be applied for both binary and multiclass classification. The main procedures of SVM classifier are showed as Figure 9. SVM separating two different groups of data by searching a hyperplane provides higher classification accuracy according to F. Qi et al. [8], though there are subordinate mistakes for small sample, nonlinear and high dimensional pattern recognition issues. As a result, SVM classifier is exploited as pattern classifier for power quality disturbance classification. After the vectors struct is obtained, predictions for new data can be made by the trained SVM. The best solution G and the tradeoff parameter C are two significant factors affecting the prediction accuracy of the SVM model. Nevertheless, the parameters G and C are varying, which indicates that it is difficult to gain the optimal one. As a result, partial swarm optimal (PSO) is applied to find the desired G and C for support vector machines automatically. 6. Discussion The data of power quality events used in classification are developed using Matlab simulation with a sampling frequency of 2.56 kHz. The seven types of PQ data are simulated with SNR 50 dB, 25 dB or no noise. The training data contains 130 samples for each power quality events, which generated with three levels of distur- banc e magnitude: 0.3, 0.6 and 0.8. Then, another 50 samples for each disturbance are generated randomly within the defined range for testing. The total 350 testing samples are classified by three classifier programmed in Matlab, which are classifier basing on rules of Table 1, SVM classifier and PSO-SVM classifier. The results of classification by the three Figure 9 . Operating procedures of SVM. Table 1. Seven rules for classification. 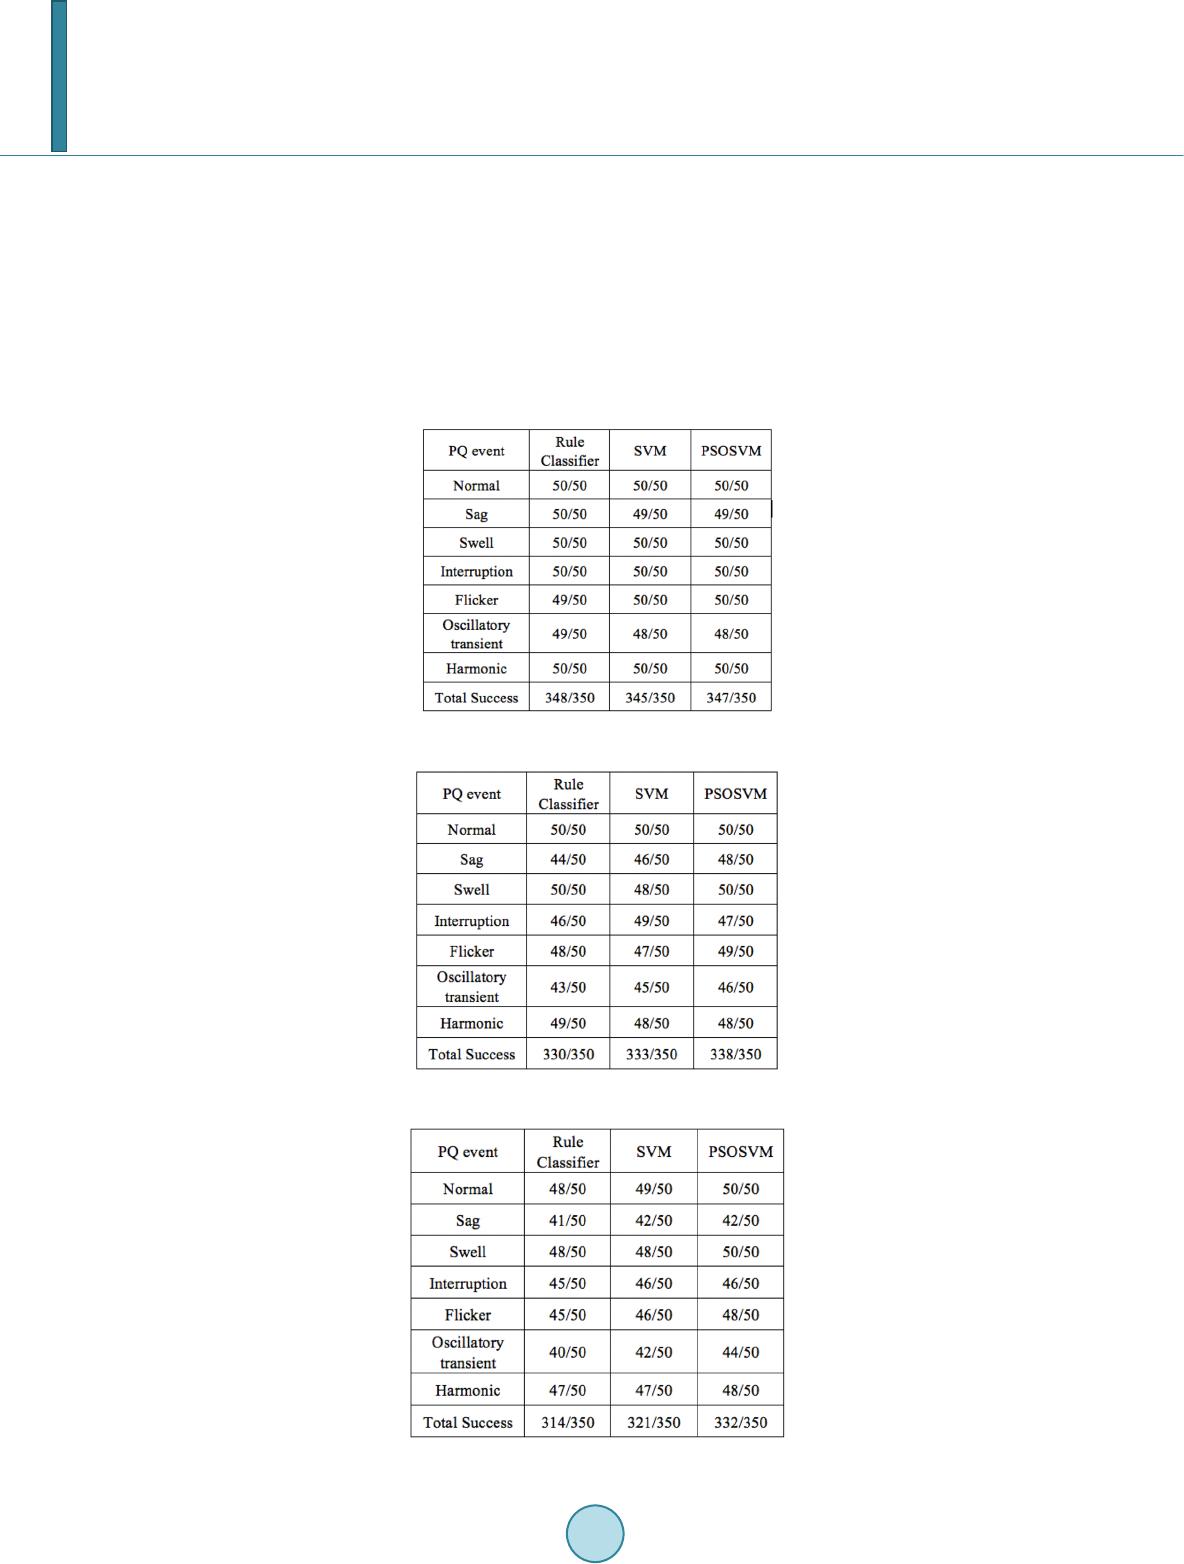 J. Q. Li, M. V. Chilukuri classifiers are displayed below. 7. Conclusion The classification results reveal that three classifiers can have a good identification for different power quality cases, though the accuracy reduces by decreasing SNR. The classifier basing on rules can increase the accuracy by modifying the settings of boundaries between seven PQ events. However, the complexity of real power qual- ity events makes it hardly applicable in practice. From Tables 2-4, PSO-SVM is proved to be a better classifier Table 2. Classification results of PQD without noise. Table 3. Classification results of pqd with 50 db snr. Table 4. Classification results of pqd with 25 db snr.  J. Q. Li, M. V. Chilukuri than SVM, which has the highest accuracy and best robust to noise. Therefore, it is great potential for this clas- sifier with on-line classification capability to enhance the performance of automatic power quality monitoring devices. References [1] Flores, R. (2003) Signal Processing Tools for Power Quality Event Classification. [2] Mallat, S. (1989) A Theory for Multiresolution Signal Decomposition: The Wavelet Representation. [3] Stockwell, R.G., Mansinha, L. and Lowe, R.P. (1996) Localization of the Complex Spect rum: The S-Transform. [4] Vapnik, V. (1998) The Support Vector Method of Function Estimation. [5] Bati sta, J., Afonso, J.L. and Martins, J.S. (2003 ) Lo w-Cost Power Quality Monitor Based on a PC. [6] Chilukuri, M.V., Dash, P.K. and Basu, K.P. (2004) Time -Frequency Based Pattern Recognition Technique for Detec- tion and Classification of Power Quality Disturban ces. [7] Vapnik, V.N. (1995) The Nature of Statistical Learning Theory. Springer-Verlag, New York. http://dx.doi.org/10.1007/978-1-4757-2440-0 [8] Qi, F., B ao, C. and Liu, Y. (2004) A Novel Two-Step SVM Classifier for V oiced /Unvoiced /Silence Classification of Speech .
|