 Journal of Geoscience and Environment Protection, 2014, 2, 89-95 Published Online April 2014 in SciRes. http://www.scirp.org/journal/gep http://dx.doi.org/10.4236/gep.2014.22014 How to cite this paper: Wang, T. H. et al. (2014). A High Matrix Tolerance Cadmium Determination Method: An Analysis Method Combining Microextraction and Laser Ablation Inductively Coupled Plasma Mass Spectrometry. Journal of Geoscience and Environment Protection, 2, 89-95. http://dx.doi.org/10.4236/gep.2014.22014 A High Matrix Tolerance Cadmium Determination Method: An Analysis Method Combining Microextraction and Laser Ablation Inductively Coupled Plasma Mass Spectrometry Tsing Hai Wang, Yi-Jung Sung, Yi-Kong Hsieh, Chu-Fang Wang* Biomedical Engineering and Environment Sciences, National Tsing Hua University, Taiwan Email: *cfwang@mx.nthu.edu.tw Received Dec emb er 2013 Abstract Herein, we proposed a high matrix tolerance analytical method, using a combination of ammo- nium pyrrolidine dithiocarbamate/methyl isobutyl ketone ( AP DC -MIBK) microextraction and la- ser ablation inductively coupled plasma mass spectrometry (LA-ICP-MS), for Cd concentration de- termination in aqueous samples. Only 200 µL of organic solvent was used throughout the entire analysis process, with enhancement factors as high as 25. Recoveries from replicate analyses of natural water [NIST 1640(a)] containing mean concentrations of 3.1 μg Cd L–1 were 95 ± 3. The corresponding Cd detection limit was 0.6 μg L–1. The main advantage of this approach is its sim- plicity in terms of sample preparation, as demonstrated by quantifying the Cd levels in tap water, groundwater, and seawater, using a standard addition method. Keywords Microextraction; LA-ICP-MS; Green Chemistry; APDC; MINEQL 1. Introduction The development of a green analytical route that proceeds with the minimal consumption of chemical reagents but performs with sensitivity as high as possible remains a goal for all analytical chemists. There are two rea- sonable strategies toward reaching such a challenging objective: one is to upgrade the sensitivity of the analyti- cal instruments and the other is to optimize the sample preparation process. The objective when preparing a sample is to concentrate the analytes of interest to a level sufficiently high to exceed the detection limit of the analytical instrument, while removing any potential interferents; cost-effectiveness and operational convenience are also important issues of concern. Accordingly, microextraction has become one of the most popular sample * 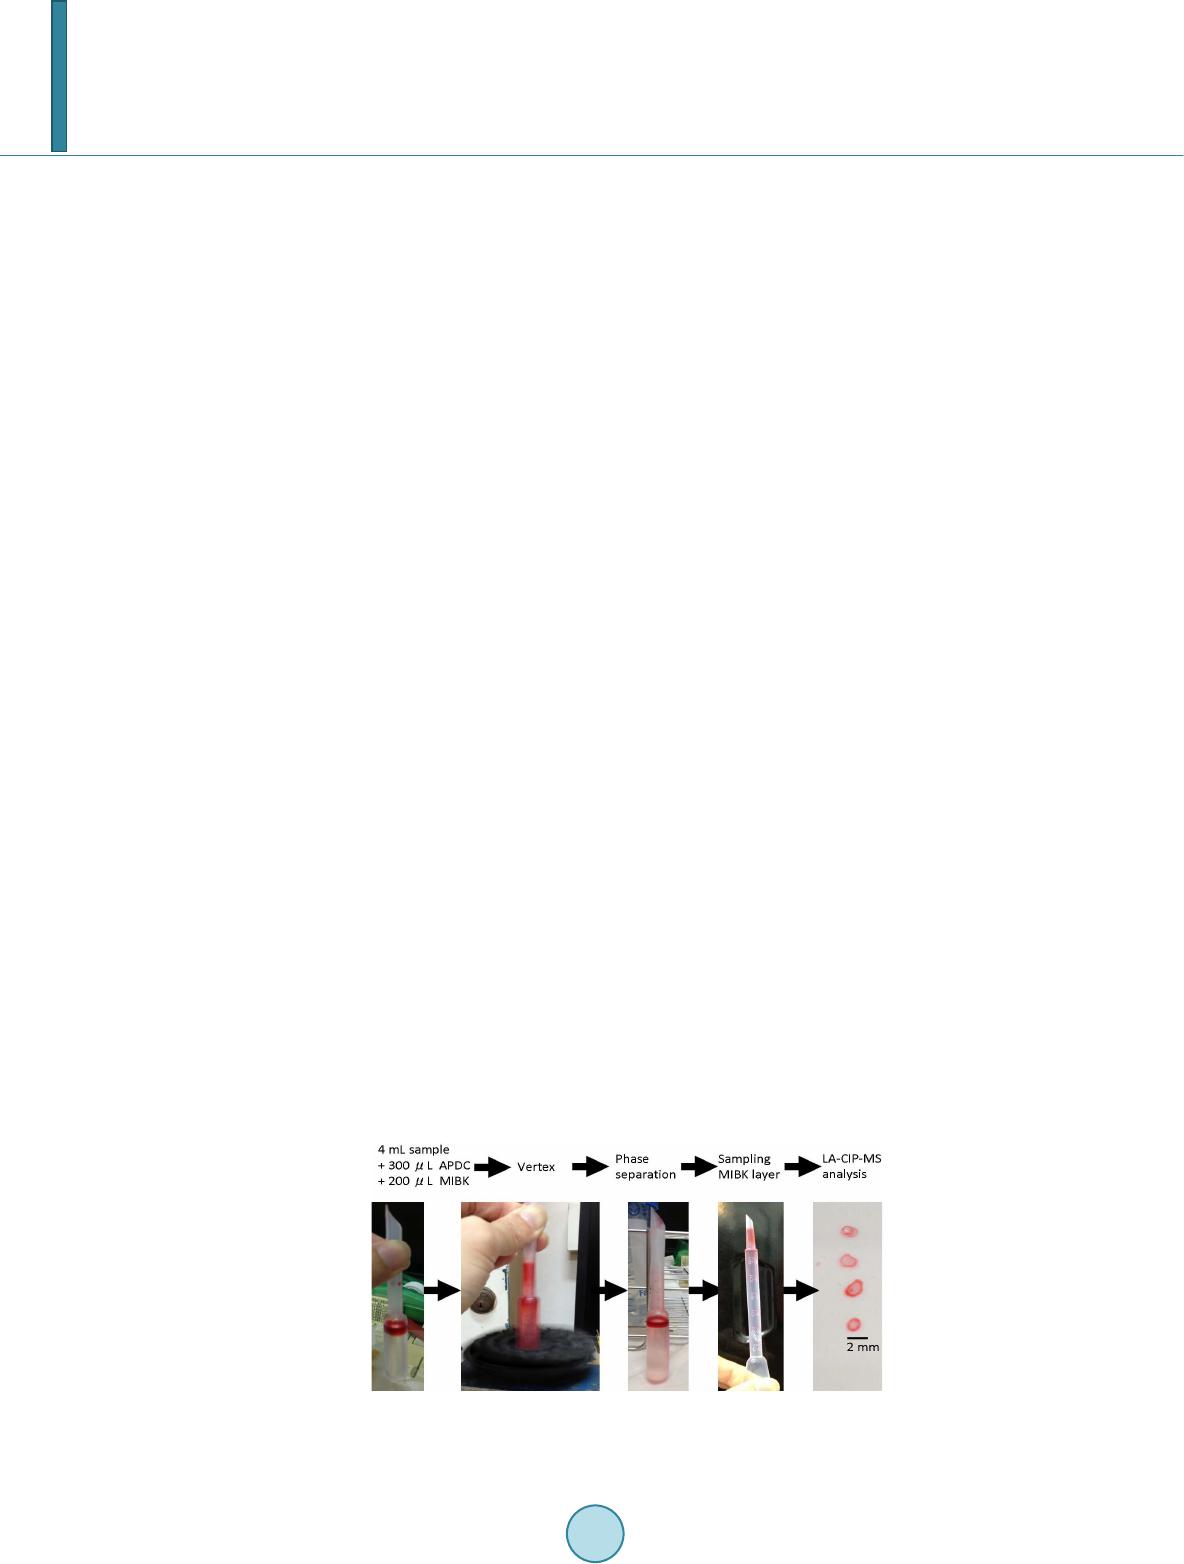 T. H. Wang et al. preparation methods. Microextraction methods can be divided into two major groups: solid phase microextrac- tion (SPME) (Iraji et al., 2012) and liquid phase microextraction (LPME) (Meeravali et al., 2012; Shaha et al., 2011; Be i r a ghi et al., 2012; Te hrani et al.; 2010; Zeng et al., 2012). The chemical mechanism of the former in- volves the partitioning of analytes between liquid and solid phases; in the latter, it is more or less related to chemical equilibrium occurring between aqueous and organic phases. Despite many successful extraction methods having been reported for analyzing a variety of environmental samples, most of these analytical routes require the consumption of considerable amounts of solvents, both to extract the analytes from the samples and to introduce them into the analytical instruments (Be ndic ho et al., 2012; Moradi & Yamini 2012). Although the flame atomic absorption spectrometer (AAS), inductively coupled plasma mass spectrometry (ICP-MS), and inductively coupled plasma (ICP-OES), do not consume any organic solvent during analysis, all of them require certain degree of sample pretreatment to remove the interferences. For example, analytes residing in the high ionic strength are not able to directly introduce into these instru- ments since clogging can occur as a result of dissolved solids depositing at the interfaces of the components. These salts will not only deteriorate the analytical performance but also greatly increase the need for main- tenance. Surface analysis techniques, which are applied widely in material analysis, appear to be promising analytical routes because they require almost no solvent during the entire analysis procedure. At present, the most rela- tively accessible techniques for surface analysis include X-ray photoelectron spectroscopy (XPS) (Batrusaitis et al., 2012), scanning electron microscopy combined with energy disperse spectroscopy (SEM/EDS) (Wang et al., 2010) and X-ray fluorescence spectroscopy (XFS) (Howard et al., 2012; West et al., 2011); although these me- thods are all capable of quantitative analysis of solid samples without the need for organic solvent, their sensi- tivities are rather low—on the order of a few percentage. Secondary ion mass spectrometry (SIMS), on the other hand, has high sensitivity and detection limits that can reach the level of parts per billion (Gannoun et al., 2011; Cerqueira et al., 2011). Unfortunately, SIMS requires high-vacuum environments that greatly restrict its ability to analyze environmental samples—especially aqueous samples. Given these considerations, laser ablation in- ductively coupled plasma mass spectrometry (LA-ICP-MS) appears to be a more suitable choice for the analysis of environmental samples (Wa ng et al., 2012) its ICP-MS component ensures high sensitivity and no organic solvent is required for the laser ablation process. The only challenge that remains for LA-ICP-MS analysis is to optimize specimen preparation. In this paper, we report a green analytical route that combines microextraction within an inexpensive disposa- ble pipette (Hu et al., 2010) using an ammonium pyrrolidine dithiocarbamate/methyl isobutyl ketone (APDC- MIBK) system, with quantitative analysis through LA-ICP-MS (Wa ng et al., 2012). This approach requires only 200 µL of organic solvent to complete the entire analysis process. Figure 1 outlines the concept of this proposed analytical route. We examined its validity through replicate analyses of cadmium (Cd) in NIST 1640(a) refer- ence nature water. We also demonstrated the main advantage of this process—its simplicity with respect to sample preparation—through analyses of Cd in samples of tap water, groundwater, and seawater. 2. Experimental First, confirm all chemicals were of analytical grade and were used directly. To establish calibration curves for Figure 1. Schematic representation of the concept of our proposed green analytical route. 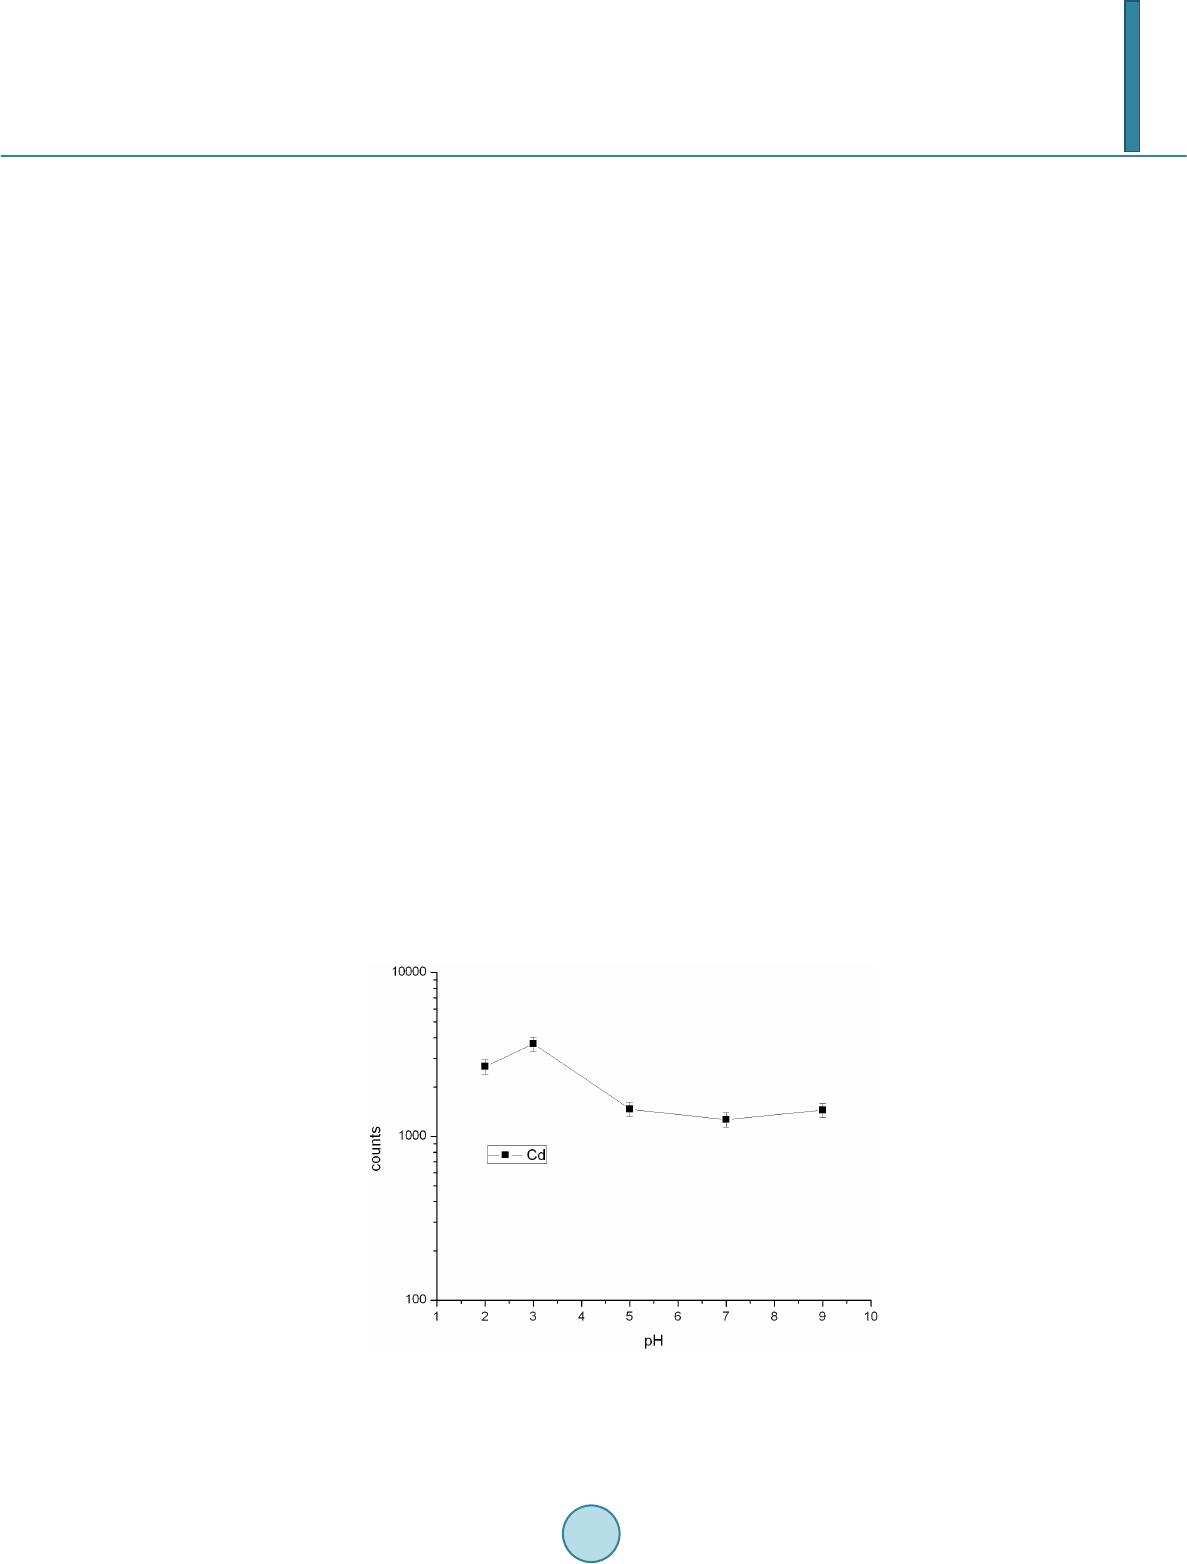 T. H. Wang et al. quantificatio n of Cd and Pb, aliquots of Cd and Pb stock solutions [prepared by dissolving Cd(NO3)2 and Pb(NO3)2 in deionized water, respectively] were diluted directly with MIBK. The as-prepared standards were spiked with Oil Red O (Sigma, CAS Number 1320-06-5) to visualize their locations on the substrate and allow better focusing of the laser shot. These standards were vortexed vigorously to minimize any possible phase se- paration prior to placing droplets onto the substrates. The procedure for the replicate analyses of NIST 1640(a) nature water, as well as other real samples (tap water, lake water, and seawater), is outlined as follows: 1) Mix sample (5 mL) with APDC (300 μL) in a 50-mL polypropylene centrifuge tube, adjust the pH to 3, and then vortex to induce extraction. 2) Transfer 4.5 mL of the mixture into a cut plastic pipette, add dye-spiked MIBK (200 μL), vortex for 30 s to partition chelated APDC into the MIBK phase, and then set aside for phase separation. 3) Place a drop (0.1 μL) of colored MIBK onto the substrate, dry, and then perform LA-ICP-MS analysis. The following operating conditions were applied for the LA-ICP-MS system: LA was performed using a UP 213 laser ablation system (New Wave Research, USA) combined with a Nd:YAG laser (wavelength: 213 nm) and operated in Q-switched (pulsed) mode. The pulse length was 4 ns with a repetition rate of 10 Hz, a dwell time of 8 s, and an intersite pause of 1 s. During ablation, the laser beam (diameter: 0.11 mm; defocused dis- tance: 1.5 mm) with fluence of 15 - 20 J cm–2 was used to vaporize the elements within a selected area. At a scan speed of 0.1 mm s–1 and a frequency of 10 Hz, an area of approximately 10 mm × 10 mm (depending on the ac- tual size of the sample) was ablated and introduced into the ICP-MS system using argon as the carrier gas (1.0 L min–1). Analyses of the elements Cd and Pb were conducted using a quadrupole ICP mass spectrometer (Agilent 7500a, USA); the operating RF power was 1.5 kW, and the detector was operated in time-resolved analysis ac- quisition mode; the plasma gas flow rate and auxiliary gas flow rate were 15 and 2.0 L min–1, respectively. 3. Result and Discussion 3.1. Effect of pH The APDC-MIBK extraction system has been demonstrated previously to exhibit high performance when ex- tracting most transition metal elements from complex matrices, including seawater and industrial influent (Sun & Sun, 2007). When co-precipitating with APDC complexes, 42 elements covering most transition metal ele- ments (including rare earth elements) can be isolated efficiently from highly saline samples; importantly, no IA or IIA elements are extracted from these solutions at the same time (Sun & Sun, 2007) Further pH adjustment to an appropriate working window can effectively isolate some of these 42 elements. Figur e 2 displays, in good agreement with the literature, that pH 3 is the most efficient working window for isolating the Cd ele ment (Sun Figure 2. Intensities of signals for Cd in LA-ICP-MS analyses of samples extracted from environments at various values of pH. The ex- tractions were conducted using our proposed system and samples with initial Cd concentrations of 5 ppm. 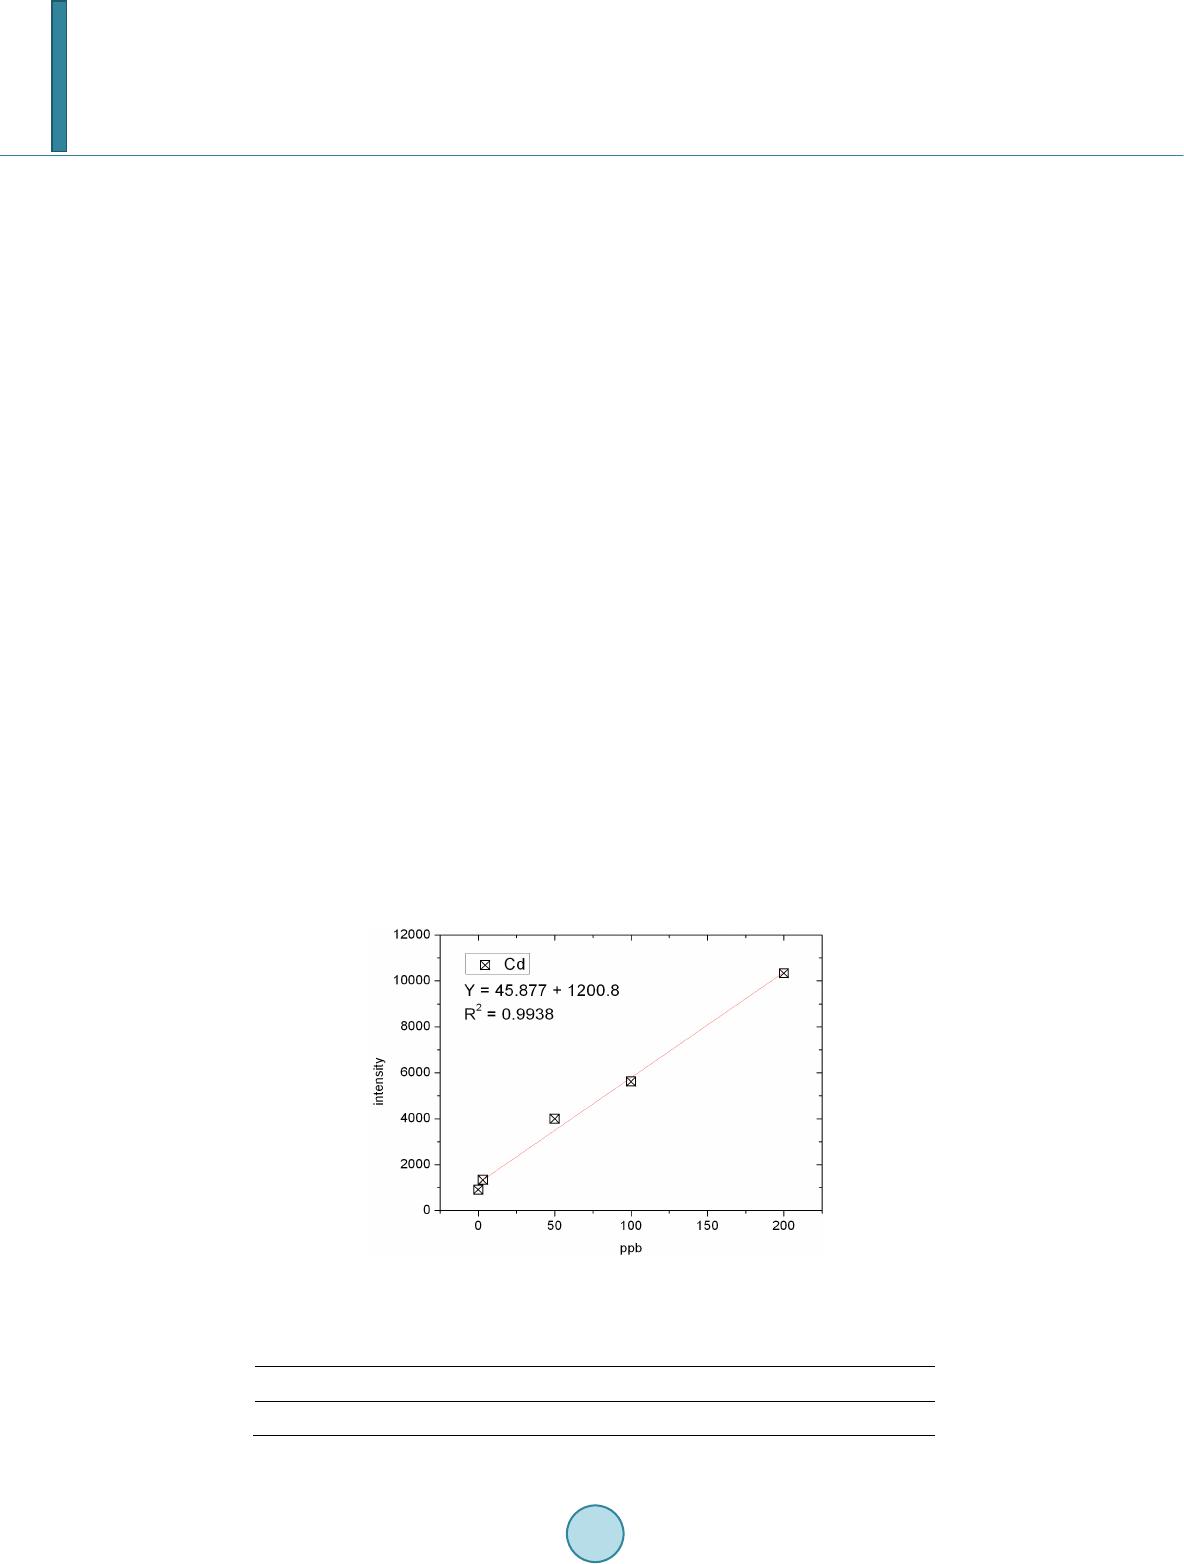 T. H. Wang et al. & Sun, 2007). Accordingly, we adjusted our samples to pH 3 in all subsequent analyses. It should be kept in mind that a further optimization can be reached by considering the adjustment in the microextraction time, salt- ing out, complexing agent concentration, buffer concentration, organic solvent volume, sample volume, etc. 3.2. Capability of Proposed Microextraction Route Having determined the working pH window, we required corresponding calibration curves as a prerequisite to performing further analyses. Fig ure 3 displays the corresponding Cd calibration curve determined using LA- ICP-MS. The value of R2 (>0.99) indicates good linear responses toward Cd and Pb in the region up to 200 ppb (ca. 1.78 μM for Cd). This performance suggested that the technique would be applicable for the analyses of en- vironmental samples. We first tested the validity of our proposed microextraction procedure through analyses of NIST 1640(a), a standard reference natural water. Replicate analyses of NIST 1640(a) provided recoveries of 95 ± 3% for Cd (Table 1). The corresponding detection limits, derived from three standard deviations of blank analyses, of our system were 0.6 μg L–1 for Cd. Despite having observed excellent detection limits and good recoveries from replicate analyses of NIST 1640(a) nature water, the concern to analytical chemists is often the matrix effect, rather than the detection limit. That is, the superior sensitivity of ICP-MS makes it possible to determine the levels of most of the elements of any kind in an environmental sample, although the matrix of a real sample usually leads to isobaric interference as well as polyatomic interference. Minimizing these interferences is an important aspect of improving the pre- cision of an analysis. Furthermore, clogging can occur as a result of dissolved solids depositing at the interfaces of the components—not only deteriorating the analytical performance but also greatly increase the need for maintenance. Dilution is a quite simple and straightforward approach that has been applied widely to minimize matrix effects; unfortunately, the analytes themselves will be simultaneously diluted and, in this case, worsen the detection limit of the ICP-MS system. All of these concerns inhibit the direct introduction of real samples and highlight the inevitability of sample preparation when dealing with them. The greatest advantage that our proposed analytical method has over others is its simplicity in terms of sample preparation. Herein, we demonstrate this feature through the quantification of Cd in tap water, groundwater, and seawater (Figure 4). Considering that the concentrations of these trace samples are typically close to the detec- tion limit of ICP-MS (Ye et al., 2012; Boda & Sheikh 2012; E bert & Bhushan, 2012; Xu & He 2012; H sie h et al., 2011; Wang et al., 2009), we applied a standard addition method to perform replicate quantification. The details of the inorganic compositions of these real samples can be found elsewhere (Ye et al., 2012; Figure 3. Calibration curves for Cd determined using LA- ICP-MS (n = 3). Table 1. Concentrations of Cd determined through analyses of NIST 1640(a) (n = 3). Element Certified (ppb) Detected (ppb) Recovery (%) RSD (%) Cd 3.961 ± 0.072 3.8 ± 0.3 96 ± 7 7.89 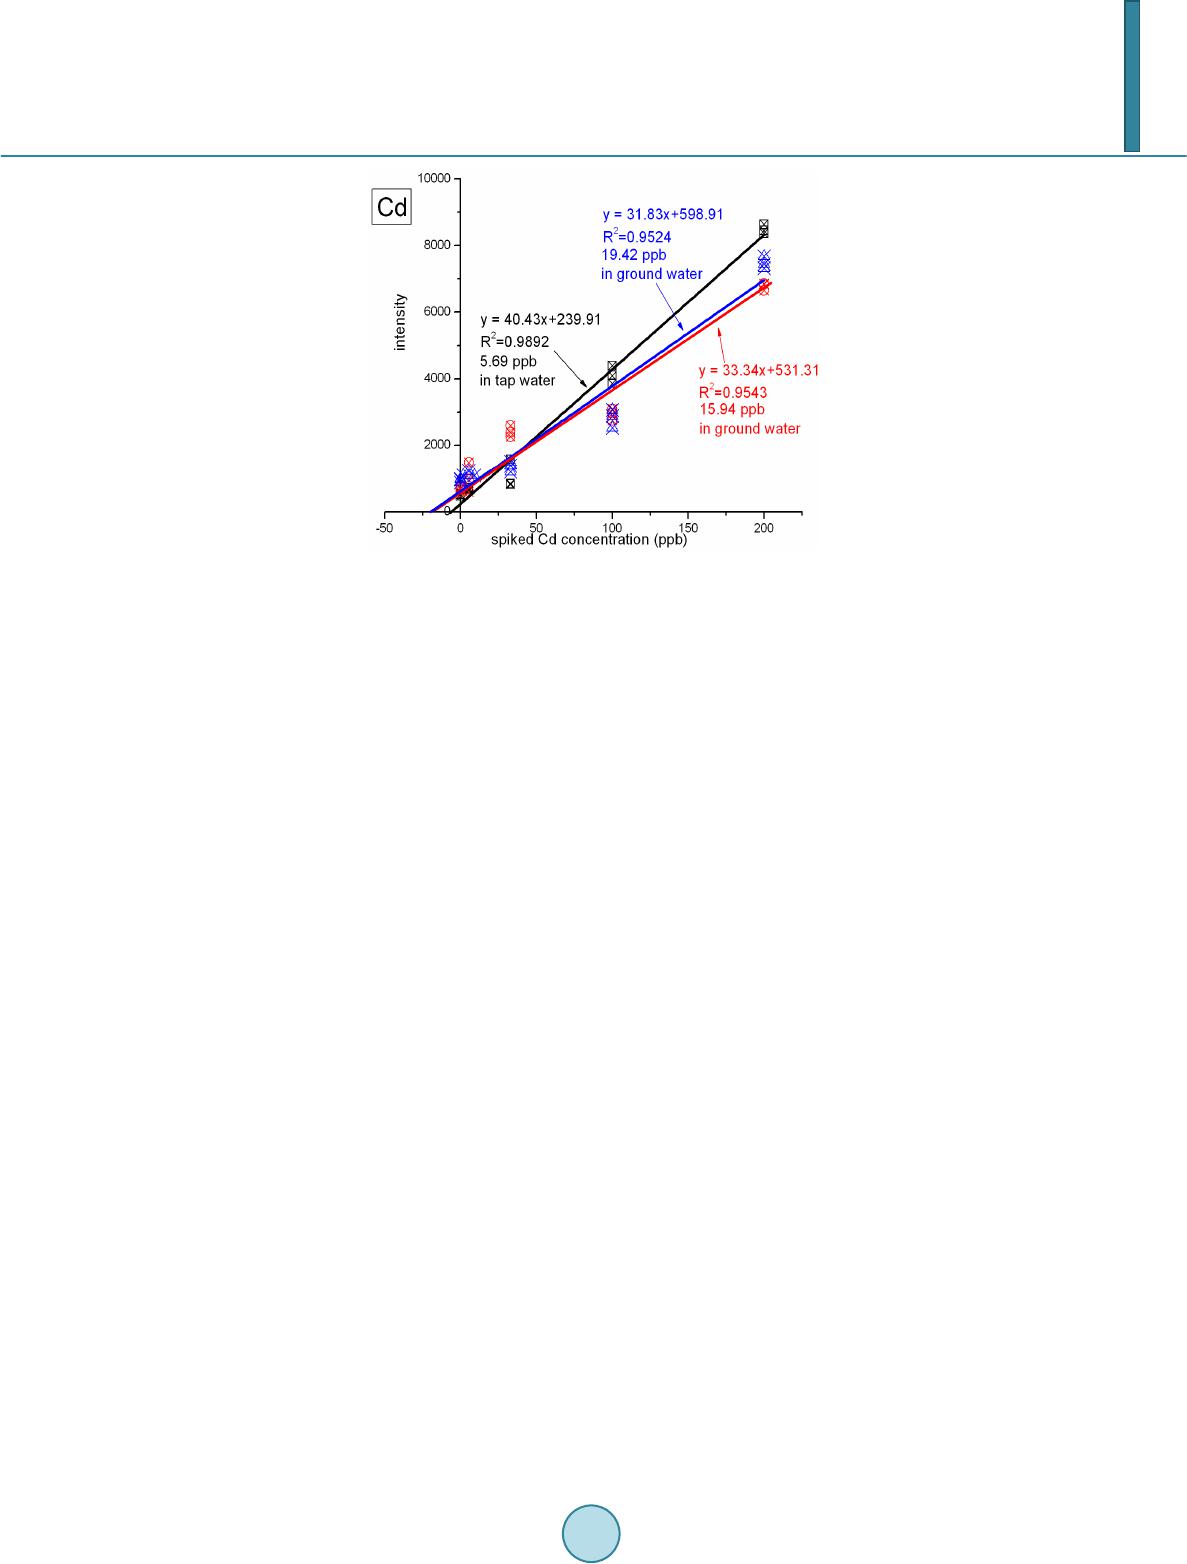 T. H. Wang et al. Figure 4. Analyses of real samples (n = 3): tap water (black line), groundwater (blue line), and seawater (red line); calcu- lated total dissolved solids: tap water, ca. 50 mg L–1; (Heish et al., 2011) groundwater, ca. 1 wt%; (Wang et al., 2009) seawa- ter, ca. 3.5 wt% (Wang et al., 2010). Boda & Sheikh 2012; Ebert & Bhushan, 2012; Xu & He 2012; Hsi eh et al., 2011; Wa ng et al., 2009), their ionic strengths range from the sub-millimolar to the tens of millimolar level (i.e., the ionic strength is proportional to the total dissolved solid content). From Figure 4, we note that the values of R2 obtained from the tap water sam- ple were higher than those determined from the groundwater and seawater samples. Similar to that of NIST 1640(a) nature water, the ionic strength of the tap water sample was rather low in comparison with those of the other two samples, and we suspect that this feature might have led to the better values of R2. On the other hand, good linear responses remained in the cases of the groundwater and seawater samples. The slightly lower values of R2 might reflect interference from the matrix in these two real samples. Nevertheless, the high extraction effi- ciency of the APDC-MIBK system meant that our proposed analytical method was still capable of quantifying trace amounts of Cd in groundwater and seawater samples. Through linear regression, we determined the con- centrations of Cd to be 5.69 ppb in tap water; 15.94 ppb in groundwater; and 19.42 in seawater. Importantly, the simplicity, low cost, and low consumption of organic solvent make this approach a very promising green ana- lytical method for future application to a wide variety of environmental samples. 4. Conclusion In this study, we have developed a technique for green analysis through the combination of an APDC-MIBK microextraction system (in an inexpensive disposable pipette) and LA-ICP-MS. We examined the performance of this system through replicate analyses of the concentrations of Cd and Pb in NIST 1640(a) nature water. The entire experiment required only 200 µL of organic solvent and provided an enhancement factor of 25—a value that might improve further through judicious choice of a more-appropriate substrate. Using this system, the de- tection limits, determined based on three times the standard deviations, were 0.6 μg L–1 for Cd and 0.9 μg L–1 for Pb. Such sensitivities suggest that this approach would be applicable to the analyses of most environmental samples with good accuracy. Acknowledgem ents We thank the National Science Council of the Republic of China (NSC100-2221-E-008-039-MY3) for support- ing this study. We appreciate Peter Glink for the detail English correction. References Batrusaitis, J. Chen, H. H., Rubasinghege, G., & Grassian, V. H. (2012). Heterogeneous Atmospheric Chemistry of Lead  T. H. Wang et al. Oxide Particles with Nitrogen Dioxide Increases Lead Solubility: Environmental and Health Implications. Environmental Science & Technology, 46, 128 06-12813. http://dx.doi.org/10.1021/es3019572 Beiraghi, A. Babaee, S., & Roshdi, M. (2012). Simultaneous Preconcentration of Cadmium, Cobalt and Nickel in Water Samples by Cationic Micellar Precipitation and Their Determination by Inductively Coupled Plasma-Optical Emission Spectr ometry. Microchemical Journal, 100, 66-71. http://dx.doi.org/10.1016/j.microc.2011.09.003 Bendicho, C., Lavilla, I., Pena-Pereira, F., & Romero, V. (2012). Green Chemistry in Analytical Atomic Spectrometry: A Revie w. Journal of Analytical Atomic Spectrometry, 27, 1831-1857. http://dx.doi.org/10.1039/c2ja30214d Boda, A., & Sheikh, M. A. (2012). Density Functional Theoretical Investigation of Remarkably High Selectivity of the Cs+ Ion over the Na+ Ion toward Macrocyclic Hybrid Calix-Bis-Crown Ether. The Journal of Physical Chemistry A, 116, 8615-8623. http://dx.doi.org/10.1021/jp303817s Cerqueira, B., Vega, F. A., Serra, C., Silva, L. F. O., & Andrade, M. L. (2011). Time of Flight Secondary Ion Mass Spec- trometry and High-Resolution Transmission Electron Microscopy/Energy Dispersive Spectroscopy: A Preliminary Study of the Distribution of Cu2+ and Cu2+/P b 2+ on a Bt Horizon Surfaces. Journal of Hazardous Materials, 195, 422-431. http://dx.doi.org/10.1016/j.jhazmat.2011.08.059 Ebert D., & Bhushan, B. (2012). Durable Lotus-Effect Surfaces with Hierarchical Structure Using Micro- and Nanosized Hydrophobic Silica Particles. Journal of Colloid and Interface Science, 368, 584-591. http://dx.doi.org/10.1016/j.jcis.2011.09.049 Gannoun, A., Boyet, M., El Goresy, A., & Devouard, B. (2011). REE and Actinide Microdistribution in Sahara 97072 and ALHA77295 EH3 Chondrites: A Combined Cosmochemical and Petrologic Investigation. Geochimica et Cosmochimica Acta, 75, 32 69-3289. http://dx.doi.org/10.1016/j.gca.2011.03.017 Howard, D. L. , de Jonge, M. D., Lau, D., Hay, D., Varcoe-Cocks, M., Ryan, C. G., Kirkham, R., Moorhead, G., Paterson, D., & Thurrowgood, D. (2012). High-Definition X-Ray Fluorescence Elemental Mapping of Paintings. Analytical Chemistry, 84, 3278-3286. http://dx.doi.org/10.1021/ac203462h Hsieh, H. F., Chen, Y. H., & Wang, C. F. (2011). A Magnesium Hydroxide Preconcent ration/Matrix Reduction Method for the Analysis of Rare Earth Elements in Water Samples Using Laser Ablation Inductively Coupled Plasma Mass Spectro- metry. Talanta, 85, 983-990. http://dx.doi.org/10.1016/j.talanta.2011.05.011 Hu, X. Z., Wu, J. H., & Feng, Y. Q. (2010). Molecular Complex-Based Dispersive Liquid-Liquid Microextraction: Analysis of Polar Compounds in Aqueous Solution. Journal of Chromatography A, 1217, 7010-7016 . http://dx.doi.org/10.1016/j.chroma.2010.09.013 Iraji, A., Afzali, D., Mostafavi, A., & Fayazi, M. (2012). Ultras ound -Assisted Emulsification Microextraction for Separation of Trace Amounts of Antimony Prior to FAAS Determination. Microchimica Acta, 176, 185-192. http://dx.doi.org/10.1007/s00604-011-0706-0 Meeravali, N. N., & Kumar, S. J. (2012). Determination of Cd, Pb, Cu, Ni and Mn in Effluents and Natural Waters by a Novel Salt Induced Mixed-Micelle Cloud Point Extraction Using ETAAS . Analytical Methods, 4, 2435-2440. http://dx.doi.org/10.1039/c2ay25216c Moradi, M., & Yamini, Y. (2012). Surfactant Roles in Modern Sample Preparation Techniques: A Revie w. Journal of Sepa- ration Science, 35, 2319-2340. http://dx.doi.org/10.1002/jssc.201200368 Shaha, F., Kazia, T. G., Afridi, H. I., Naeemullah, A. M. B., & Baig, J. A. (2011). Cloud Point Extraction for Determination of Lead in Blood Samples of Children, Using Different Ligands Prior to Analysis by Flame Atomic Absorption Spectro- metry: A Multivariate Study. Journal of Hazardous Materials, 192, 1132-1139. http://dx.doi.org/10.1016/j.jhazmat.2011.06.017 Sun, Y. L., & Sun, M. (2007). Determination of 42 Trace Elements in Seawater by Inductively Coupled Plasma Mass Spec- trometry after APDC Chelate Co-Precipitation Combined with Iron. Analytical Letters, 40, 2391-2404. http://dx.doi.org/10.1080/00032710701576056 Tehrani, M. S., Azar, P. A., Husain, S. W., & Shafaei, F. (2010). Dispersive Liquid-Liquid Microextraction of Cr(VI) in Water and Hair Samples by Electrothermal Atomic Absorption Spectrometry. Asian Journal of Chemistry, 22, 6302-6310 . Teresa Pena, M., V ecino -Bello, X., Carmen Casais, M. C., Carmen Mejuto, M., & Cela, R. (2012). Optimization of a Dis- persive Liquid-Liquid Microextraction Method for the Analysis of Benzotriazoles and Benzothiazoles in Water Samples. Analytical and Bioanalytical Chemistry, 402, 1679-1695. http://dx.doi.org/10.1007/s00216-011-55 98-7 Wang, T. H., Hsieh, H. A. , Hsieh, Y. K., Chiang, C. S., Sun, Y. C., & Wang, C. F. (2012). The Fate and in Vivo Bio d is t rib u- tion of CdSe Quantum Dots in Rat Tissues: A Laser Ablation Inductively Coupled Plasma Mass Spectrometry Study. Analytical and Bioanalytical Chemistry, 404, 3025-3036. http://dx.doi.org/10.1007/s00216-012-64 17 -5 Wang, T. H., Li, M. H., & Teng, S. P. (2009). Bridging the Gap between Batch and Column Experiments: A Case Study of Cs Adsorption on Granite under High Solid/Liquid Ratio. Journal of Hazardous Materials, 161, 409-415.  T. H. Wang et al. http://dx.doi.org/10.1016/j.jhazmat.2008.03.112 Wang, T. H., Li, M. H., Wei, Y. Y., & Teng, S. P. (2010). Desorption of Cesium from Granite under Various Aqueous Con- ditions. Applied Radiation and Isotopes, 68, 2140-2146. http://dx.doi.org/10.1016/j.apradiso.2010.07.005 West, M., Ellis, A. T., Potts, P. J., Streli, C., Vanhoof, C., Wegrzynek, D., & Wobrauschek, P. (2011). Atomic Spectrometry Update: X-Ray Fluorescence Spectrometry. Journal of Analytical Atomic Spectrometry, 26, 1919-196 3. http://dx.doi.org/10.1039/c1ja90038b Xu, L. G. , & He, J. H. (2012). Fabrication of Highly Transparent Superhydrophobic Coatings from Hollow Silica Nanopar- ticles. Langmuir, 28, 7512-7518. http://dx.doi.org/10.1021/la301420p Ye, G., Bai, F. F., Wei, J. C., Wang, J. C., & Chen, J. (2012). Novel Polysiloxane Resin Functionalized with Dicyclohex- ano-18 -Crown-6 (DCH18C6): Synthesis, Cha r acterization and Extraction of Sr(II) in High Acidity HNO3 Medium. Jou r- nal of Hazardous Materials, 225, 8-14. http://dx.doi.org/10.1016/j.jhazmat.2012.04.020 Zeng, C. J., Lin, Y., Zhou, N., Zheng, J. T. , & Zhang, W. (2012). Room Temperature Ionic Liquids Enhanced the Speciation of Cr(VI) and Cr(III) by Hollow Fiber Liquid Phase Microextraction Combined with Flame Atomic Absorption Spectro- metry. Journal of Hazardous Materials, 237, 365 -370. http://dx.doi.org/10.1016/j.jhazmat.2012.08.061
|