 Journal of Power and Energy Engineering, 2014, 2, 220-226 Published Online April 2014 in SciRes. http://www.scirp.org/journal/jpee http://dx.doi.org/10.4236/jpee.2014.24031 How to cite this paper: Closepet, A.S. (2014) Simple Real Time Non-Co-Operative Game Theoritic Model for Energy Cost Optimization in Developing Countries. Journal of Power and Energy Engineering, 2, 220-226. http://dx.doi.org/10.4236/jpee.2014.24031 Simple Real Time Non-Co-Operative Game Theoritic Model for Energy Cost Optimization in Developing Countries Amit S. Closepet Spectrum Consultants, Bangalore, India Email: amitsclosepet@g mail.com Received December 2013 Abstract This paper describes the significant cost saving opportunities for consumers in developing coun- tries by the use of a simple non-co-operative game theoretic mathematical model for demand- side-management techniques to mitigat e the massive use of diesel back -up during grid outages and also other cost optimization schemes. Application of real time load scheduling optimization is investigated during power outages, for residential consumer in India. This method involves a beautiful formulation of a non–co-operation behavior between the diesel generator & the residen- tial consumer during power outages. This involves a tree model with a two player game, where in player one is the diesel generator & player two is the consumer. Depending on the duration of the outage & the consumers limit on the cost for energy different cost optimization strategies can be generated. The load types modeled include passive loads and schedulable, i.e. typically heavy loads. It is found that this DSM schemes show excellent benefits to the consumer. The maximum diesel savings for the consumer due to strategy formulation can be approximately ranging from 45% to as high as 75% for a flat-tariff grid. The study also showed that the actual savings potential de- pends on the timing of power outage, duration and the specific load characteristics. Keywords Game Theory; Demand Side Management; Cost Optimization; Diesel Mitigation 1. Introduction Demand-side-management (DSM) policies are being formulated by various stakeholders in India and other de- veloping countries [1-3]. These policies are specifically targeted to overcome large energy demand-supply gaps, to provide inclusive and reliable power for entire populations. For example, in India, load scheduling has re- cently been implemented successfully for the agricultural sector. As in developed countries, load scheduling is driven by the utility for peak clipping of demand, load shifting for energy conservation and/or supporting load growth. In this work, our aim is to highlight the urgent need for demand-side-management policies to address one of the major unaddressed challenges for a consumer in a developing country which is the problem of fre- 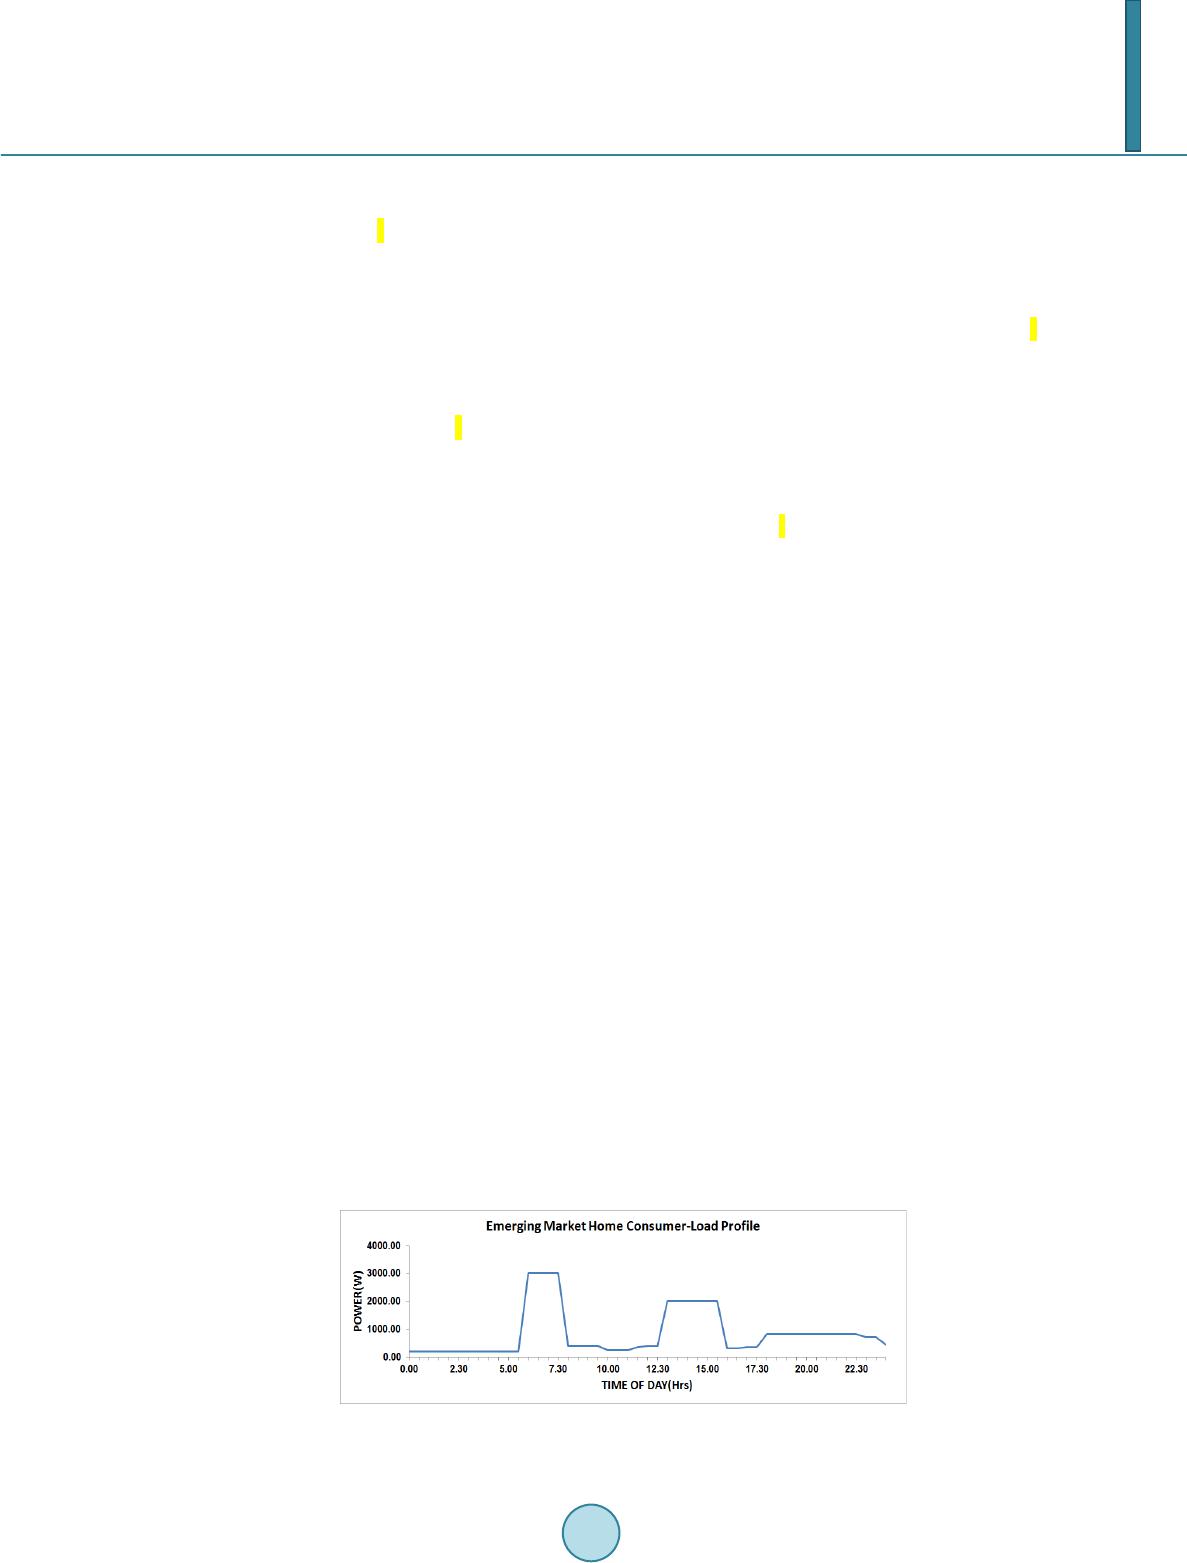 A. S. Closepet quent power outages. DSM solutions and policies need to be developed, validated and framed to enable the consumer get reliable power and reduce his dependence on expensive diesel back-up systems. Tables 1(a) and (b) in [4,5] provide power outage data for several major cities in India and in other develop- ing economies such as Africa, Philippines, South America and observe that power outages range from 2 hours to more than 10 hours a day. Power blackouts typically result in total loss of power to large parts of the entire city to large districts. Different scenarios and causes for planned/unplanned power outages in India are described in [4,5]. Due to this grid unreliability, the market for genset and UPS systems is India is worth several billion dollars and growing at a rapid 20% annual rate. In India, residential consumers sometimes pay large premium (~3X) over grid power due to use of expensive back-up systems [4,5]. Service businesses (e.g. photocopier centers, medical diagnostic labs, service apartments, wedding halls etc.) charge higher rates to the consumer during power outages. Home owners association (HOA) in apartment complexes are faced with large diesel bills due to a shared gen-set and these ad- ditional costs are periodically collected from the consumer. In hospitals, the continuous power is ensured by us- ing UPS systems. According to the Bureau of Energy Efficiency in India [6], to deliver a sustained economic growth rate of 8% to 9% through 2031-32 and to meet life time energy needs of all citizens, India needs to in- crease its primary energy supply by 3 to 4 times and electricity generation capacity about 6 times. Based on these aforementioned statistics and the present high inefficiencies in the grid, it is likely that power outages are here to stay unless DSM policies are directly targeted at mitigating the large power outages for all consumers. 2. Game Formulation & Methodology This paper explains how a non-co-operative game theory based demand side management between 2 players during an outage, the player A is the diesel generator & the player B is the residential consumer has been for- mulated. Typically as shown in the Figure 1 the home load curves have 2 peaks one in the morning & the other in the late afternoon [7,8]. Hence as shown in Figure 2 we can categories the Indian home loads into 2 segments the passive loads & the other is the interruptible loads. The below Table 1 shows that at each hour how are the loads distributed & what is the power consumption of each device. Assumptions are as follows grid cost per unit of energy is 5Rs & back-up cost per unit of energy is 20Rs. During a power-cut the loads are supplied by the diesel generator which is 4 time the grid cost, now in the ex- isting system there is no kind of demand side management prevailing to reduce the back-up cost [9-15]. A unique game theory based demand side management has been developed to reduce the back-up cost & also to have a control on the individual loads & their constraints. Below is a small worked example of this model [16]. General Terminologies '' LetNdenote the setofusers '' LetHdenote setofhoursin aday '' h n Letldenote totalloadofusernathourh Figure 1. Typical emerging market home load curve. 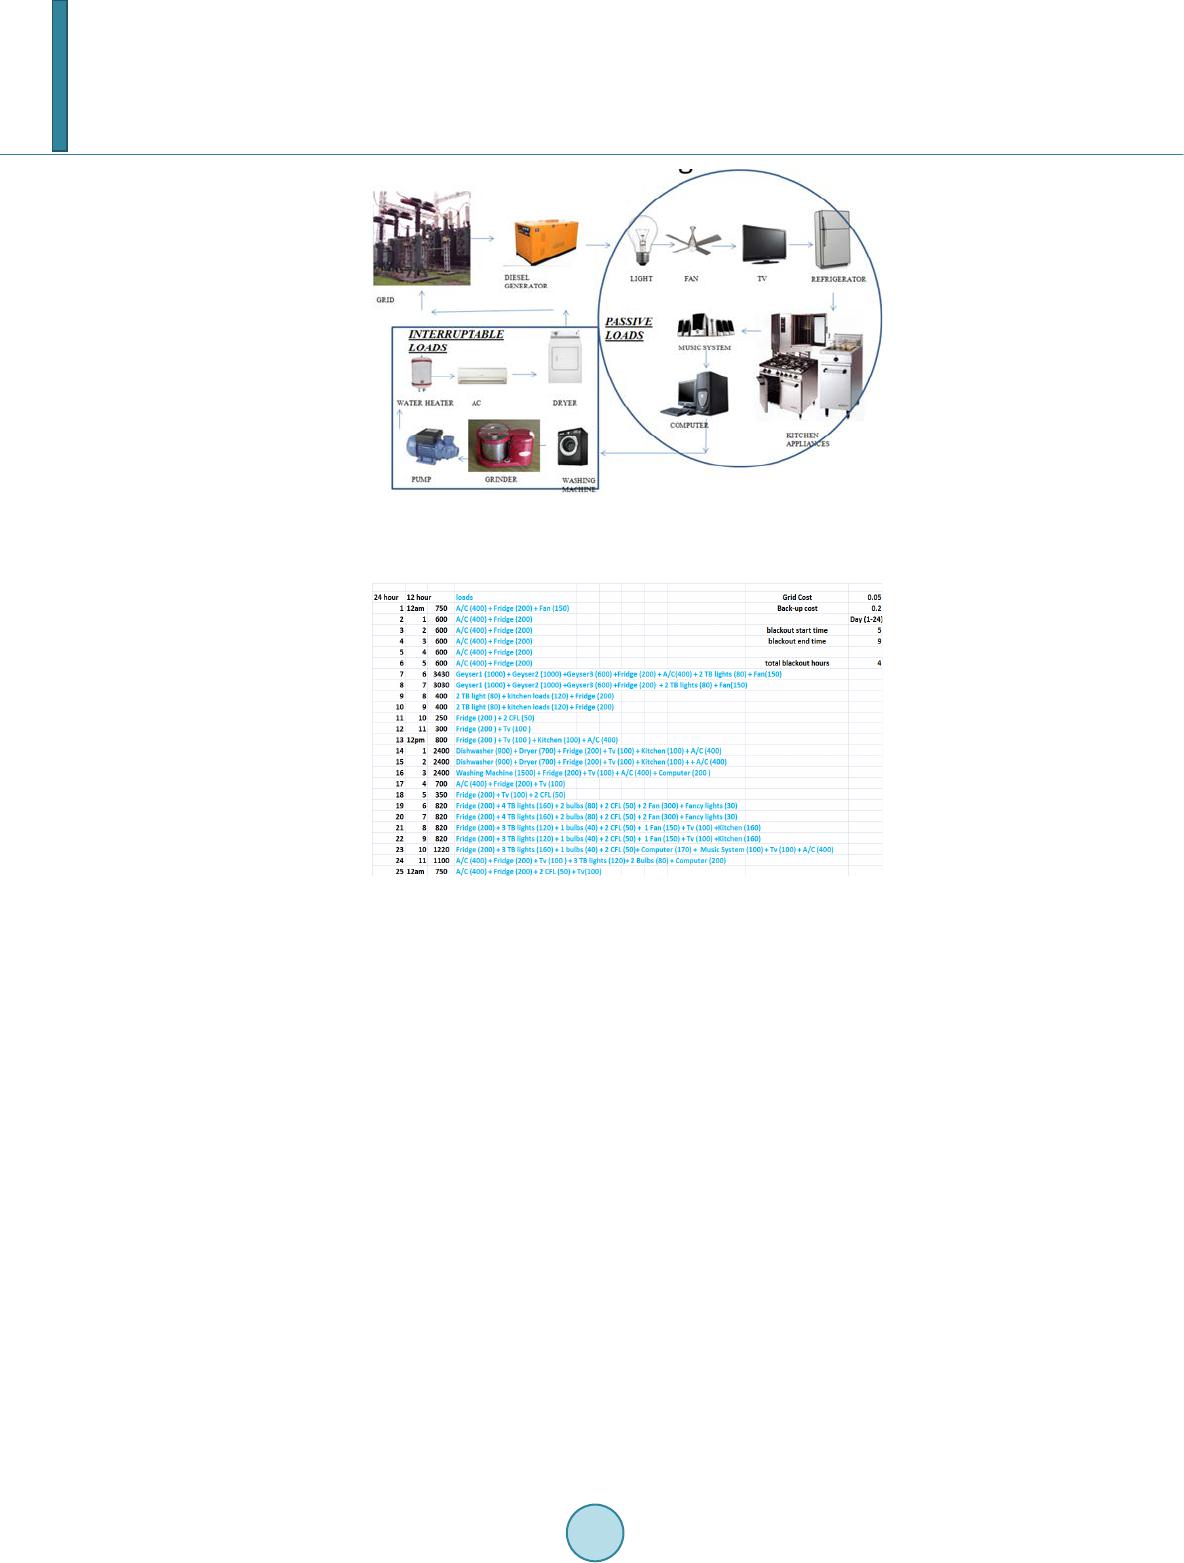 A. S. Closepet Figure 2. Typical Indian home loads. Table 1. Load curve distribution with the wattages. , gh Uunit grid cost for that hour , - bh Uunitblack upcost forthathour , gh Ccost ofelectricity for thathoursupplidbythegrid ( ) h Cdenotes the costofelectricity forthathourpaidby the consumer , bh Ccost ofelectricityfor thathoursupplied bybackup nn Asetof householdappliancesof usernaA∈ , na His a set ofoperatinghours ofappliancea , h na xenergyconsumption ofappliance a athourh byuser n , na earlieststarttimeof applianceaof usern α ∈ , l na lateststarttime ofappliance a ofusern α , e na earliestendtime ofappliance aofusern β , l na latestendtime ofappliance a ofusern β , na Etotalenergyconsumptionof applianceaof usern 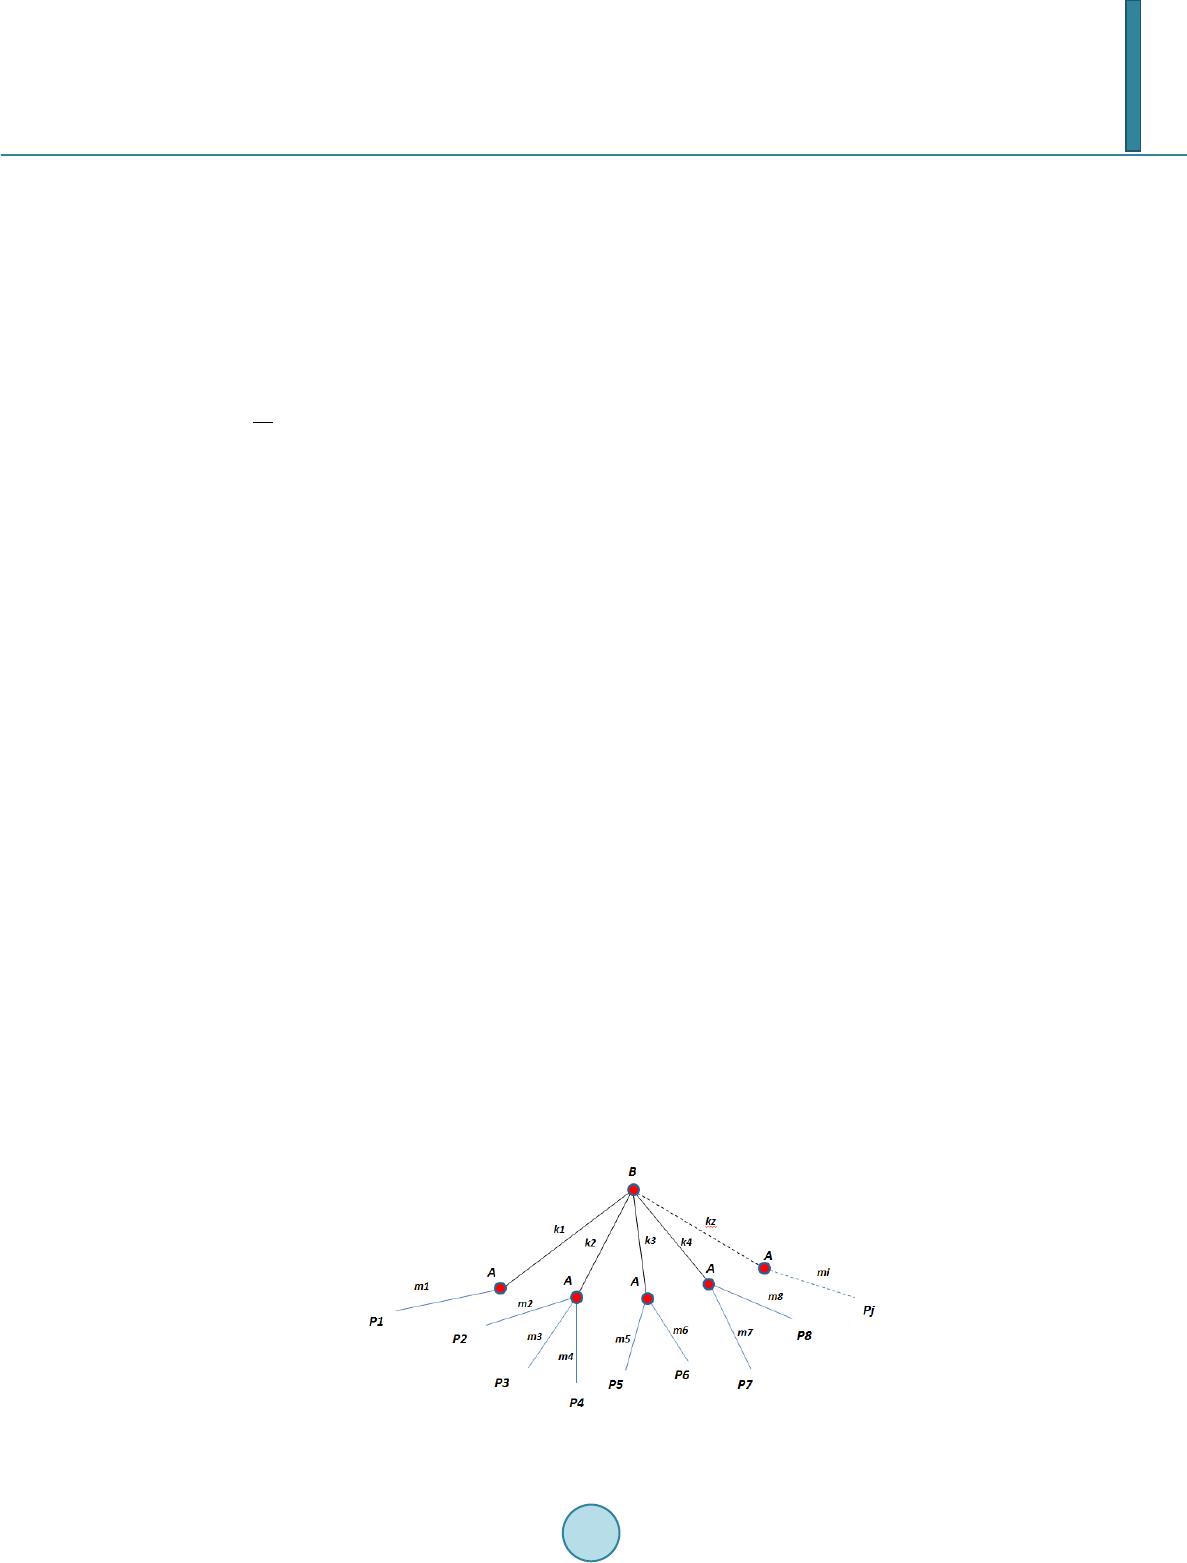 A. S. Closepet Input values to be given by the user , ,, ,, ,, ,,,,, h na hghb hg hbhbsbe CCCUUt tx The above set of values must be given by the user before running the algorithm. General equations ,, ,, ,, el na na el na na h or na na h or xE ββ α =∝ = ∑ General constraints ,,,, ele l na nanana αββ ∝< << Optimization equation In this non-co-operative game theory the home consumer is the player ‘A’ and diesel generator acts as player ‘B’ see Figure 3. When there is normal grid supply for an hour & when there is a blackout for an hour thus when there is a blackout for a certain portion of an hour then , for simplicity we have assumed that the player B has 4 moves to play. B-player ‘B’(DIESEL GENERATOR) A-player ‘A’(USER) K-be the number of strategies of player ‘B’ ‘kz’-strategies of player ‘B’ M-be the number of strategies of player ‘A’ ‘mi’-strategies of player ‘A’ ‘Pj’-payoff of player ‘A’ ‘z’-set of positive integers { 1, 2, 3,…..,M} Governing equations Figure 3. Tree model of the non-co-operative game theory. 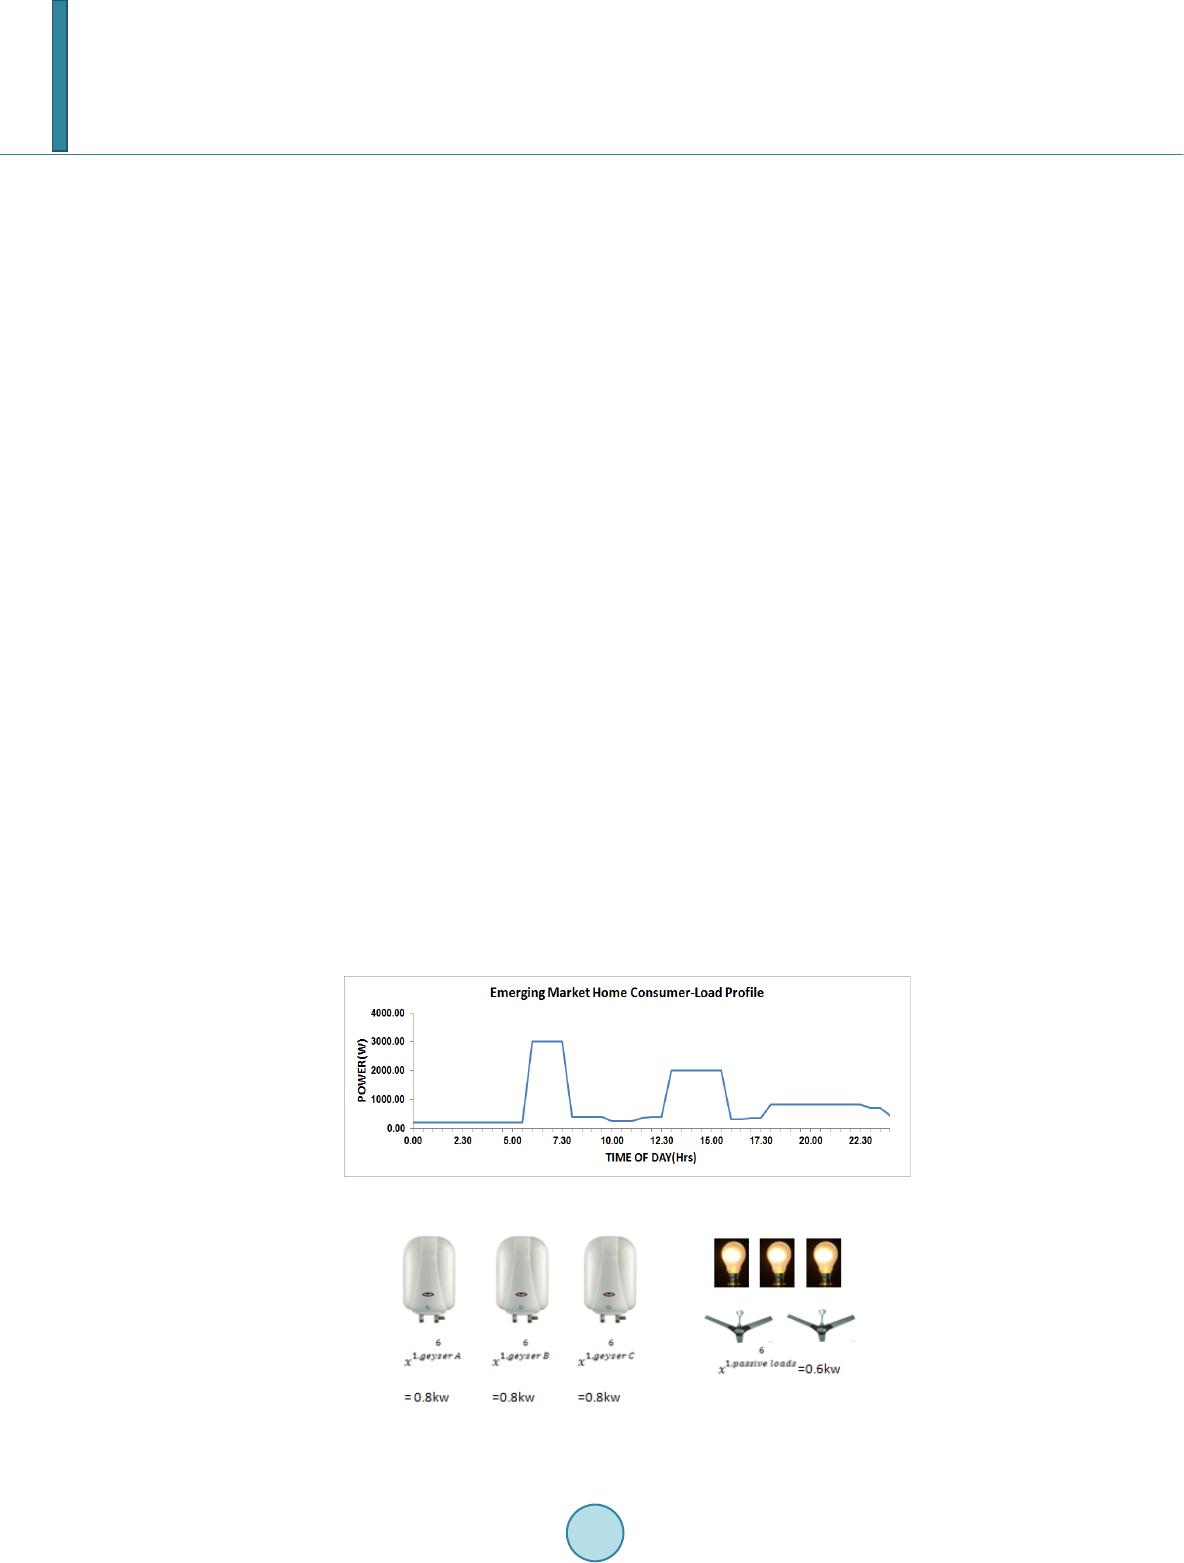 A. S. Closepet Where 1, , (1) / h gh nbh kCl U= ∗∗ 2, , (2) / h gh nbh kCl U= ∗∗ ... ,1 ,2,3, hhh hh n nnnna lx xxx= ++ ++ For example strategies of player A are ,1 ,2,3, hh hh n nnna mi xxxx= ++ ++ Now consider during the power-cut region shown above in Figure 4, the loads that are operative in that hour are the ones shown above in Figure 5 with reference to Table 1. With reference to Figure 4 blackout happens from h = 6 to h = 7 from the load profile we learn that the load during that hour of power-cut is 3 Kw [17-19]. 6666 1, 1, 1, 1, 3 geyser Ageyser Bgeyser Cpassiveloads kw xxxx=+++ Strategies of player ‘A’, this means that the player ‘A’ has the option to turn on the combination of these loads as shown below. Strategies of player ‘A’ 6 1, 1 0.6 passive loads m xkw= = 66 1, 1, 2 1.4 geyser Apassive loads m xxkw=+= 66 1, 1, 3 1.6 geyser AgeyserB m xxkw=+= Figure 4. Load curve with blackout shown in the morning region. Figure 5. Loads that fall under the blackout region.  A. S. Closepet 66 6 1, 1, 1, 4 2.2 geyser AgeyserBpassiveloads m xxxkw=++ = 666 1, 1, 1, 5 2.4 geyser AgeyserBgeyser C m xxxkw=++ = 6666 1, 1, 1, 1, 63 geyser Ageyser Bgeyser Cpassiveloads m xxxxkw=+++ = Similarly player ‘B’ also has an option to supply power at various prices, the strategies of player ‘B’ will an integral multiple of the actual grid cost for that hour Let Grid cost = Rs 5/kwh Back-up cost = Rs 20/kwh Strategies of player ‘B’ K1=0.75kw K2=1.5kw K3=2.25kw K4=3kw For K1 the possible moves by player ‘A’ is m1 For K2 the possible moves by player ‘A’ is m2 For K3 the possible moves by player ‘A’ is m3 & m4 For K4 the possible moves by player ‘A’ is m5 & m6 Thus for each move of player ‘A’ there is a unique payoff. 3. Results In this section, key results and benefits from the MATLAB Tool for the game theory load-scheduling of residen- tial loads for diesel mitigation are discussed. The savings results in this algorithm depends highly upon how the consumer chooses his strategy & what are his requirements during that hour, the savings may result from as high as 75% to 45%. 4. Conclusions Use of a simple real time non-co-operative game theory techniques to mitigate the diesel consumption during power outages in developing countries shows significant cost savings potential by massive reduction in diesel consumption by choosing the correct strategy. The study also showed that the actual savings potential depends on the timing of power outage, duration and the specific load characteristics. As diesel prices increase, the eco- nomic benefits of load-shifting are also increase correspondingly. DSM policies for developing countries should consider specific approaches to mitigate power outages and provide relief to customers. Clearly, challenges exist in implementation of DSM policies since most consumers in India and frugal markets have outdated appliances that are unintelligent with a severe need to develop low-cost smart network-controllable solutions as a retrofit References [1] (2009) Power Annual Report 2009-10, CES, Government, India. [2] (2006) Energy and the Millennium Development Goals in Africa. UN World Summit. [3] (2012) Development Goals in Africa Electricity Supply Monitoring Initiative (ESMI), Prayas, India. [4] Foster, V. and Steinbuks, J. (2009) Paying the Price for Unreliable Power Supplies. In-House Generation of Electricity by Firms Africa. [5] (2009) Real Cost of Pow er. Universal Consulting. [6] (2010) Energy Poverty. World Energy Outlook for UN General Assembly on Millennium Goals. [7] Behera, R., Panigrahi, B. and Bhusan, B. (2011) Hybrid Short Term Load Forecasting Model of Indian Grid. Energy Power Engineering. [8] Padmanaban, S. and Sarkar, A. (2001) Electricity DSM in India Strategic & Policy Perspective.  A. S. Closepet [9] Natarajan, V., Baxi, A., Padmanabhan, R. and Mageshkumar, V. (2011) Low-Cost Bio Mechanical Energy Generator for Off-Grid Users in Emerging Markets. IEEE GHTC. [10] (2012) Action Plan for Energy Efficiency. Report, Bureau Energy Efficiency, India. [11] Kim, T. and Poor, V. (2011) Scheduling Power Consumption with Price Uncertainty. IEEE Transactions on Smart Grid. [12] Mosenian-Rad, A.-H. and Leon-Garcia, A. (2010) Optimal Residential Load Control with Price Prediction in Real- Time Electricity Pricing Environments. IEEE Transactions on Smart Grid. [13] Pedrasa, M.A.A., Spooner, T.D. and MacGill, I.F. (2009) Scheduling of Demand Side Resources Using Binary Particle Swarm Optimization. IEEE Transactions on Power Systems, 24, 1173-1181. http://dx.doi.org/10.1109/TPWRS.2009.2021219 [14] Herter, K. (2007) Residential Implementation of Critical-Peak Pricing of Electr icity . Energy Policy, 35, 2121-2130. http://dx.doi.org/10.1016/j.enpol.2006.06.019 [15] Pedrasa, M.A.A., Spooner, T.D. and Mac Gill, I.F. (2010) Coordinated Scheduling of Residential Distributed Energy Resources to Optimize Smart Home. IEEE Transactions on Smart Grid, 1. [16] (2011) Energy Infrastructure in India. World Bank Country Report. [17] Natarajan, V. and Closepet, A.S. (2012) Statistical Analysis of Cost of Energy Due to Power Outages in Developing Countries. Future Computing Conf Submission, France. [18] Natarajan, V. and Closepet, A.S. (2012) Demand-Side Approaches to Manage Electricity Outages in Developing Countries. Energycon, Florence. [19] Closepet, A.S. (2013) Multi-Layer Optimization for Load Scheduling to Manage Unreliable Grid Outages in Develop- ing Countries. APPEEC, Beijing.
|