Journal of Power and Energy Engineering, 2014, 2, 53-57
Published Online April 2014 in SciRes. http://www.scirp.org/journal/jpee
http://dx.doi.org/10.4236/jpee.2014.24008
How to cite this paper: Dhatrak, A.I. and Tatewar, S.P. (2014) Air Entrainment and Pressure Fields over Stepped Spillway in
Skimming Flow Regime. Journal of Power and Energy Engineering, 2, 53-57. http://dx.doi.org/10.4236/jpee.2014.24008
Air Entrainment and Pressure Fields over
Stepped Spillway in Skimming Flow Regime
Anant I. Dhatrak, Sandip P. Tatewar
Department of Civil Engineering, Government College of Engineering, Amravati, India
Email: anantdhatrak@rediffmail.com, sandiptatewar@yahoo.co.in
Received December 2013
Abstract
This paper deals with some aspects of the air entrainment process along the chute of spillway and
study of pressure fluctuations. The experimental study has been carried out using stepped spill-
way model located in the campus of Government College of Engineering, Amravati (India). It is
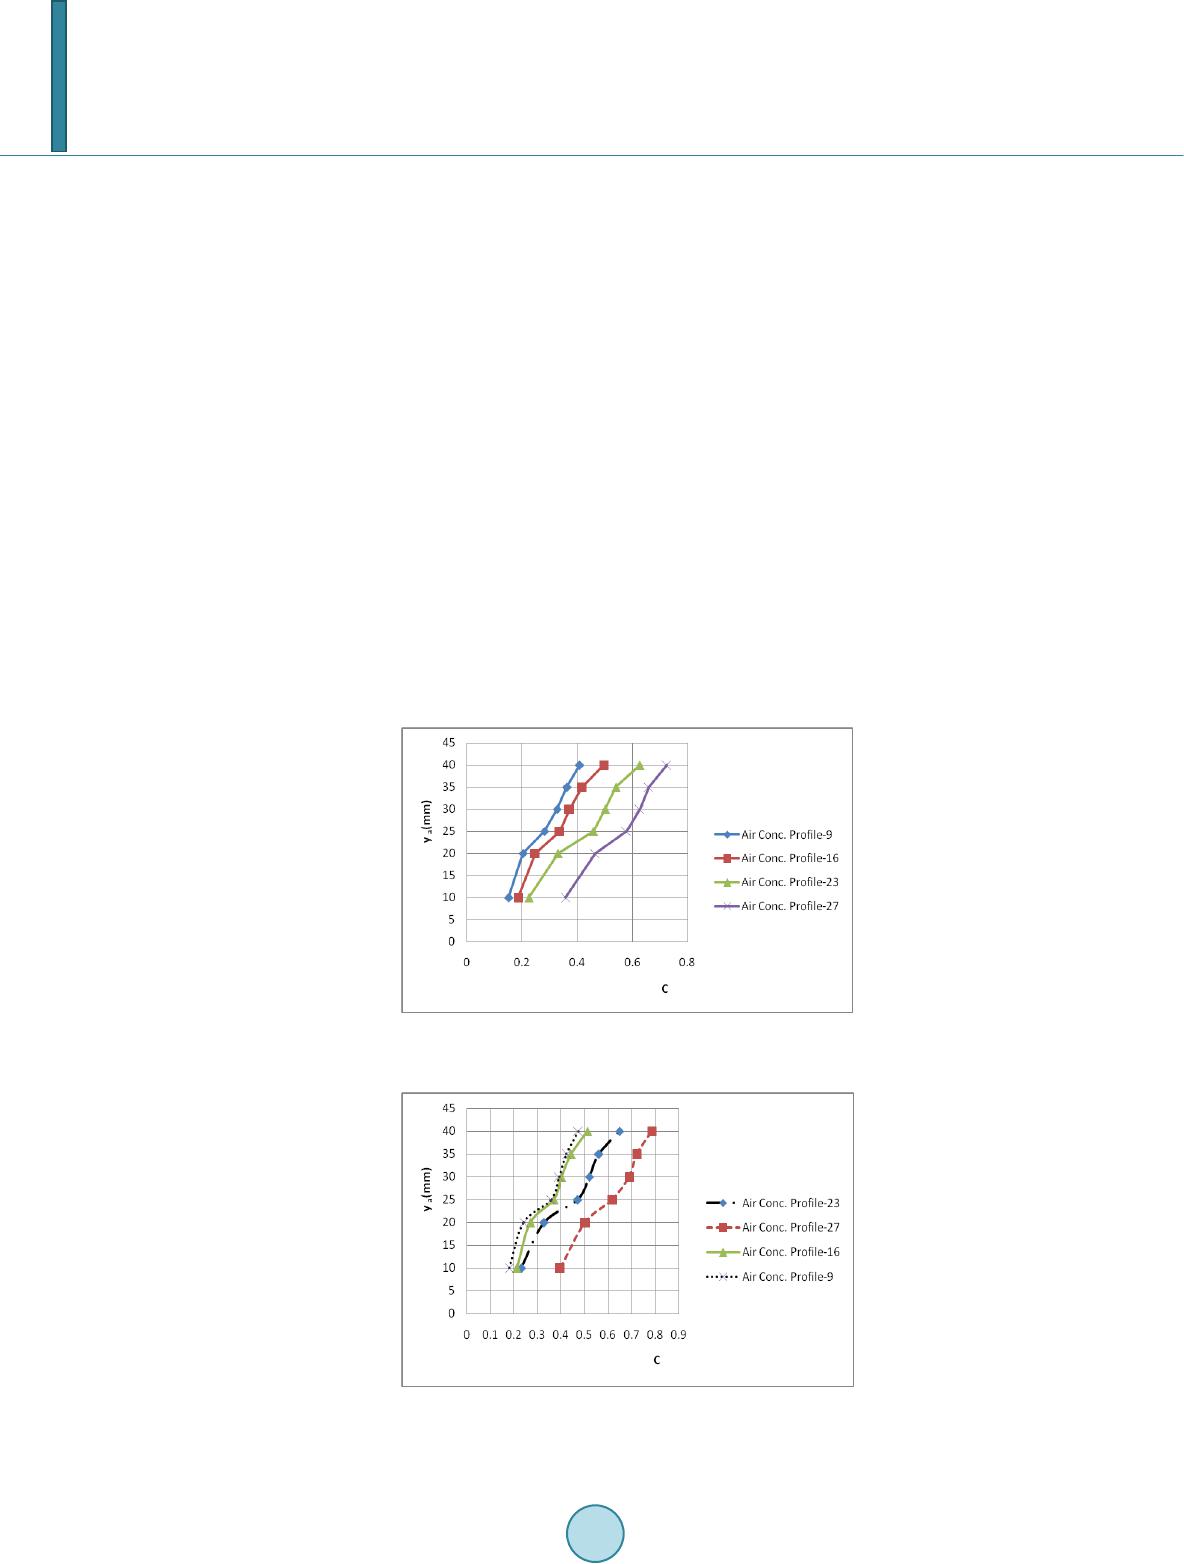
observed that air concentration is increasin g with discharge as well as with number of step. Air
concentration is increasing along the length of spillway. It is also observed that the bottom mean
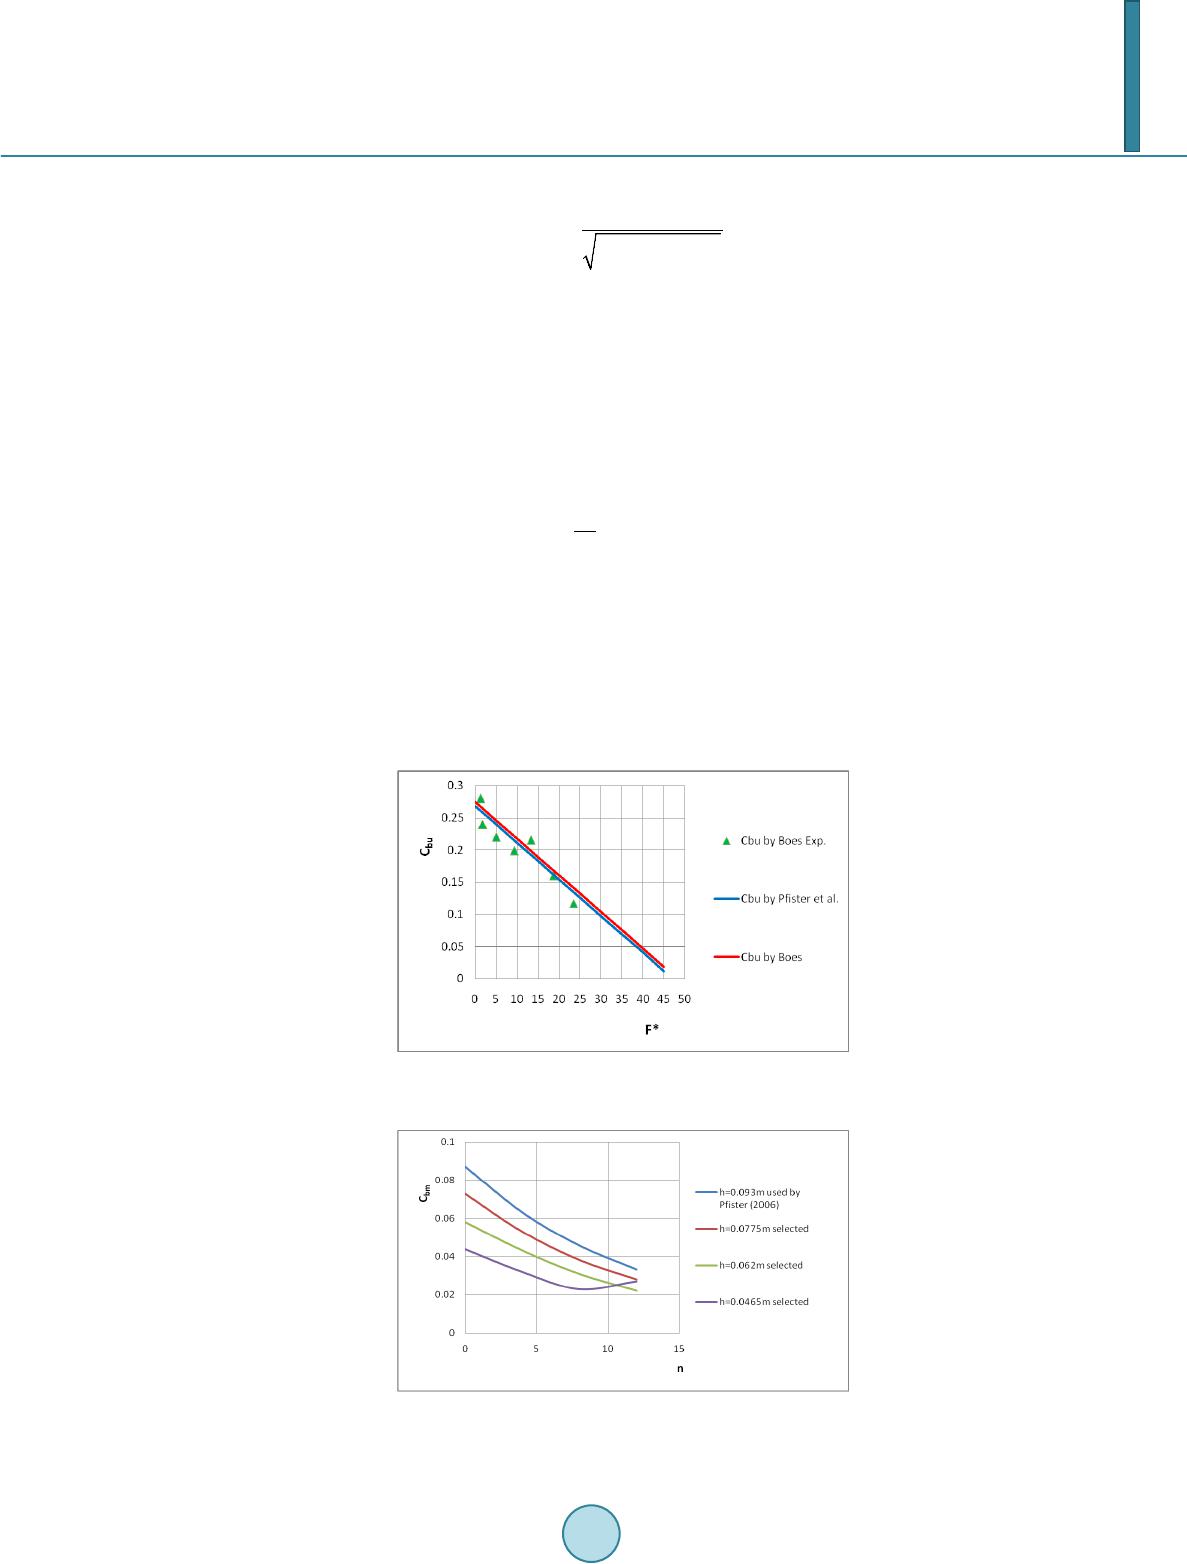
air concentration increases with step height in the upstream reach of stepped spillway, which is
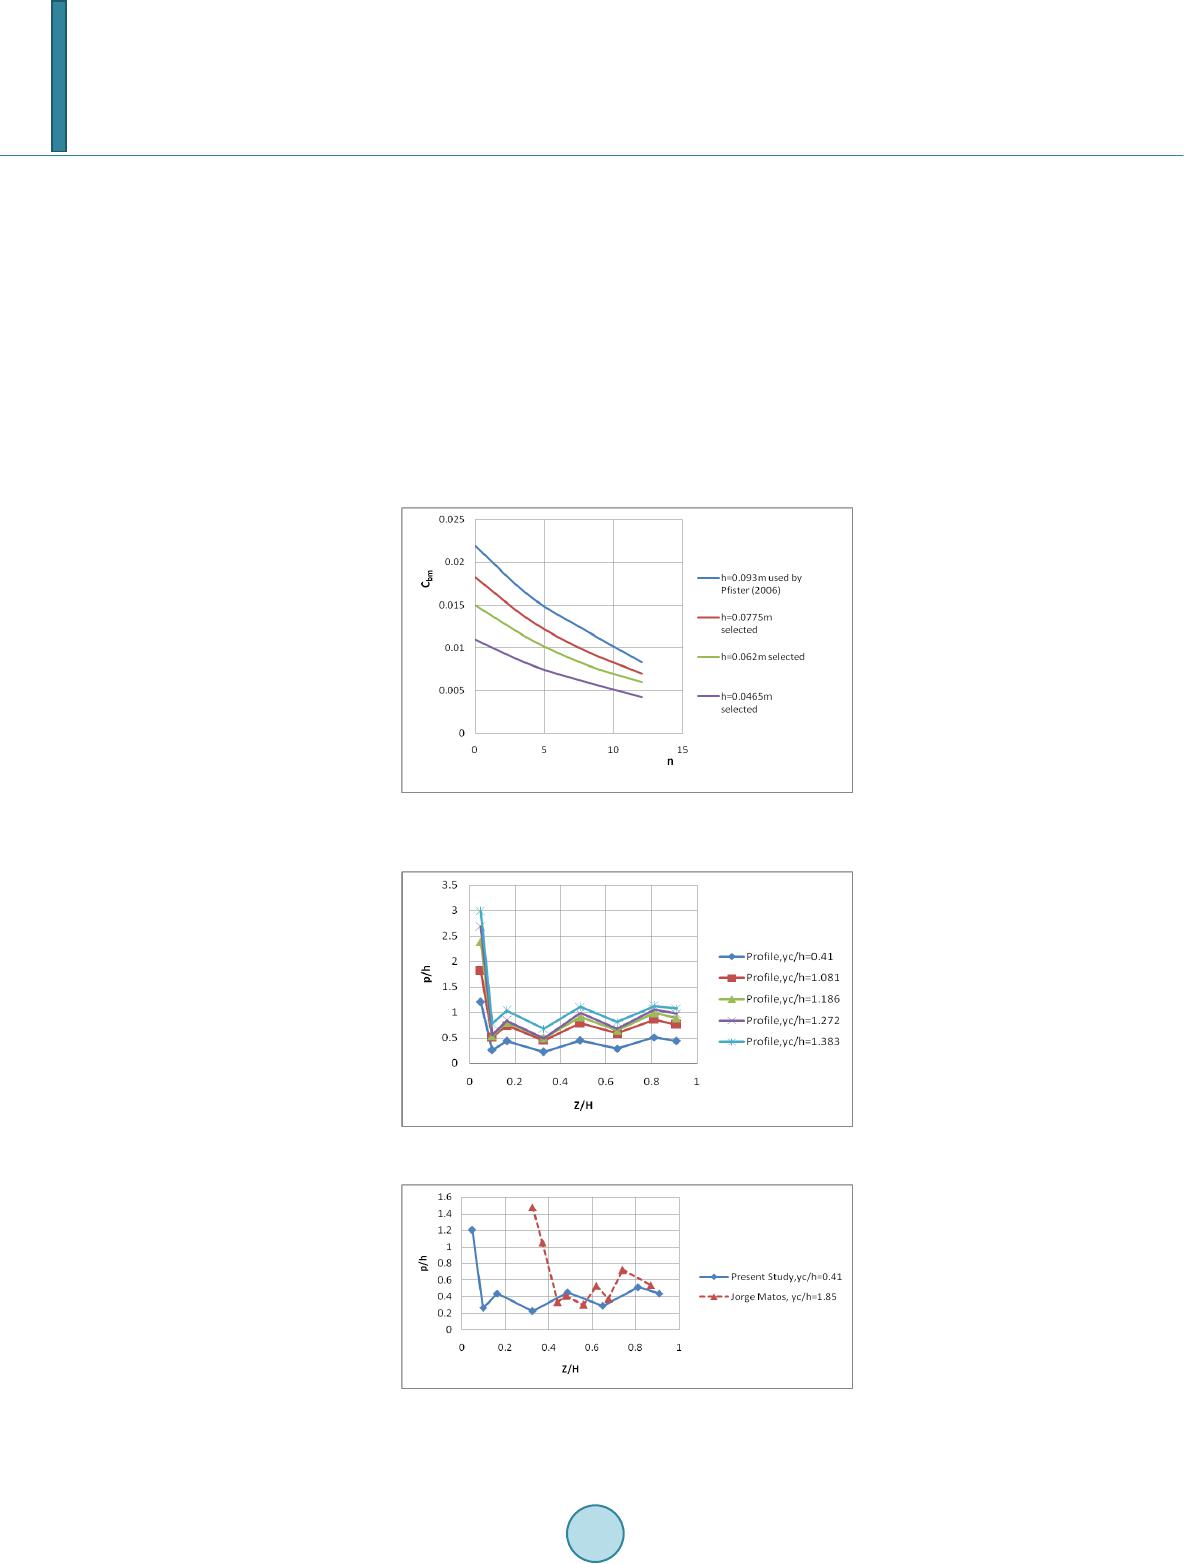
prone to cavitation. The pressure profiles exhibit a wavy pattern down the stepped chute and
pressure on each step increases with ratio of critical depth to step height (yc/h).
Keywords
Stepped Spillway; Air Entrainment; Skimming Flow Regime; Pressure Fluctuations
1. Introduction
Stepped spillways have been used for many centuries. The stepped spillway consists of series of steps provided
from just below the crest to the toe of spillway. The stepped design increases the rate of energy dissipation on
the surface of spillway and there by reduces the size of stilling basin generally provided at the toe of spillway.
The flow over stepped spillway is broadly classified into two types: 1) Nappe flow and 2) Skimming flow. In
case of nappe flow, the flow from each step hits the step below as a falling jet. In case of skimming flow regime,
the water flows down the stepped face as a coherent stream, skimming over the steps and cushioned by the re-
circulating fluid trapped between them. Along the upstream steps, the flow is smooth and no air entrainment
occurs. Downstream the flow is characterized by a large amount of flow aeration. The air entrainment starts
where the boundary layer reaches the outer edge of the free surface and this point is called point of inception.
Downstream of the point of inception, the flow becomes rapidly aerated and presents a typical white surface.
This paper deals with some aspects of the air entrainment process along the chute of spillway and study of pres-
sure fluctuations.
2. Experimental Test
A model of stepped spillway has been constructed in the premises of Government College of Engineering,