 Social Networking, 2014, 3, 134-141 Published Online February 2014 (http://www.scirp.org/journal/sn) http://dx.doi.org/10.4236/sn.2014.32017 OPEN ACCESS SN Studying Group Dynamics through Social Networks Analysis in a Medical Community Ruben P. Albuquerque1, Jonice Oliveira1, Fabrício F. Faria1, Rafael Monclar2, Jano M. de Souza2 1Graduate School in Computing Science (PPGI), Universidade Federal do Rio de Janeiro (UFRJ), Rio de Janeiro, Brasil 2Systems and Computing Engineering Graduate School (COPPE), Universidade Federal do Rio de Janeiro (UFRJ), Rio de Janeiro, Brasil Email: jonice@dcc.ufrj.br, rrpero@ppgi.ufrj.br, firminodefaria@ppgi.ufrj.br, rastumon@cos.ufrj.br, jano@cos.ufrj.br Received December 26, 2013; revised 28 January 2014; accepted 19 February 2014 Copyright © 2014 Ruben P. Albuquerque et al. This is an open access artic le distributed under the Creative Commons Attribution Li- cense, which permits unrestricted use, distribution, and reproduction in any medium, provided the original work is properly cited. In accordance of the Creative Commons Attribution License all Copyri ghts © 2014 are reserved for SCIRP and the owner of the intel- lectual property Ruben P. Albuquerque et al. All Copyright © 2014 are guarded by law and by SCIRP as a guardian. ABSTRACT In 2008, the Brazilian Depart ment of S cience and Technology created the INCTs (Brazilian S cience and Tech- nology Institutes). One of them was the Cancer Control INCT. Due to its impo rtance and considering that there are different groups working together in the same area, it is important that they collaborate intensely. Envision- ing an empowerment of scientific collaboration, the BRINCA project was created to support a set of analyses of the social networks from this particular INCT. These analyses were created by mining curricular and publica- tions bases, and identifying different types of scient ific relationships and areas. We were able to observe, for in- stance, how the interaction is amongst researchers from related areas, which researchers were more collabora- tive and which ones were isolated from the network. These analyzes were used by the INCT coordination to un- derstand and act to improve scientific collaboration. KEYWORDS Social Networks; Scientific Collaborations; Data Mining 1. Introduction The Brazilian Government created the National Institute of Science and Technology (INCT) to minimize the divi- sion and disintegration that exists amongst scientific groups. The proposal is to join differen t researchers, uni- versities and research groups of excellence, in Brazil and abroad. One of these institutes is the Brazilian Institute of Science and Technology for Cancer Control [1] that is controlled by the National Institute of Canc er (INCA). In this scenario, the BRINCA project (Balancing and Analyses of Scientific Social N etworks in Cancer Con- trol) was created. The main goals of this project are to analyze how the Cancer Control INCT members col- laborate and how the scientific knowledge flows amongst the different researchers and institutes, and the members of the group. An important aspect of our project is the temporal analyses, understanding the network evolution over the years, including important research areas and when they became more relevant. To enable these analyses, a com- putational environment was built to support the collec- tion and interpretation of historical data, as well as the identification of possible problems in group dynamics. This article consolidates and extends the seminal re- sults [2] that were presented at the first Brazilian Work- shop on Social Network Analysis and Mining (Bra- SNAM), a satellite event of the XXXII Brazilian Com- puter Society Conference in July of 2012. In this article we briefly describe the recent works in the field of medi- cal social networks (Section 2). In Section 3 we detail our proposal, th e BRINCA project and its current results in Section 4. In addition, we present related works (Sec- tion 5) and conclude this work, pointing to some future work paths (Section 6). 2. Social Network Analysis in Medicine Social network analysis in medical context is two-fold. First, it is used to contain disease dissemination, to pre- 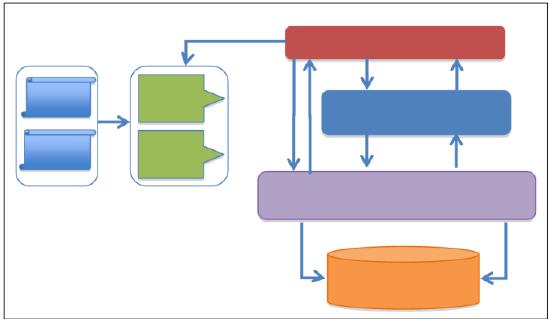 R. P. ALBUQUERQUE ET AL. OPEN ACCESS SN vent it from achieving an endemic or epidemic level. This can be made through analyzes in the social networks of those infected and predicting how the disease can spread [3-5]. The second usage is the identification of expert networks [6,7], which is the focus of this work. 3. BRINCA Project The BRINCA Project aims to map the knowledge ex- changed amongst Cancer Control INCT researchers, as well as identify how groups develop their research efforts and how professionals interact with each other. So, this project aims at the identification of scientific social net- works, the provision of mechanisms for complex analy- ses to obtain an improvement in the collaboration amongst the main specialists. The reports provided can help to detect weak or strong points in the interaction between research groups, centres, and countries, assisting in the guidance of scientific de- velopment and funding politics [8,9]. In next topics, we describe details of our approach for the analysis of the INCTCC social network. 3.1. Architecture The architecture developed for our work has its steps shown in Figure 1. The data sources are Lattes [10] and PubMed [11], which will be presented with more details in Section 3.2. We use Kettle [12] to orchestrate the extraction, treat- ment and cleaning routines. The visualization layer is composed by Gephi [13], Tableau [14] and independent reports. The metrics were calculated by Gephi [13] and stored in aData Warehouse. Section 4 details the visuali- zations and analyses. 3.2. Data Sources The Lattes Curriculum is a Brazilian nation-wide cur- ricular database with all the curricula of scientif ic profes- sionals in Brazil. All of these curricula were downloaded by XML-Lattes Too l [15] and PubMed data from its own Web service interface. After the data extraction, transformation and loading processes, our data warehouse (multidimensional data- base) stores different types of relationships between two researchers over time. The scientific types of relation- ships are: • Project Participation—being member of a project team; • Co-authored—two p eople work together in a publica- tion; • Advisory work—a professor supervises a student’s work; • Examination board participation—professors who participate in a committee, to judge and evaluate a thesis; • Judgment commissions—professors who participate in a committee, to judge and evaluate scientific work— as publications (programme committee), project propo- sals—or evaluate candidates in hiring processes; and • Other types of scientific production (e.g., patents). In addition to relationships, each one of the researchers has an individual profile, built w ith one’s personal attrib- utes, such as: Academic Level (PhD, MSc., or BSc.); Re- search and activity area; Number of Publications (per type, such as journals, proceedings, technical reports, …); Number of Project participations; Number of Thesis Ad- vice participations; and Number of Participations in Ex- amination Boards. Research and activity areas indicate what areas a researcher is connected with. Examples of research and activity areas are HPV and thyroid cancer. 3.3. Multidimensional Model All the details of scientific interactions, such as type, frequency, and members of a social network (and their profile) are stored in a Data Warehouse, which obeys a multidimensional model, shown in Figure 2 . Metrics for Social Network Analysis Layer to A ccess Multidime nsional Database Multidimensional Database Figure 1. BRINCA’s architecture. 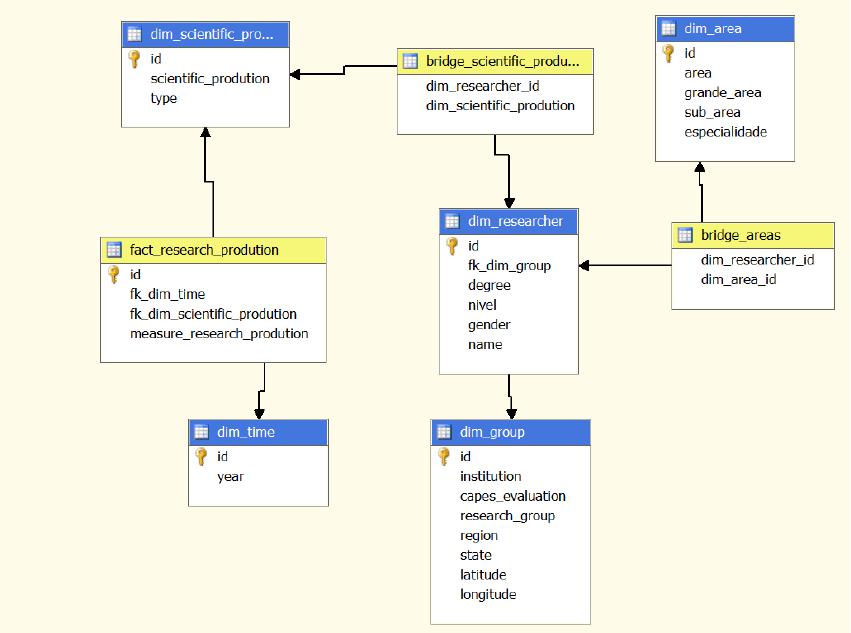 R. P. ALBUQUERQUE ET AL. OPEN ACCESS SN Figure 2. Multidimensional model. This model has a fact table that aggregates the scien- tific production per year, via an association with the Time and Scientific Production dimensions. The Scien- tific Production dimension represents each production made by one or more researchers (Researcher Dimen- sion), who can participate in groups (Group Dimension). The Gro up Dimension is related to Research Groups and has information on its evaluation and location. All re- searchers can have one or more expertise areas (i.e. Ge- netics, Biochemistry, etc.). Based on this model and using our analysis tools, we were able to get the results presented in the next section. 4. Current Results The main issue of this project (described in Section 3) is to understand the interactions amongst researchers, and the role of Cancer Control INCT in the promotion of scientific cooperation in Cancer. The works developed in the Cancer Control INCT are classified as per research themes. For each theme, there are sub-projects [1], which has researchers associated to them. Project members can be researchers with the INCT, and also from other (domestic or foreign ) institutions. To provide the results below we used data from 122 re- searchers, without introducing the students involved in the subp r o jects. One of the analyses points the most connected re- searchers in the network. A researcher with a high degree of relationships can be a person with a high lev el of in- fluence or specific expertise, not always with a supervis- ing position as department managers or project leaders. The relationship average network is 8.496. In a big net- work, it is usual to have subnets. The relationship aver- age of the most connected nodes in a subnet is 2.667. Some nodes, with a higher linkage degree, are shown in Figure 3. Red nodes are department or project heads. From the 122 researchers, 8 of them are people with no connection with other INCTCC researchers, although they have external links. That is, they are nodes discon- nected from the whole network, as seen in Figure 4, which shows members and main research area (colour). However, in Figure 4 two researchers are no t c ounted as they are not associated with any area, showing only 6 disconnected nodes in Medicine (green node), Veterinary Medicine (red), Pharmacology (pink), Pharmacy (blue) and Computing Science (purple). The network has 8 researchers who act as “bridges”, connecting large groups. Amongst these 8 researchers, 6 are central nodes (with no higher connection degree). The metric used was betweenness centr ality. The detection 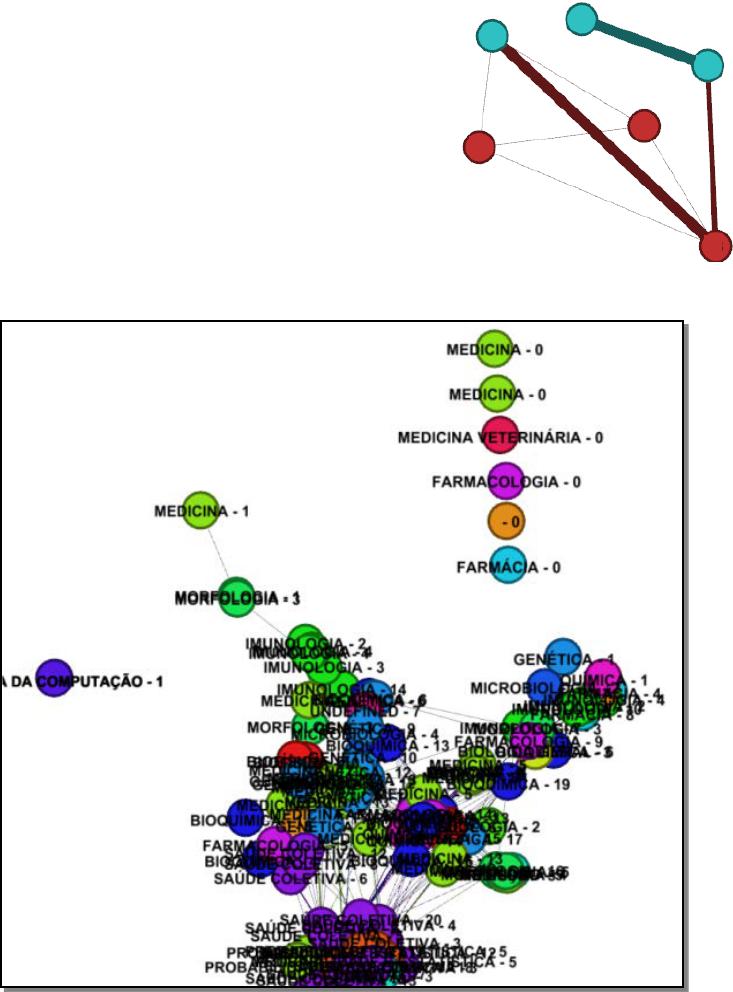 R. P. ALBUQUERQUE ET AL. OPEN ACCESS SN of bridges is important for us to verify the weak points of our network, which can be rendered fragile and could be easily divided into subgroups if a member, who is a bridge, leaves the group. Figure 5 shows a piece of the INCTCC’s social net- work, where 14 clusters were identified through Modu- larity metric, but only 3 could be associated with INCTCC areas. They are: Medicine (20.51% of the researchers), Collective Health (16.24%), and Genetics (9.4%). Analyzing internal and external interactions, we iden- tified 12 researchers (9.84%) with a greater number of connections with external researchers (who are not mem- bers of the INCTCC), compared with only 3 (2.46%) that have strong internal connections with INCTCC research- ers. Having a “very intense connection” or “very strong connection” means a node, whose frequency of interac- tion with other member exceeds 70% of the highest in- teraction frequency in entire network, which is of 30. Any node with more than 21 interactions with another can be considered as having a very strong relationship with him/her. We identified 6 researchers (4.91%) with very strong relationships with other researchers, who act in different areas. Since the creation of the INCTCC in January 2009, with its official implementation in June that year, the social network changed. Figure 6 show s co-author rela- tionships in INCTCC pre-creation and during its devel- opment. These changes affected the average degree of the net- work. Analyz ing only the co-authorship relation, we ha ve the following as average degrees: 1.009 (2007), 0.957 (2008) 0.410 (2009) 0.855 (2010) and 0.171 (2011). We can see that the number of interactions amongst special- ists was decreasing, even after the INCT implementation in 2009. However, a positive difference (increase in Figure 3. Example for most connected nodes in a subnet. Figure 4. Disconnected nodes. 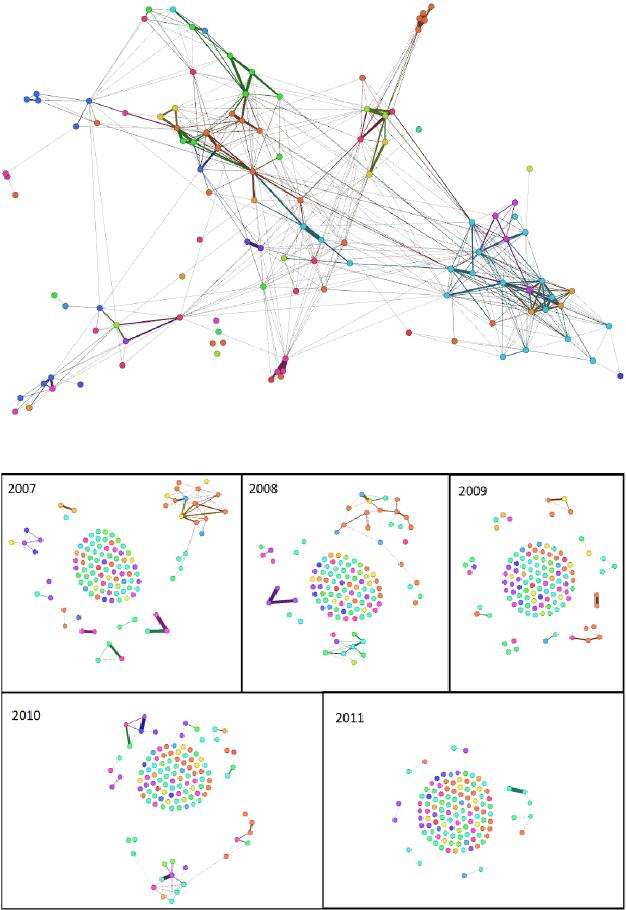 R. P. ALBUQUERQUE ET AL. OPEN ACCESS SN Figure 5. INCTCC network. Figure 6. INCTCC social network from 2007 to 2011. relationships) between years 2009-2010, the INCTCC’s first year of operation, was of 0.445. It was higher than the difference of the previous year (2008-2009, a growth of −0.547), which was negative (decreasing of relation- ships), showing that interactions increased again aft er its creation. Meanwhile, in 2011 there was a significant de- crease of this value. It possibly occurred as many publi- cations were not yet registered with the Lattes Curricu- lum or were undergoing their review stage in the jour- nals. We can see it in Figure 7, which shows the total co-authorship interactions amongst researchers. There is an empowerment of relationships from 1993 until before the INCTCC’s creation. This makes sense, as researchers knew each other and had constructed ties before the crea- tion of the Institute. Following the same line of reasoning, we saw that new relationships emerged from 2008 through to 2011, show- ing that the main goal of the INCTCC had being achieved. Year 2008 saw 54 new co-authorship relations, with 47 in 2009, 79 in 2010, and 25 in 2011. Again we should remember that when this data was processed, the produc- tion of 2011 was not 100% complete. Even with the de- crease in the total number of relationships, the number of new relations remained almost constant, increasing in 2010. We analyzed the number of publications over years, as shown in Figure 8. There is a 12% fall from 2008 to 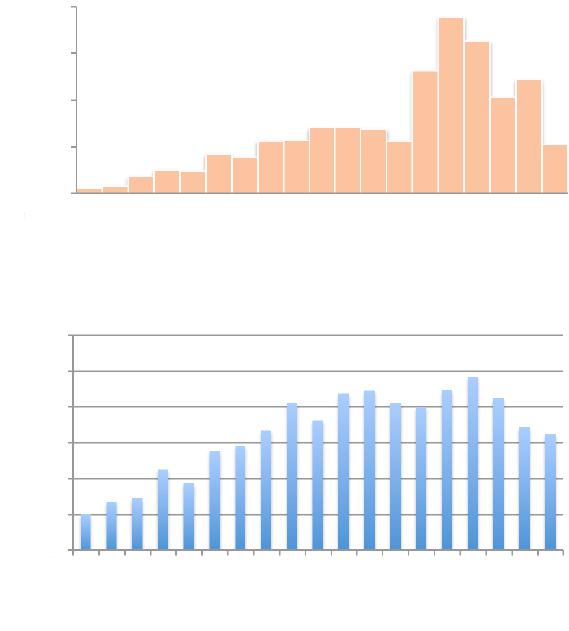 R. P. ALBUQUERQUE ET AL. OPEN ACCESS SN Numb e r of Re lationsh ips Figure 7. Total number of co-authorship relations over the years. Figure 8. Total publications over the years. 2009, but the decrease in 2010, when compared to 2008 is of 29%. Probably after the INCTCC creation, re- searchers focused their research work on INCT areas. Another possible explanation is the increase in the new number of relationships. It is natural, when you start new professional interactions, that there is a period of adjust- ment. This adaptation process involves learning about one’s new partner’s works, understa nding new processes and methods, and also the achievement of research ma- turity toward s the obtaining of results. This adaptation consumes time, a nd fewer results are expected worthy of publication. Figure 9 shows an example of interactions based on areas of common interest and expertise. The image shows interactions in the area of Collective Health. The edge’s thickness indicates the number of interactions between two people. With the developed environment, based on a multidi- mensional model, we can undertake several analyses. This project allows us to have a clear view of research group behaviour and identify key problems in scientific collaboration. 5. Related Work The most similar work is from [7], who se focus is to analyze the social networks of researchers in the field of parasitic diseases such as dengue fever, Chagas disease and malaria, for example. Co-authorship was used to infer relationships amongst researchers in a particular area. Based on keywords, extracted from title of articles, the authors identified clusters. However, the difference to our study is the use of a higher number of datasets, as Lattes and PubMed, and the identification of different types of scientific relationships (not only co-authorship). Furthermore, we automated all the data treatment proc ess. We also identify relationships amongst groups (not only amongst people), as example, institutions and funding agencies funding and can visualize all the interactions in a specific area. The work presented by [16] tried to find patterns of interaction amongst researchers in the field of tourism in regions of Australia and New Zealand. For this, he used bibliometric information in the 1999-2005 period to ana- lyze co-authorship networks, inter-institutional collabo- rations, and international collabora tions. The similarity to our work is related to the use of metrics of social net- works and some types of networks which were used. However, limitations in terms of viewing them compro- mise their final result. The fact that we created a visuali- zation approach based on Gephi and Tableau helped us 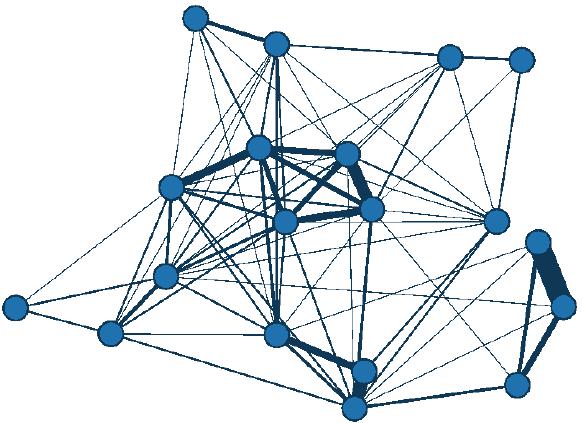 R. P. ALBUQUERQUE ET AL. OPEN ACCESS SN Figure 9. Interactions in the area of collective health. significantly, as it provided more flexibility to configure metrics and parameters. The research conducted by [17] is very close to ours, but their focus is on Web Science researchers. They do not use a multidimensional analysis to deal with data, and do not identify different kinds of relationships, ei- ther. We can also mentio n the work of [18], who brought the concept of balancing and it was the foundation for the idea presented here. The main difference between the two work, Monclar’s focused on a small community of the Department of Systems Engineering and Computing at COPPE/UFRJ, while this work focuses on all the Cancer Control INCT researchers. The Monclar et al work [2009] did not use a multidimensional database and therefore did not have the benefits of multidimensional analyses. We also identified the work of [19]. It is a study on the behaviour of collaborative production, but focused on open-source software projects. The data used to identify relationships was obtained with the analysis of source code, discussion forums, chats, and version updates. The metrics were calculated to determine the structural char- acteristics (degree, centrality, etc.) and topological (den- sity, diameter distribution, etc.) of social networks as well as in our work. Th e difference is that the focus was not to improve the network, but only to identify it. In the study by [20], we see a method to detect, iden- tify and visualize research groups in an university. The method is quite simple, relying on the generation of a matrix that lists the authors of the articles and it can infer a so cial network of co-authors. The visualization itself is quite clear and simple to understand, although it is not concerned with temporal analyses. 6. Conclusions and Future Work Social network analysis helps to understand group de- velopment and to identify relationships patterns. This kind of analysis has been used in many situations, amongst which the health care scenario. In this article, we presented the BRINCA project, whose goal is to support the analysis and visualization of scientific social networks. This project was applied in the area of Cancer Control in Brazil, in the scenario of the National Science and Technology Institutes (INCTs). The INCT is a mechanism to motivate collaboration amongst universities and research institutions dealing with strategic questions, in our case, cancer control. This project is still under development and we can mention some future works and improvements. One of them is enriching the analysis, inputting data from medi- cal records and cancer treatments. So, we can compare and identify the interaction amongst clinical treatment and research. Another challenge is the adoption of data mining tech- niques to detect associative rules and recurrence patterns. As last work, we will study the benefits of the ap- proach created for the research scenario for cancer con- trol in Brazil. Acknowledgements We would like to thank CNPq, CAPES, and FAPERJ for their support, specially by the support provided by the pro- jects “INCT para Controle do Câncer” (CNPq 573806/ 2008-0 e FAPERJ E26/170.026/2008) and “Projeto Uni- versal: CLOTO: Composição, Mineração, Análise e Pre- dição de Redes Sociais Utilizando Dados Ligados Aber- tos e Contextualizado” (CNPq 487239/2012-1), by the  R. P. ALBUQUERQUE ET AL. OPEN ACCESS SN grants “Jovem Cientista do Nosso Estado” (Young Re- searcher of Rio de Janeiro, FAPERJ: E_23/2013) and “Produtividadeem Pesquisa-Nível 2” (Productivity in Re- search-Level 2, CNPq: 308219/2010-4). REFERENCES [1] INCTCC, “INCT Activity Report 2010—Home-INCA,” 2010. http://www1.inca.gov.br/inca/Arquivos/INCT/inct_projec t_2010.pdf [2] R. A. Perorazio, F. F. Faria, R. Monclar, J. Oliveira and J. Souza, “Estudando Di nâmicas de Grupo Através da Utili- zação da Análise de Redes Sociais em uma Comunidade Médica,” Proceedings of the Brazilian Workshop on So- cial Network Analysisand Mining, XXXII Congress of the Brazilian Computer Society, Curitiba, 2012. [3] J. C. Cordeiro, “Redes Sociais e Saúde,” Revista Hispana para Elanálisis de Redes Sociales, Vol. 12, No. 10, 2007. [4] A. S. Klovdahl, “Social Networks and the Spread of In- fectious Diseases: The AIDS Example,” Social Science & Medicine, Vol. 21, No. 11, 1985, pp. 1203-1216. http://dx.doi.org/10.1016/0277-9536(85)90269-2 [5] M. Negreiros, et al., “Optimization Models, Statistical and DSS Tools for Dengue Prevention and Combat,” Ef- ficient Decision Support Systems: Practice and Chal- lenges in Biomedical Related Domain, INTECH Opena Access Publisher, Vol. 1, 2011, pp. 115-160. [6] R. S. Monclar, “Análise e Balanceamento de Redes So- ciais no Contexto Científico,” M.Sc. Thesis, COPPE/ PESC, Universidade Federal do Rio de Janeiro, 2008. [7] C. M. Morel, S. J. Serruya, G. O. Penna and R. Gui- maraes, “Co-Authorship Network Analysis: A Powerful Tool for Strategic Planning of Research, Development and Capacity Building Programmes on Neglected Dis- eases,” PLoS Neglected Tropical Diseases, Vol. 3, No. 8, 2009. http://dx.doi.org/10.1371/journal.pntd.0000501 [8] A. Parent, F. Bertrand, G. Côté, et al., “Scientometric Study on Collaboration between India and Canada, 1990- 2001,” 2003. http://www.science-metrix.com/pdf/SM_2003_009_DFA IT_Indo-Canadian_S&T_Collaboration.pdf [9] J. Owen-Smith, M. Riccaboni, F. Pammolli, et al., “A Comparison of U.S. and European University-Industry Relations in the Life Sciences,” Management Science, Vol. 48, No. 1, 2002, pp. 24-42. http://dx.doi.org/10.1287/mnsc.48.1.24.14275 [10] Lattes, “Lattes,” 2012. http://lattes.cnpq.br/ [11] Pubmed, “PubMed Home,” 2012. http://www.ncbi.nlm.nih.gov/pubmed [12] Pentaho, “Pentaho Kettle Project,” 2012. http://kettle.pentaho.com [13] Gephi, “Gephi,” 2012. http://gephi.org/ [14] Tableau, “Tableau Software,” 2012. http://www.tableausoftware.com/ [15] G. O. Fernandes, J. Oliveira and J. M. Souza, “XMLattes A Tool for Importing and Exporting Curricula Data,” In- ternational Conference on Information and Knowledge Engineering, Las Vegas, 2011. [16] P. Benckendorff, “Exploring the Limits of Tourism Re- search Collaboration: A Social Network Analysis of Co- Authorship Patterns in Australian and New Zealand Tour- ism Research,” 20th Annual CAUTHE Conference, Ho- bart, Australia, 2010. [17] A. H. F. Laender, et al., “Building a Research Social Net- work from an Individual Perspective,” ACM/IEEE Joint Conference on Digital Libraries, Ottawa, 2011, pp. 427- 428. [18] R. S. Monclar, J. Oliveira and J. M. Souza, “Analysis an d Balancing of Social Network to Improve the Knowledge Flow on Multidisciplinary Teams,” 13th International Con- ference on Computer Supported Cooperative Work in De- sign, Santiago, Chile, 2009. [19] S. F. De Sousa, M. A. Balieiro and C. R. B. de Souza, “Análise Multidimensional de Redes Sociais de Projetos de Software Livre,” Proceedings of the 2008 Simpósio Brasileiro de Sistemas Colaborativos, Vila Velha, 27-29 October 2008, pp. 23-33. http://dx.doi.org/10.1109/SBSC.2008.35 [20] A. Perianes-Rodriguez, C. Olmeda-Gómez and F. Moya- Anegón, “Detecting, Identifying and Visualizing Re- search Groups in Co-Authorship Networks,” Scientomet- rics, Vol. 82, No. 2, 2010, pp. 307-319. http://dx.doi.org/10.1007/s11192-009-0040-z
|