 Journal of Computer and Communications, 2014, 2, 201-209 Published Online March 2014 in SciRes. http://www.scirp.org/journal/jcc http://dx.doi.org/10.4236/jcc.2014.24027 How to cite this paper: Kalhori, S.R.N. and Zeng, X.-J. (2014) Improvement the Accuracy of Six Applied Classification Algo- rithms through Integrated Supervised and Unsupervised Learning Approach. Journal of Computer and Communications, 2, 201-209. http://dx.doi.org/10.4236/jcc.2014.24027 Improvement the Accuracy of Six Applied Classification Algorithms through Integrated Supervised and Unsupervised Learning Approach Sharareh R. Niakan Kalhori1,2*, Xiao-Jun Zeng3 1Department of Public Health, School of Health, Ahvaz Jundishapur University of Medical Sciences, Ahvaz, Ir an 2Social Determinants of Health Research Center, School of Health, Ahvaz Jundishapur University of Medical Sciences, Ahvaz, Iran 3Department of Machine Learning and Optimization, School of Computer Science, The University of Manchester, Manchester, UK Email: *niakan.sh@aju ms.aac.ir Received Novemb er 2013 Abstract We have presented an integrated approach based on supervised and unsupervised learning tech- nique to improve the accuracy of six predictive models. They are developed to predict outcome of tuberculosis treatment course and their accuracy needs to be improved as they are not precise as much as necessary. The integrated supervised and unsupervised learning method (ISULM) has been proposed as a new way to improve model accuracy. The dataset of 6450 Iranian TB patients under DOTS therapy was applied to initially select the significant predictors and then develop six predictive models using decision tree, Bayesian network, logistic regression, multilayer percep- tron, radial basis function, and support vector machine algorithms. Developed models have inte- grated with k-mean clustering analysis to calculate more accurate predicted outcome of tubercu- losis treatment course. Obtained results, then, have been evaluated to compare prediction accu- racy before and after ISULM application. Recall, Precisio n, F-measure, and ROC area are other cri- teria used to assess the models validity as well as change percentage to show how different are models before and after ISULM. ISULM led to improve the prediction accuracy for all applied clas- sifiers ranging between 4% and 10%. The most and least improvement for prediction accuracy were shown by logistic regression and support vector machine respectively. Pre-learning by k- mean clustering to relocate the objects and put similar cases in the same group can improve the classification accuracy in the process of integrating supervised and unsupervised learning. Keywords ISULM; Integration Supervised and Unsupervised Learning; Classification; Accuracy ; Tuberculosis *Corresponding author.  S. R. N. Kalhori, X.-J. Zeng 1. Introduction Creating predictive (classif ication) models is one of the machine learning applications in order to uncover novel, interesting, and useful knowledge from large volumes of data in many medical domains such as diagnosis, prognosis and treatment. They are successfully developed through applying several machine learning techniques [1]. In the area of tuberculosis control, models with inappropriate degree of accuracy to predict the outcome of treatment courses have been developed; they are able to define patient treatment destination and confirm whe- ther or not each patient finishes a complete course of treatment entirely [2]. The requirement of more precise model to support DOTS therapy of tuberculosis control led us to examine a novel method in order to build more accurate models through applying both supervised and unsupervised methods together. Supervised learning is applied to make predictions about future cases where current available instances are given with known labels (the corresponding correct outputs) [1]. Supervised machine learning involves trying to find out the algorithms that learn from externally supplied instances in order to produce general hypotheses. The main goal of supervised learning is model development reasoned from the distribution of class labels in terms of predictor features selected by feature analysis. Then, the resulting classifier is applied to allocate class labels to the testing instances where the values of the predictor features are identified, but the value of the class label is unknown [3]. Many supervised classifiers are currently available; they have been categorized in main groups like logic-based methods, perceptron-based techniques, statistical learning algorithm, and support vector ma- chine [1]. There is critical analysis requirement to demonstrate what features of an algorithm make it successful on spe- cific dataset to support a particular task. One of the major criteria is accuracy; each classification algorithm per- forms differently in terms of accuracy based on the available dataset’s characteristics. To predict the outcome of a course of tuberculosis treatment, the predictive model needs to be precise as according to the destination of therapy, the level of intervention would be defined. The more accurate the model is, the more proper of health care provided to TB patients will be [4]. Generally, Decision trees (DT), neural networks (NN), support vector machine (SVM), Bayesian network (BN), K-nearest Neighbor classifier (K-NN), Logistic Regression (LR), and radial Basis function (RBF) are ap- plied classification algorithms for medical datasets [1]. In unsupervised or undirected learning, there is a set of training data tuples with no collection of labeled target data available. The aim of unsupervised learning is discovering clusters of close inputs in the data where the al- gorithm has to find the similar data as a set. In unsupervised learning all variables are treated the same way without the difference between dependent and independent attributions [3]. The application of supervised learning solely to predict the outcome of tuberculosis treatment course has been already examined on the available data [2]; however, the produced results haven’t been precise enough for fur- ther application. Here, we aim to utilize the integrated approach of supervised and unsupervised learning me- thods to boost the accuracy of predictive method. Integrated approach may lead to taking the advantage of both supervised and unsupervised learning methods to build up the combined models that could best reflect the pre- dicted class. In this way, comparable cases are collected in clusters according to their similarities discovered among their input features. Typically, this process is conducted before supervised learning and feeds the super- vised learning algorithms by the more grouped and similar records. At the next stage, learning process proceeds with supervised learning paradigm in order to estimate the considering classes which in this case is the outcome of tuberculosis treatment course destination. This may lead to affect the classification algorithm accuracy posi- tively to amplify its predictability; also the iteration times might decrease as the classification algorithm is trained from already clustered data. This might be as a result of ISULM’s ability to handle large bodies of data- set and, moreover, unsupervised learning performance in partitioning of the training dataset. That is, after creat- ing partitions by clustering approaches, supervised learning algorithm by each piece of partitioned dataset is supplied. Thus, instead of learning by whole training dataset, combining the two learned results may lead to in- crease pace, accuracy and even comprehensibility of produced predictive model. Although ISULM has been already used to fulfill aims such as feature analysis [5] or cause-and-effect rela- tionship detection [6], however, it is the first time that this approach is used for prediction accuracy improve- ment. This study is aimed at evaluating the effect of supervised and unsupervised learning integration on accuracy  S. R. N. Kalhori, X.-J. Zeng of six developed models to predict the outcome of tuberculosis treatment course. This aim can be considered in more detail as follows: 1) Determine which one of examined cluster number is the most optimized for the given classification task. Here, two, three, and four partition number have been examined. 2) Which classification al- gorithm outperforms in the way of cluster-based input-output mapping. 3) How effective ISULM has performed to improve the prediction accuracy. 2. Material and Methods 2.1. Data Source The dataset has been built from data gathered by health practitioners, nu rses, and physicians at local TB control centres throughout Iran in 2005. By using ‘Stop TB’ software, data of more than 35 features for TB patients were collected. By applying bivariate correlation, we chose seventeen influential factors for every TB patient in frame of DOTS therapy (P ≤ 0.05). The refined dataset consists of 6450 cases categorized in three main classes such as demographical, clinical, and social factors. Detail of applied dataset is available in [2]. 2.2. Applied Classification Algorithms DT, LR, BN, MLP, RBF, and SVM are the classifiers examined on the available dataset. Using WEKA package (available at http://www.cs.waikato.ac.n z/ml/wek a/), whole dataset was taken to produce training (two-third) and testing (the other one-third) datasets each containing seventeen significantly correlated attributes and the outcome variables for every record without any missing data. Six above named classifiers were applied to train dataset to estimate the relationship among the attributes and to build predictive models. Afterwards, testing da- taset which was not used to model development was utilized to calculate the predicted classes and compare the predicted values with the real ones available in testing dataset. Recall, Precision, F-measure, and ROC area are other criteria used to assess the models validity. 2.3. K-Mean Clustering Method K-mean is a centroid-based algorithm which takes the input parameter, normally named k, and then partition a set of n objects into k clusters leading to high intra-cluster and low inter-cluster similarity. The k-means algo- rithm initially selects k of the objects, each of which primarily shows a cluster mean or centre. Then, for each of the remaining objects, one object is assigned to the cluster with most similarity according to the distance be- tween the object and the cluster mean. Next, it computes the new mean for each cluster iterating until the cen- triod function converges. Every object is distributed to a cluster on basis of cluster centre whichever is nearest [3]. This distribution forms silhouettes, demonstrated in next part. 2.4. Silhouette Analysis After creating clusters indices by k-mean partitioning algorithm, the silhouette may reflect how well-separated the resulting clusters are. Silhouette is a plot where rows correspond to the objects of the n-by-p data matrix X and column is associated with each cluster which can be a categorical variable, numeric vector, character matrix, or cell array [7]. A number of approaches are available to calculate distances between points; squared Euclidean distance is the most applied way to compute distance between objects. The produced silhouette plot in actual fact displays a measure of how close each point in one cluster is to points in the neighboring clusters ranging from +1, indicating points that are very distant from neighboring clusters, through 0, denoting points that are not distinctly in one cluster or another, to −1 signifying points that are probably assigned to the wrong cluster [8]. 2.5. Integrated Supervised & Unsupervised Learning Method (ISULM) The available dataset which has been already applied to estimate the outcome of tuberculosis treatment course by six classification algorithms is used to improve classifiers’ prediction accuracy via ISU LM; the steps of ap- proach have been illustrated in more detail as follows: Let us assume the seventeen input variables as:  S. R. N. Kalhori, X.-J. Zeng where and e may vary based on the variable type. For instant, for a dichotomous variable, the value of e is two. A correspondent target outputs addressing the outcome of tuberculosis treatment course as r, Where . So we have: where t indexes different examples in the dataset and here for our dataset is 6450; however, based on the fact that the dataset was divided for training and testing in the way that two-thirds were for training and the other third for estimating performance, we will have two datasets including R and T denoting training and testing da- tasets respectively as follows: , N = 4515 , N = 1935 where t represent pair number of an input and the corresponding target output ; R and T consist of 4515 and 1935 pairs of examples for training and testing set respectively. In order to apply clustering learning algo- rithm for every one of training and testing set, is removed from dataset at the beginning of clustering learn- ing. Because of the partitioning method capacity to handle large volume of data, k-me a n clustering method has been examined. K-means clustering method which is a centroid-based technique is employed to group dataset into K partitions ( ). Table 1 presents the number of objects in each cluster for training and testing sets separately. The iteration process carried out 10 times and when the same index for a given object was yielded repeatedly, those indexes accepted determining which cluster the object belong to. The training and testing datasets were divided into K clusters separately in MATLAB environment. After adding the target output for each cluster, we denote training sets as and testing sets as where i is the cluster-based training or testing set and K is the number of partitions produced by K-means clustering varying from 2 to 4 in this study. Applying each to train each of six considered classifiers including DT, BN, LR, NN, RBF, and SVM, the related models are built distinctly through using WEKA package. For every partition number K, we have correspondent number of constructed models named ; where constructed model trained by the cluster-based training set and K is the number of partitions constructed by K-mean clustering approach . To check the validity and generalization ability of this mapping from to , every of developed mod- els are checked by correspondent testing data . Now, by this application for every , we are going to cal- culate where y is the class label of outcome of tuberculosis treatment course. It is defined by correspondent model parameters, i is the index of patient records in testing set in every cluster K, partitioned by K-means clustering method. Then, for every K, including 2, 3, and 4 partition number, the correspondents are put together to make up the whole yielded y as classification label for whole testing set together. For example, for K = 2, we have two series of on which i for first series comprise the calculated classification label of tubercu- losis treatment course from to patient and for the second series include the second cluster from to cases. These series of converged to compose which are obtained based on both clu- stering and classification methods. Having compared these produced and the correspondent for each by using accuracy comparison measurement like prediction accuracy, the impact of ISULM approach is revealed. To calculate the prediction accuracy, confusion matrices are developed for yielded from each partition number . The process of calculation based on has also been conducted by using training set leading to training accuracy calculation which shows the degree of our model fitness. However, for judgment of a model, the importance of model accuracy addressed by a measurement like prediction accuracy is the subject of high interest. At the final stage, yielded prediction and training accuracy for two, three, and four-clustered based models are compared; also these results compared for six classification algorithms to find out which one of those applied classifiers outperforms others. The combination stage including confusion matrix construction and comparison process are carried out in WEKA and SPSS environment. Figure 1 depicts the all above mentioned methodology 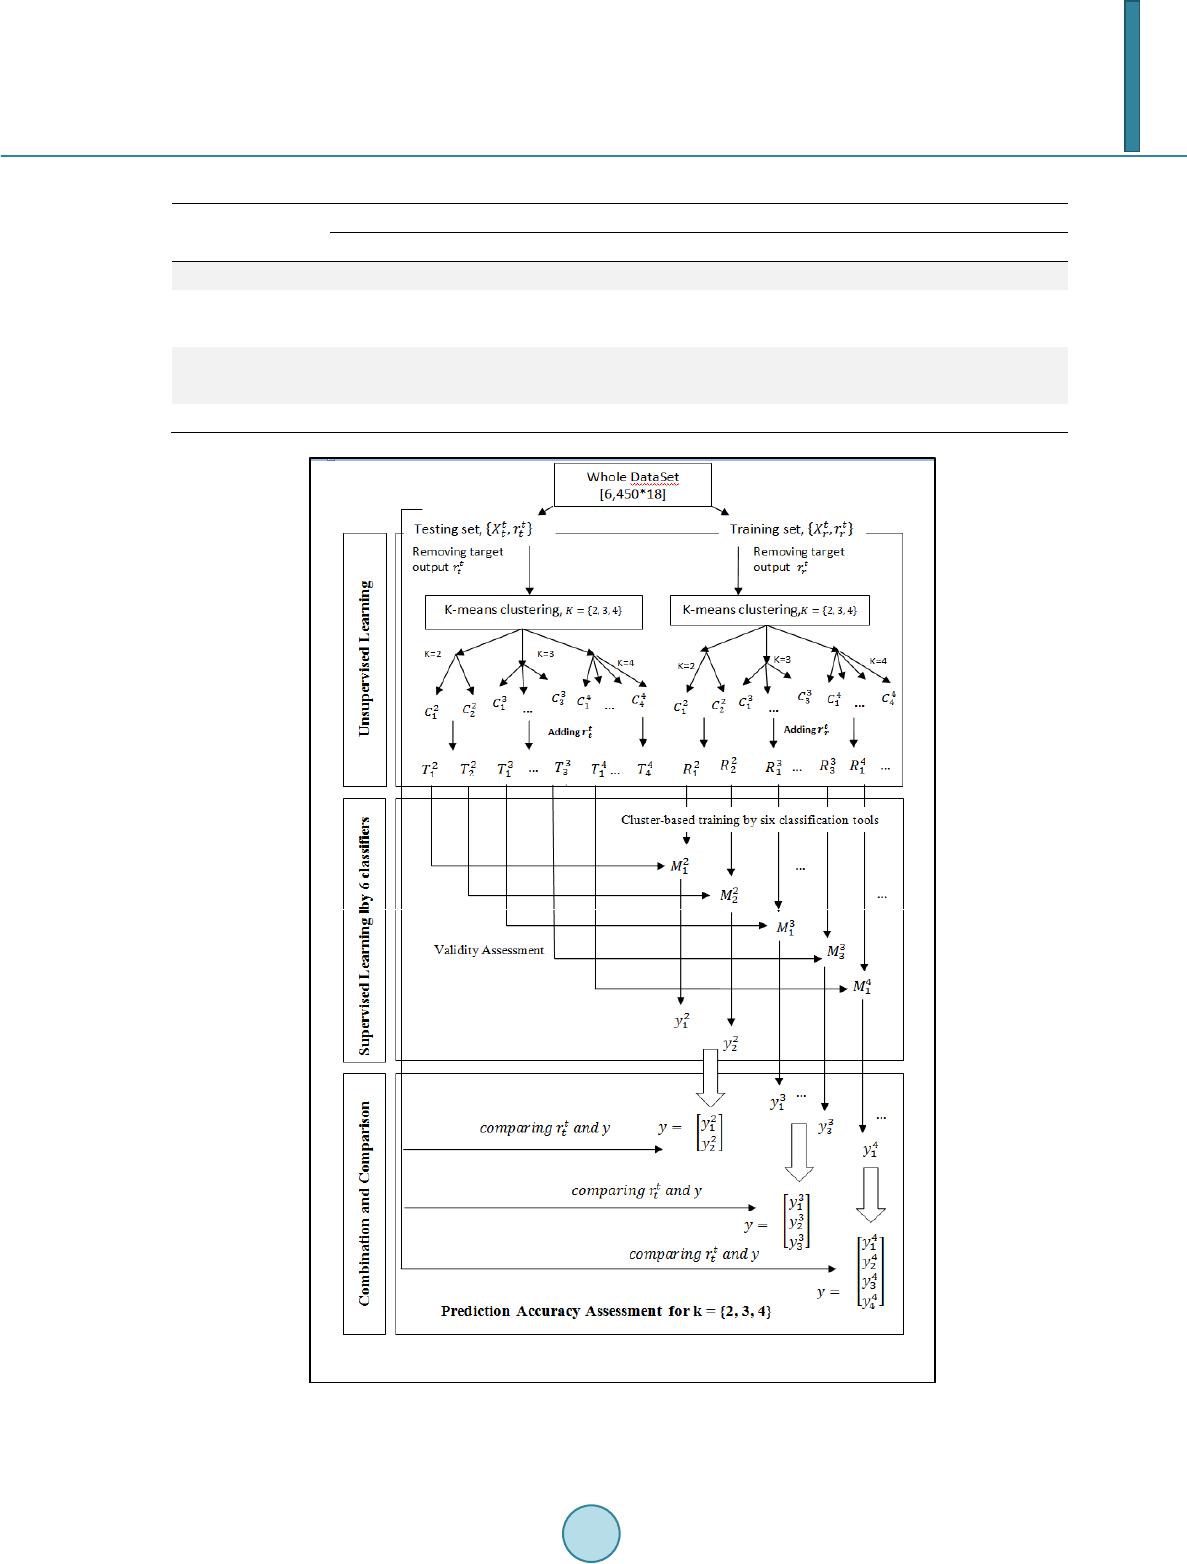 S. R. N. Kalhori, X.-J. Zeng Table 1. Applying k-mean clustering method to cluster the training and testing set after removing outcome parameter. Data 2-cluster 3-cluster 4-cluster C1 C2 C1 C2 C3 C1 C2 C3 C4 Training Set 2255 2260 1560 1707 1248 1309 1227 940 1039 Total 4515 4515 4515 2-cluster 3-cluster 4-cluster Testing Set C1 C2 C1 C2 C3 C1 C2 C3 C4 966 969 669 732 534 561 526 403 445 Total 1935 1935 1935 Figure 1. Schematic processes of supervised & unsupervised learning integration and evaluation.  S. R. N. Kalhori, X.-J. Zeng in a schematic process. 3. Results Produced results can be categorized in three main sections; first, the results obtained from different numbers of cluster K, second findings related to different classification algorithms comparison, and finally results which re- veal the effect of ISUL M on predictive models accuracy. 3.1. Cluster Number Oriented Results The Returned silhouette for are displayed in Figure 2. The average silhouette values and obviously Figure 2. The silhouette plot for two, three and four partition number clustered by k-mean method. 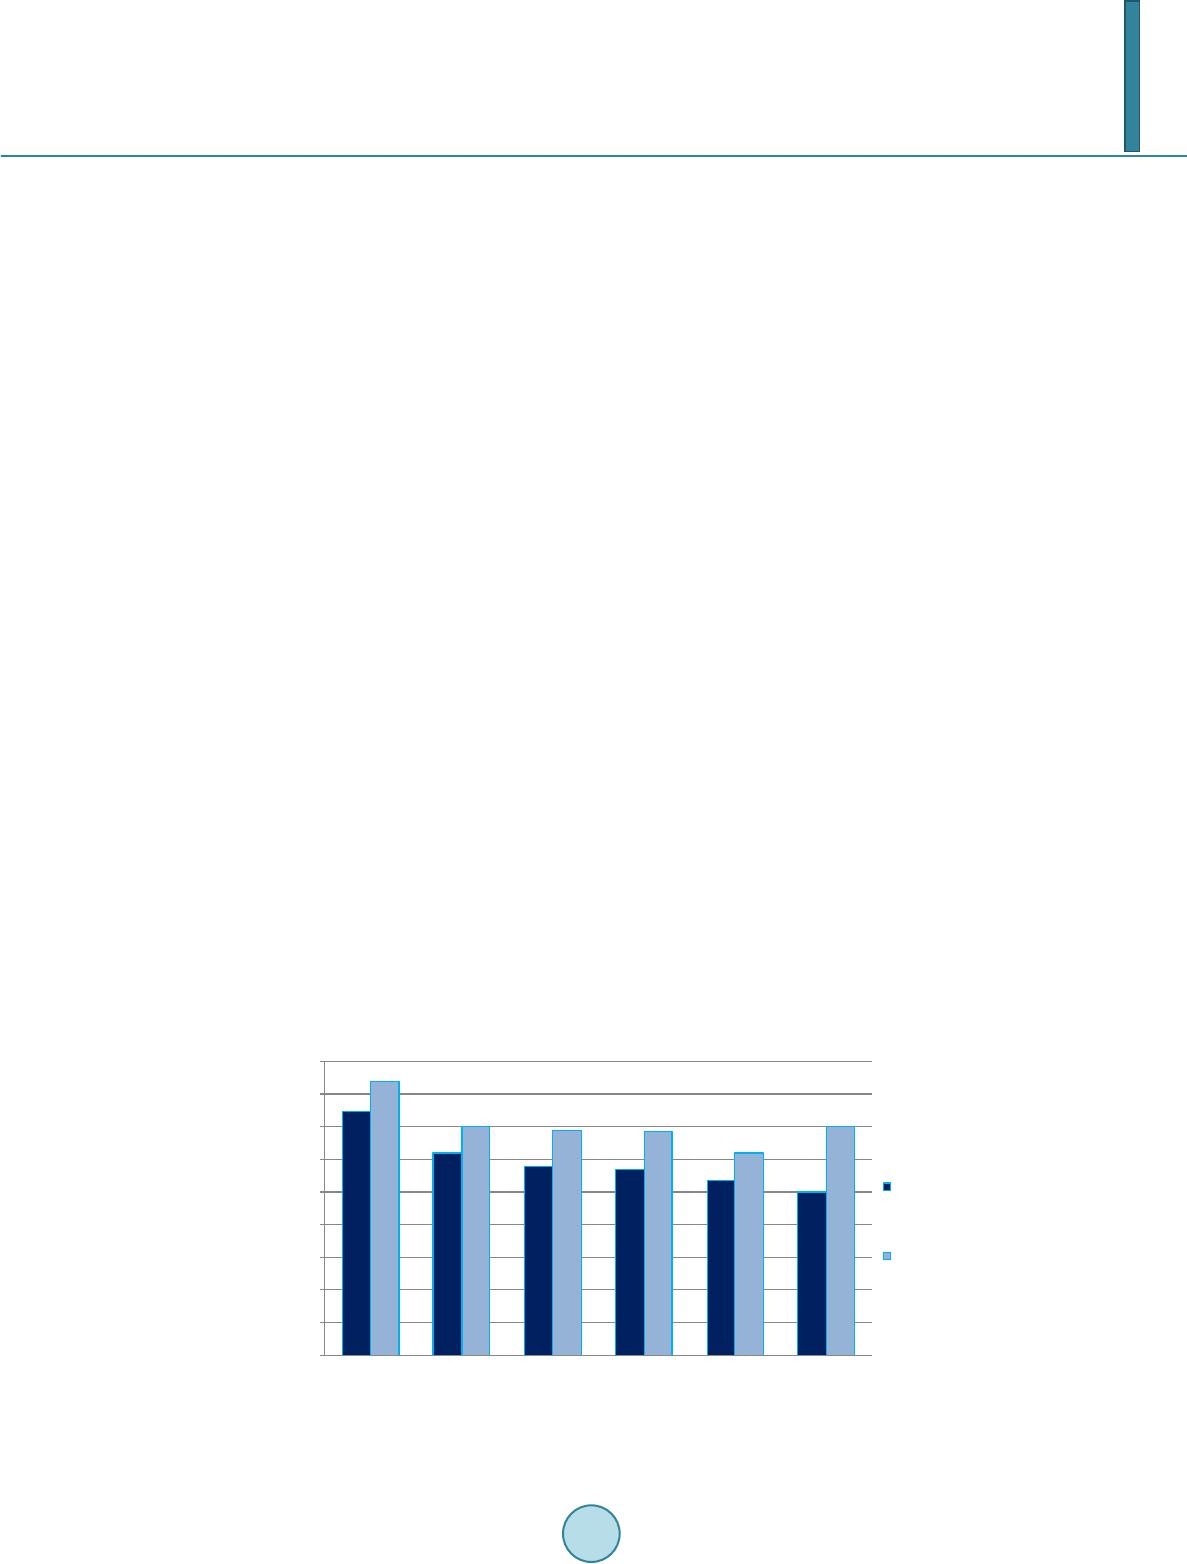 S. R. N. Kalhori, X.-J. Zeng from the silhouette plots clusters with K = 3 is slightly more well-separated from neighboring than others; fur- thermore, clusters contain negative silhouette values indicating that those four clusters are not well separated. 3.2. Classification Algorithm-Oriented Results To assess how the six considered classifiers have worked in the method of combination of supervised and unsu- pervised learning, confusion matrix is developed for each classifier and for every partition number separately. Here, model fitness and model accuracy are calculated. Thus, there are 36 confusion matrices produced for six tools and three Ks. The 3-cluster based models have been the best in all cases where the model accuracy has been 80% for 3-cluster based model partitioning decision tree whereas this value has been 75% and 48% for two and four clusters respectively. This story is the same for Bayesian network, signified where the model accuracy is 65.43 for K = 3 which is greater than 60% and 57.3% for two and four clusters. Likewise, for logistic regression the prediction accuracy is calculated as 67.60% which is 15% and 18% more than the results for two and four clusters respectively. Produced results by MLP confirm the 3-cluster outperformance when the prediction accuracy obtained from 3-cluster based model is 64.80 which is 4% and 6.5% for two and four cluster-based learning results. For radial basis function, 3-cluster based learning has given the better result of prediction accuracy with 55.80% compared with 49% and 43% for two and four cluster number respectively. Last example of three-cluster base learning superiority with 63.11% rather than the partition number two with 56% and four with 50% has been gained by support vector machine performance. Comparisons among two, three, and four cluster-based learning results by six classification algorithms proved that three-cluster is the best partition number. 3.3. Effect of ISULM on Accuracy Improvement After applying combined clustering and classification method for six considered classification methods, there is the opportunity to compare prediction accuracy before and after this method application. Figures 3 demonstrate the prediction accuracy percentage and F-measure values for DT, BN, LR, MLP , RBF, and SVM comparatively. The improvement in these two measurements is obviously clear; where for all above mentioned classifiers, the prediction accuracy improvement are reported as 7%, 5%, 10%, 7%, 3.5%, and 4.8% respectively. This improvement for all employed classifiers through combination method by F-measure values improve- ment is verified due to these values showing the extent of these improvements including 0.11, 0 .08, 0.10, 0. 11, 0.09, and 0.20 for DT, BN, LR, MLP , RBF, and SVM respectively. 4. Discussion The silhouette values and their corresponded plots for different number of partitions (K = 2, 3, and 4) show that Figure 3. Comparison of six machine learning tools F-measure for model accuracy before and after clustering. 0 0.1 0.2 0.3 0.4 0.5 0.6 0.7 0.8 0.9  S. R. N. Kalhori, X.-J. Zeng obviously K = 3 has returned the most well-separated clusters with greater mean silhouette values and no nega- tive silhouette values. To describe each of three clusters and understand whether or not the clustering partitioned the objects properly, we calculate the mode for each variable in the boundary of every cluster. Here, mode is the most occurred values for each variable in each cluster’s border. We have investigated the mode of each attribu- tion’s values before and after clustering. Table 2 presents the mode measurement which is the most frequent values of applied variables in training set. Apparently, the majority of variables’ modes have been changed be- fore and after clustering due to the change in objects’ location which have been updated in the process of parti- tioning through K-mean clustering approach; this may result in developing groups of patients with new members since clustering aims to put more similar cases in a cluster and far apart groups of patients as far apart as possi- ble from each other. According to the k-mean clustering requirement that each object must belong to exactly one group, similar cases are placed in one cluster in more frequent values of applied variables [8]. Developed groups may increase the models accuracy since similar patients/condition might be placed in the same sector and map- ping these consistence segments might lead to more accuracy and precision. The values of mode in training set (before clustering) are different from the mode values of each attribution in clusters. It seems clustering has been strong enough to divide cases and put similar conditions together. To sum up, having compared the mode before and after clustering in training set and , it is revealed that by using clustering, proper segmentation has been conducted. Furthermore, there are connections among values of clustered variables in medical point of view. To be pre- cise, by clustering and changing the objects partition, the most common values of variables in each cluster have been arranged in a meaningful way. For instance, in the first cluster, the most repetitive cases are young new cases with no long length of TB who are under good supervision in rural area. In cluster 2, there are mainly those cases who are old females from Afghanistan living in urban regions under treatment type 2, returned cases Table 2. The value of mode measurement for the variable of training sets before and after partitioning, K = 3. Before partitioning After partitioning The most frequent value (mode) of input factors in training set value (mode) of input factors in cluster value (mode) of input factors in cluster value (mode) of input factors in cluster Gender Male Male Female Male Age 70 25 70 50 Weight 50 50 50 60 Nationality Iranian Iranian Afghani Iranian Area of residence Urban Rural Urban Urban current stay in prison No No No No Case type new new returned new Treatment categories A A B A TB type Pulmonary Pulmonary Extra-Pulmonary Pulmonary Recent TB infection No No yes No Diabetes No No No No HIV No No No suspected Length (Month) 7.07 6.03 19 28.5 Low Body Weight No No No yes Imprisonment No No No suspected IV drug using No No No suspected Risky sex No No No suspected  S. R. N. Kalhori, X.-J. Zeng having had the disease for about 19 months. Here, being immigrants, long term affection, returned, extra-pul- monary cases and treatment category B might be associated in medical knowledge terms. In the third cluster, the most repetitive conditions are related to middle-aged Iranian men, who have pulmonary TB and live in urban re- gions and are suspected to have had unprotected sex, taken drugs or be HIV, IV positive. Typically those people who have these features are involved with TB in longer duration resulting in the outcome of quitting treatment which is the case here as well. Due to the high association of HIV, IV drug, unprotected sex as social related risk factors, it is fairly obvious that partitioning these cases together is the enormous success for k-mean algorithm leading to classification accuracy. ISULM method has affected all of six applied classifiers’ accuracy positively. The algorithm of every supervised learning has been fed by clustered sets; In other words, in the process of in- put-output mapping, here, similar objects in a clusters have been applied to produce the given output and model development. Apparently, more consistent objects in separated segments might result in less misclassified pre- diction defined by any of applied classification algorithms. To sum up, this work demonstrates an integrated use of unsupervised and supervised machine learning tech- niques to improve the accuracy of six applied classifiers which intend to predict the outcome of tuberculosis treatment course. The main mechanism of the methodology is partitioning of a TB patients’ database suggested by k-mean clustering, followed by supervised learning of each cluster and their combination. This procedure is of iterative nature and the best result came for 3-clusster based models with improved accuracy in all six applied classification algorithms. Acknowledgements We acknowledge the Iranian Ministry of Health and Medical Education for data access. Also a great thank goes to Dr. Mahshid Nasehi for her medical advice and help which made the data access possible. References [1] Kotsiantis, S.B. (2007) Supervised Machine Learning: A Review Of Classification Techniques. Informatica, 31, 249- 268. [2] Niakan Kalhori, R.S. (2013) Evaluation and Comparison of Different Machine Learning Methods to Predict Outcome of Tuberculosis Treatment Course. Journal of Intelligent Learning Systems and Applications, 5, 10 p. [3] Alpaydin, E. (2004) Introduction to Machine Learning. 1th Edition, The MIT Press, Cambridge. [4] Niakan Kalhori, R.S. (2011) Integrated Supervised and Unsupervised Learning Method to Predict the Outcome of Tu- berculosis Treatment Course. Ph.D. Thesis, The University of Manchester. [5] Pao, Y. and Sobajic, D.J. (1992) Combined Use of Unsupervised and Supervised Learning for Dynamic Security As- sessment. Transactions on Power Systems, 7, 878-884. [6] Šmuc, T., Gamberger, D. and Krstacic, G. (2001) Combining Unsupervised and Supervised Machine Learning in Analysis of the CHD Patient Database. The American Invitational Mathematics Examination, 109-112. [7] Boudour, M. and Hellal, A. (2005) Combined Use of Supervised and Unsupervised Learning for Power System Dy- namic Security Mapping. Engineering Applications of Artificial Intelligence, 18, 673-683. [8] Han, J. and Kambe r, M. (2006) Data Mining: Concepts and Techniques. 2nd Edition, Morgan Kaufman Publishers, USA.
|