J. Biomedical Science and Engineering, 2009, 2, 177-183
Published Online June 2009 in SciRes. http://www.scirp.org/journal/jbise
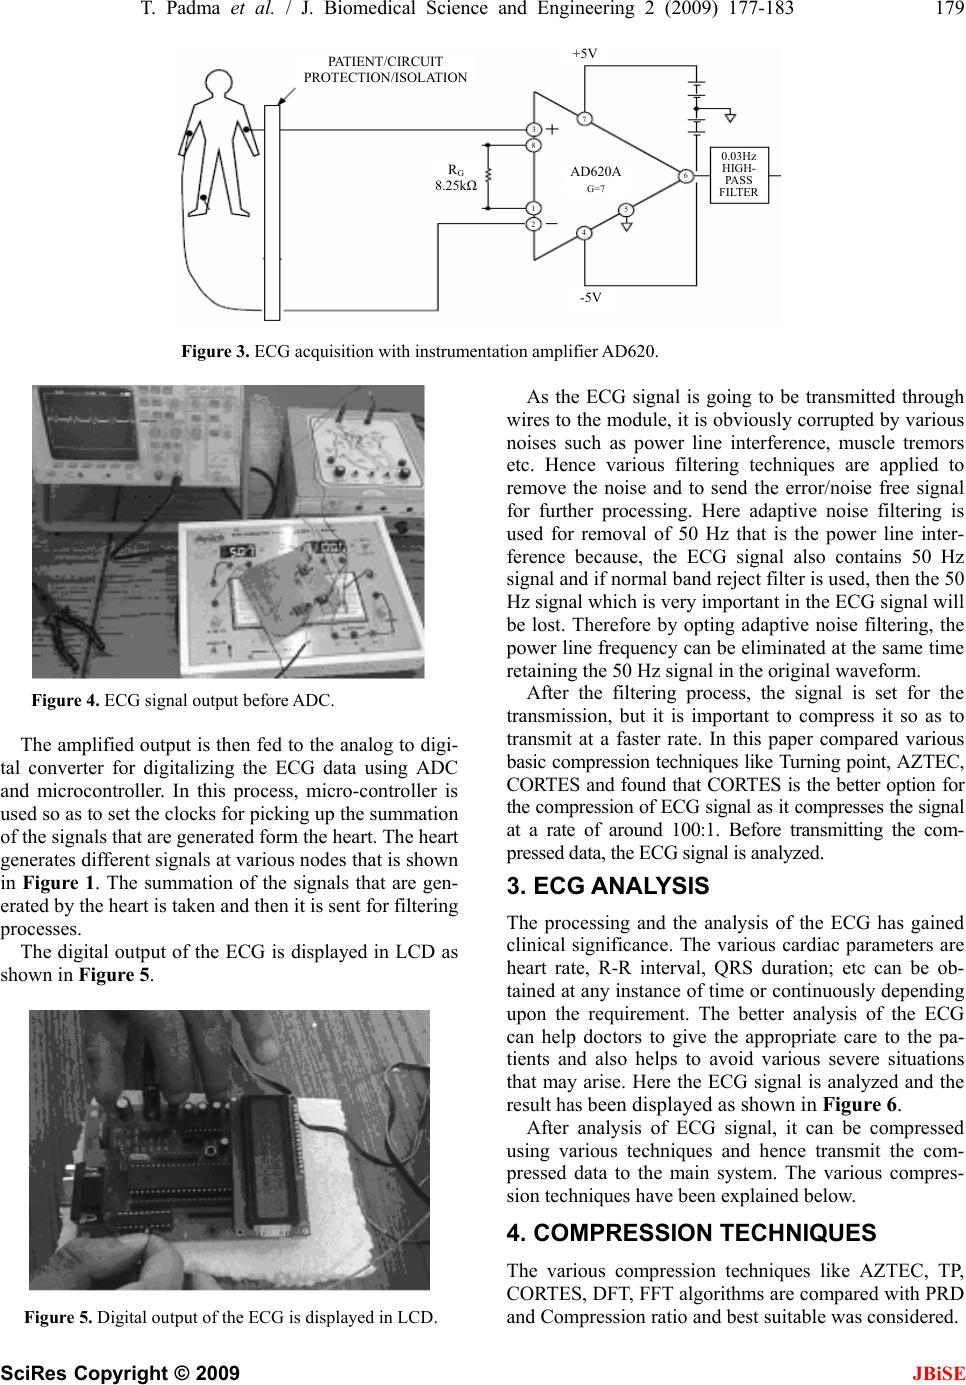
JBiSE
ECG compression and labview implementation
Tatiparti Padma1, M. Madhavi Latha2, Abrar Ahmed3
1GRIET, JNTU, Hyderabad, India, Member IETE; 2JNTU, Hyderabad, India, Member IEEE; 3GRIET, Hyderabad, India.
Email: tatipartipadma@gmail.com
Received 11 February 2009; revised 19 March 2009; accepted 25 March 2009.
ABSTRACT
It is often very difficult for the patient to tell the
difference between angina symptoms and heart
attack symptoms, so it is very important to
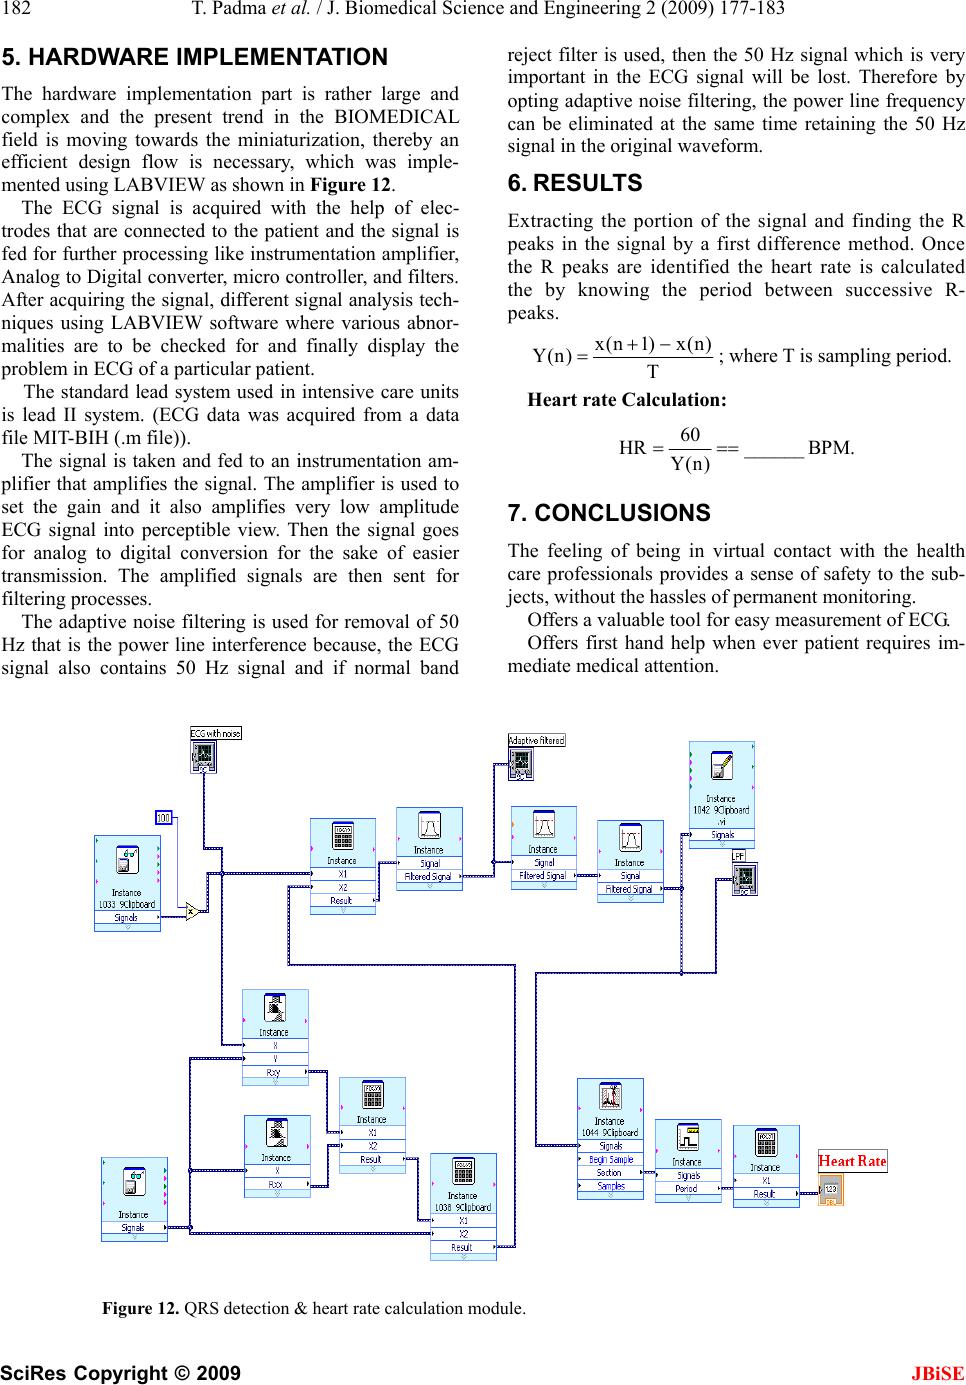
recognize the signs of heart attack and immedi-
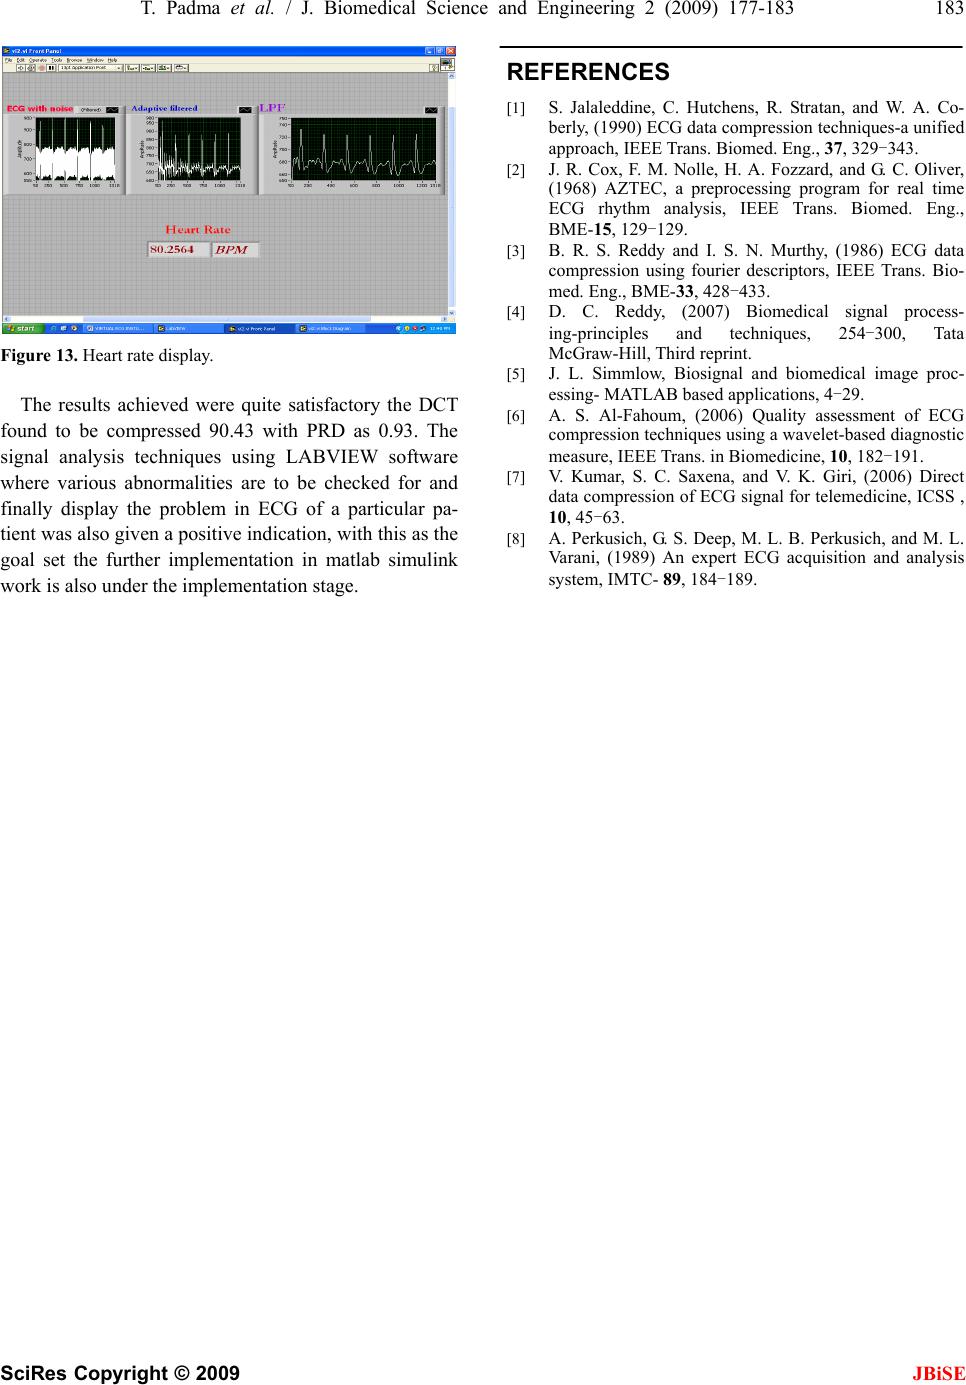
ately seek medical attention. A practical case of
this type of remote consultation is examined in
this paper. To deal with the huge amount of
electrocardiogram (ECG) data for analysis,
storage and transmission; an efficient ECG
compression technique is needed to reduce the
amount of data as much as possible while pre-
serving the clinical significant signal for cardiac
diagnosis. Here the ECG signal is analyzed for
various parameters such as heart rate,
QRS-width, etc. Then the various parameters
and the compressed signal can be transmitted
with less channel capacity. Comparison of
various ECG compression techniques like
TURNING POINT, AZTEC, CORTES, FFT and
DCT it was found that DCT is the best suitable
compression technique with compression ratio
of about 100:1. In addition, different techniques
are available for implementation of hardware
components for signal pickup the virtual im-
plementation with labview is also used for
analysis of various cardiac parameters and to
identify the abnormalities like Tachycardia,
Bradycardia, AV Block, etc. Both hardware and
virtual implementation are also detailed in this
context.
Keywords: ECG Compression; Labview; Imple-
mentation
1. INTRODUCTION
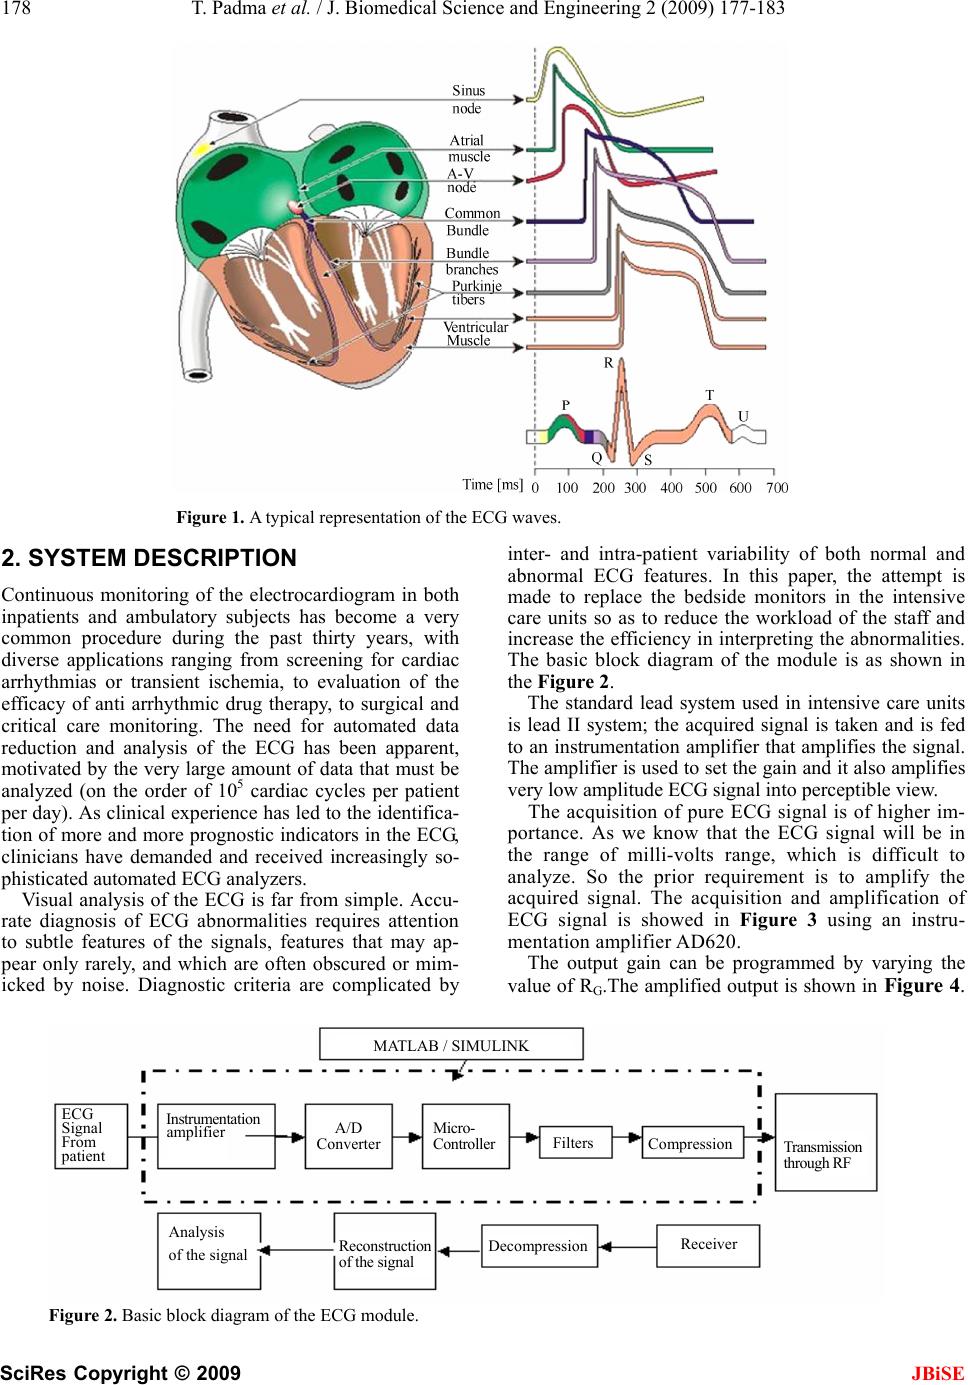
An electrocardiogram (ECG or EKG) is a recording of
the electrical activity of the heart over time produced by
an electrocardiograph. Electrical impulses in the heart
originate in the sinoatrial node and travel through the
heart muscle where they impart electrical initiation of
systole or contraction of the heart. The electrical waves
can be measured at selectively placed electrodes (elec-
trical contacts) on the skin. Electrodes on different sides
of the heart measure the activity of different parts of the
heart muscle. An ECG displays the voltage between
pairs of these electrodes, and the muscle activity that
they measure, from different directions, also understood
as vectors. After acquiring the signal, different signal
analysis techniques using MATLAB software where
various abnormalities can be traced out in ECG of a par-
ticular patient. The signal is then transmitted using wire-
less technology using Blue-Tooth as a transmitting tech-
nique. The device operates at a range of 100-150m, a
distance that is ideal for use in a hospital.
Digital analysis of electrocardiogram (ECG) signal
imposes a practical requirement that digitized data be
selectively compressed to minimize analysis efforts and
data storage space. Therefore, it is desirable to carry out
data reduction or data compression. Data reduction is
achieved by discarding digitized samples that are not
important for subsequent pattern analysis and rhythm
interpretation. Examples of such data reduction algo-
rithms are: AZTEC, turning point (TP). AZTEC retains
only the samples for which there is sufficient amplitude
change. TP retains points where the signal curves (such
as at the QRS peak) and discards every alternate sample.
The data reduction algorithms are empirically designed
to achieve good reduction without causing significant
distortion error.
Another class of algorithms compresses the data under
mathematically rigorous rules, so that digitized samples
are compressed and recovered under some reversible
mathematical criteria operating under predefined error
limits. This approach has the benefit that the original
signal can be recovered by with a minimum loss of in-
formation.
Einthoven named the waves he observed on the ECG
using five capital letters from the alphabet: P, Q, R, S,
and T. The width of a wave on the horizontal axis repre-
sents a measure of time. The height and depth of a wave
represent a measure of voltage. An upward deflection of
a wave is called positive deflection and a downward
deflection is called negative deflection. A typical repre-
sentation of the ECG waves is presented in the following
Figure 1.
178 T. Padma et al. / J. Biomedical Science and Engineering 2 (2009) 177-183
SciRes Copyright © 2009 JBiSE
Figure 1. A typical representation of the ECG waves.
2. SYSTEM DESCRIPTION
Continuous monitoring of the electrocardiogram in both
inpatients and ambulatory subjects has become a very
common procedure during the past thirty years, with
diverse applications ranging from screening for cardiac
arrhythmias or transient ischemia, to evaluation of the
efficacy of anti arrhythmic drug therapy, to surgical and
critical care monitoring. The need for automated data
reduction and analysis of the ECG has been apparent,
motivated by the very large amount of data that must be
analyzed (on the order of 105 cardiac cycles per patient
per day). As clinical experience has led to the identifica-
tion of more and more prognostic indicators in the ECG,
clinicians have demanded and received increasingly so-
phisticated automated ECG analyzers.
Visual analysis of the ECG is far from simple. Accu-
rate diagnosis of ECG abnormalities requires attention
to subtle features of the signals, features that may ap-
pear only rarely, and which are often obscured or mim-
icked by noise. Diagnostic criteria are complicated by
inter- and intra-patient variability of both normal and
abnormal ECG features. In this paper, the attempt is
made to replace the bedside monitors in the intensive
care units so as to reduce the workload of the staff and
increase the efficiency in interpreting the abnormalities.
The basic block diagram of the module is as shown in
the Figure 2.
The standard lead system used in intensive care units
is lead II system; the acquired signal is taken and is fed
to an instrumentation amplifier that amplifies the signal.
The amplifier is used to set the gain and it also amplifies
very low amplitude ECG signal into perceptible view.
The acquisition of pure ECG signal is of higher im-
portance. As we know that the ECG signal will be in
the range of milli-volts range, which is difficult to
analyze. So the prior requirement is to amplify the
acquired signal. The acquisition and amplification of
ECG signal is showed in Figure 3 using an instru-
mentation amplifier AD620.
The output gain can be programmed by varying the
value of RG.The amplified output is shown in Figure 4.
MATLAB
/
SIMULIN
K
ECG
Signal
From
p
atien
t
Figure 2. Basic block diagram of the ECG module.
amplifie
r
Instrumen
t
ation
A/D
Converter
Micro-
Controller Filters Compression
Transmission
through RF
Analysis Receiver
Decompression
Reconstructio
of the signal
n
of the signal
T. Padma et al. / J. Biomedical Science and Engineering 2 (2009) 177-183 179
SciRes Copyright © 2009 JBiSE
+5V
PATIENT/CIRCUIT
PROTECTION/ISOLATION
7
3
8
0.03Hz
HIGH-
Figure 3. ECG acquisition with instrumentation amplifier AD620.
Figure 4. ECG signal output before ADC.
The amplified output is then fed to the analog to digi-
tal converter for digitalizing the ECG data using ADC
and microcontroller. In this process, micro-controller is
used so as to set the clocks for picking up the summation
of the signals that are generated form the heart. The heart
generates different signals at various nodes that is shown
in Figure 1. The summation of the signals that are gen-
erated by the heart is taken and then it is sent for filtering
processes.
The digital output of the ECG is displayed in LCD as
shown in Figure 5.
Figure 5. Digital output of the ECG is displayed in LCD.
As the ECG signal is going to be transmitted through
wires to the module, it is obviously corrupted by various
noises such as power line interference, muscle tremors
etc. Hence various filtering techniques are applied to
remove the noise and to send the error/noise free signal
for further processing. Here adaptive noise filtering is
used for removal of 50 Hz that is the power line inter-
ference because, the ECG signal also contains 50 Hz
signal and if normal band reject filter is used, then the 50
Hz signal which is very important in the ECG signal will
be lost. Therefore by opting adaptive noise filtering, the
power line frequency can be eliminated at the same time
retaining the 50 Hz signal in the original waveform.
After the filtering process, the signal is set for the
transmission, but it is important to compress it so as to
transmit at a faster rate. In this paper compared various
basic compression techniques like Turning point, AZTEC,
CORTES and found that CORTES is the better option for
the compression of ECG signal as it compresses the signal
at a rate of around 100:1. Before transmitting the com-
pressed data, the ECG signal is analyzed.
3. ECG ANALYSIS
The processing and the analysis of the ECG has gained
clinical significance. The various cardiac parameters are
heart rate, R-R interval, QRS duration; etc can be ob-
tained at any instance of time or continuously depending
upon the requirement. The better analysis of the ECG
can help doctors to give the appropriate care to the pa-
tients and also helps to avoid various severe situations
that may arise. Here the ECG signal is analyzed and the
result has been displayed as shown in Figure 6.
After analysis of ECG signal, it can be compressed
using various techniques and hence transmit the com-
pressed data to the main system. The various compres-
sion techniques have been explained below.
4. COMPRESSION TECHNIQUES
The various compression techniques like AZTEC, TP,
CORTES, DFT, FFT algorithms are compared with PRD
and Compression ratio and best suitable was considered.
-5V
RG
8.25
k
AD620A 6PASS
G=7 FILTER
5
1
2
4
180 T. Padma et al. / J. Biomedical Science and Engineering 2 (2009) 177-183
SciRes Copyright © 2009 JBiSE
Figure 6. ECG analysis output.
4.1. Turning Point Algorithm
1) Acquire the ECG signal
2) Take the first three samples and check for the con-
dition as mentioned below:
(x1-x0)*(x2-x1)<0
(or)
(x1-x0)*(x2-x1)>0
3) If the above condition-1 is correct then x1 is stored
else x2 is stored.
4) Reconstructing the compressed signal.
The compression ratio of Turning point algorithm is
2:1, if higher compression is required then the same al-
gorithm can be implemented on the already compressed
signal so that it is further compressed to a ratio of 4:1.
But after the 2nd compression, the required data in the
signal may be lost since the signal is overlapped on one
another. Therefore, TP algorithm is limited to compres-
sion ratio of 2:1. TP algorithm can be applied on the
Figure 7. Turning point compression analysis.
already compressed data to increase the compression
ratio to 4:1. As shown in Figure 7.
4.2. AZTEC ALGORITHM
Another commonly used technique is known as AZTEC
(Amplitude Zone Time Epoch Coding). This converts
the ECG waveform into plateaus (flat line segments) and
sloping lines. As there may be two consecutive plateaus
at different heights, the reconstructed waveform shows
discontinuities. Even though the AZTEC provides a high
data reduction ratio, the fidelity of the reconstructed
signal is not acceptable to the cardiologist because of the
discontinuity (step-like quantization) that occurs in the
reconstructed ECG waveform. As shown in Figur e 8.
AZTEC Algorithm is implemented in 2 phases:
4.2.1. Horizontal Mode
1) Acquire the ECG signal
2) Assign the first sample to Xmax and Xmin which
represents highest and lowest elevations of the current
line.
3) Check for the following condition and store the
plateau if
a) If X1>Xmax then Xmax =X1 and
b) If X1<Xmi n then Xmin =X1 and so on till Xn samples,
repeat this until the following 2 conditions are
satisfied
the difference between VMAX and VMIN is
greater than a predetermined threshold or
if line length is > 50 are satisfied
4) The stored values are the length L=S-1, where S is
no. of samples and L is length and the average amplitude
of the plateau (VMAX+VMIN)/2.
5) Algorithm starts assigning the next samples to Xmax
and Xmin.
4.2.2. Slope Mode
1) If no. of samples <=3, then the line parameters are
not saved. Instead the algorithm begins to produce
slopes.
Figure 8. AZTEC compression analysis.
T. Padma et al. / J. Biomedical Science and Engineering 2 (2009) 177-183 181
SciRes Copyright © 2009 JBiSE
2) The direction of the slope is determined by check-
ing the following conditions.
a) If (X2 - X1) * (X1 - X0) is +ve then the slope is +ve.
b) If (X2 - X1) * (X1 - X0) is -ve then the slope is -ve.
3) The slope is terminated if the no. of samples is >=3
and if direction of slope is changed.
4.3. CORTES Algorithm
An enhanced method known as CORTES (Coordinate
Reduction Time Encoding System) applies TP to some
portions of the waveform and AZTEC to other portions
and does not suffer from discontinuities. AZTEC line
length threshold Lth, CORTES saves the AZTEC line
otherwise it saves the TP data. As shown in Figure 9.
1) Acquire the ECG signal
2) Define the Vth and Lth.
3) Find the current Maximum and minimum.
4) If the Sample greater than threshold than compare
the length with Lth
5) If (len>lth)
AZTEC Else
TP
6) Plot the compressed signal
4.4. DCT Compression
1) Separate the ECG components into three compo-
nents x, y, z.
2) Find the frequency and time between two samples.
3) Find the dct of ecg signal check for dct coefficients
(before compression)=0, increment the counter A if it is
between +0.22 to -0.22 and assign to Index=0.
4) Check for DCT coefficients(after compression)=0,
increment the Counter B.
5) Calculate inverse dct and plot decompression, error.
6) Calculate the compression ratio, PRD.
As shown in Figure 10.
4.5. FFT Compression
1) Separate the ECG components into three components
x, y, z.
Figure 9. CORTES compression analysis.
mv
sec
Figure 10. DCT compression analysis.
mv
sec
Figure 11. FFT compression analysis.
2) Find the frequency and time between two samples.
3) Find the FFT of ECG signal check for fft coeffi-
cients (before compression) =0, increment the counter A
if it is between +25 to-25 and assign to Index=0.
4) Check for FFT coefficients (after compression) =0,
increment the Counter B.
5) Calculate inverse FFT and plot decompression, error.
6) Calculate the compression ratio, PRD.
As shown in Figure 11.
4.6. Summary
9
Summary of ECG data compression schemes.
The comparison table shown in Table 1 above, details
the resultant compression techniques. This gives the
choice to select the best suitable compression method.
Hence in this project the DCT found to be compressed
90.43 with PRD as 0.93.
Table 1. Comparison of compression techniques.
METHOD COMPRESSION RATIO PRD
CORTES 4.8 3.75
TURNING POINT 5 3.20
AZTEC 10.37 2.42
FFT 89.57 1.16
DCT 90.43 0.93
0100 200300 400500 600 700800 9001000
6
7
8
0100 200300 400500 600 700800 9001000
6
7
8
9
mv
sec
mv
sec
182 T. Padma et al. / J. Biomedical Science and Engineering 2 (2009) 177-183
SciRes Copyright © 2009
5. HARDWARE IMPLEMENTATION reject filter is used, then the 50 Hz signal which is very
important in the ECG signal will be lost. Therefore by
opting adaptive noise filtering, the power line frequency
can be eliminated at the same time retaining the 50 Hz
signal in the original waveform.
The hardware implementation part is rather large and
complex and the present trend in the BIOMEDICAL
field is moving towards the miniaturization, thereby an
efficient design flow is necessary, which was imple-
mented using LABVIEW as shown in Figure 12. 6. RESULTS
The ECG signal is acquired with the help of elec-
trodes that are connected to the patient and the signal is
fed for further processing like instrumentation amplifier,
Analog to Digital converter, micro controller, and filters.
After acquiring the signal, different signal analysis tech-
niques using LABVIEW software where various abnor-
malities are to be checked for and finally display the
problem in ECG of a particular patient.
Extracting the portion of the signal and finding the R
peaks in the signal by a first difference method. Once
the R peaks are identified the heart rate is calculated
the by knowing the period between successive R-
peaks.
x(n 1)x(n)
Y(n) T

; where T is sampling period.
The standard lead system used in intensive care units
is lead II system. (ECG data was acquired from a data
file MIT-BIH (.m file)).
Heart rate Calculation:
60
HR______ BPM.
Y(n)

The signal is taken and fed to an instrumentation am-
plifier that amplifies the signal. The amplifier is used to
set the gain and it also amplifies very low amplitude
ECG signal into perceptible view. Then the signal goes
for analog to digital conversion for the sake of easier
transmission. The amplified signals are then sent for
filtering processes.
7. CONCLUSIONS
The feeling of being in virtual contact with the health
care professionals provides a sense of safety to the sub-
jects, without the hassles of permanent monitoring.
Offers a valuable tool for easy measurement of ECG.
The adaptive noise filtering is used for removal of 50
Hz that is the power line interference because, the ECG
signal also contains 50 Hz signal and if normal band
Offers first hand help when ever patient requires im-
mediate medical attention.
Figure 12. QRS detection & heart rate calculation module.
JBiSE
T. Padma et al. / J. Biomedical Science and Engineering 2 (2009) 177-183 183
SciRes Copyright © 2009 JBiSE
Figure 13. Heart rate display.
The results achieved were quite satisfactory the DCT
found to be compressed 90.43 with PRD as 0.93. The
signal analysis techniques using LABVIEW software
where various abnormalities are to be checked for and
finally display the problem in ECG of a particular pa-
tient was also given a positive indication, with this as the
goal set the further implementation in matlab simulink
work is also under the implementation stage.
REFERENCES
[1] S. Jalaleddine, C. Hutchens, R. Stratan, and W. A. Co-
berly, (1990) ECG data compression techniques-a unified
approach, IEEE Trans. Biomed. Eng., 37, 329-343.
[2] J. R. Cox, F. M. Nolle, H. A. Fozzard, and G. C. Oliver,
(1968) AZTEC, a preprocessing program for real time
ECG rhythm analysis, IEEE Trans. Biomed. Eng.,
BME-15, 129-129.
[3] B. R. S. Reddy and I. S. N. Murthy, (1986) ECG data
compression using fourier descriptors, IEEE Trans. Bio-
med. Eng., BME-33, 428-433.
[4] D. C. Reddy, (2007) Biomedical signal process-
ing-principles and techniques, 254-300, Tata
McGraw-Hill, Third reprint.
[5] J. L. Simmlow, Biosignal and biomedical image proc-
essing- MATLAB based applications, 4-29.
[6] A. S. Al-Fahoum, (2006) Quality assessment of ECG
compression techniques using a wavelet-based diagnostic
measure, IEEE Trans. in Biomedicine, 10, 182-191.
[7] V. Kumar, S. C. Saxena, and V. K. Giri, (2006) Direct
data compression of ECG signal for telemedicine, ICSS ,
10, 45-63.
[8] A. Perkusich, G. S. Deep, M. L. B. Perkusich, and M. L.
Varani, (1989) An expert ECG acquisition and analysis
system, IMTC- 89, 184-189.