Materials Sciences and Applicatio ns, 2011, 2, 284-287
doi:10.4236/msa.2011.24037 Published Online April 2011 (http://www.scirp.org/journal/msa)
Copyright © 2011 SciRes. MSA
Temperature Dependent Luminescence Spectra of
Synthetic and Natural Alexandrite (BeAl2O4:Cr3+)
1Neilo Marcos Trindade, 2Américo Tabata, 2Rosa Maria Fernandes Scalvi,
2Luis Vicente de Andrade Scalvi*
1Anhanguera Educacional, Sorocaba, Brazil
2UNESP- State University of São Paulo (D ept. Phy sics - FC), Bauru, Brazil
E-mail: scalvi@fc.unesp.br
Receives July 16th, 2010; revised October 11th, 2010; accepted March 15th, 2011.
ABSTRACT
Results of photoluminescen ce measurements for natural and synth etic alexandrite (BeAl2O4:Cr3+) are pre sented, wher e
the samples are excited by the 488 nm line of an Ar+ laser, at different temperatures. The main issu e is the analysis of
the Cr3+ transition in the chrysoberyl matrix (BeAl2O4), with major technological application as active media for laser
action. Results indicate anomalous behavior of Cr3+ transition depending on the measurement temperature. A simple
model to explain the phenomena is suggested.
Keywords: Alexandrite, Luminescence, Cr3+ Transitions, Optical Absorption
1. Introduction
The use of alexandrite as an active media for laser action,
with emission in the range 700 - 800 nm [1], has ap-
peared for the first time in 1978 [2]. Since then, this ma-
terial became technologically important. Recently, many
reports show wide application of the alexandrite laser, in
medicine as well as for atmospheric studies [3,4].
Alexandrite structure may be visualized as approxi-
mately hexagonal close packed (hcp), with unit cell of
four molecules, with eight Al3+ ions, occupying distorted
octahedral sites and four Be2+ ions, occupying distorted
tetrahedral sites, formed by oxygen located at plans per-
pendicular to c axis. The distortion from a perfect hcp
structure of oxygen ions give birth to the appearing of
two sites of distinct symmetries: Al1, located at inversion
sites and Al2, located at mirror sites [5,6]. Cr3+ ions are
incorporated in the octahedral of reflection and inversion
symmetries and may be denoted by and , re-
spectively.
3+
s
Cr 3+
i
Cr
The octahedrally coordinated Al2 site is supposed to be
larger when compared to Al1, which can be explained by
the length of the bond Al-O (1.938 Å), which is longer
than for Al1 (1.890 Å), resulting on a larger polyhedral
volume [7]. The Al2 site, due to its lager size, is preferen-
tially occupied by Cr3+ ions, and then it is responsible for
the optical properties of alexandrite [8]. Then, sions
are characterized by a high probability of electric dipole
transition. The magnetic dipole transitions of the
3+
Cr
3+
Cr
3+
Cr
i
do not contribute significantly to the optical absorption
and emission of this material. Besides, they are excluded
from the laser process, equilibrating or reducing the ex-
citation energy of sions [5]. Then, the ra tio of s
and i concentrations become a determinant parame-
ter for the alexandrite optical efficiency. EPR measure-
ments indicate that, in general, the Cr3+ ion enters in the
BeAl2O4 lattice in a ratio of about 75% of Al2 and 25%
of Al1, for the natural sample as well as for synthetic
material, showing variations depending on the relative
quantity of Cr2O3 in the sample [9].
3+
Cr
3+
Cr
In the luminescence spectra, the s lines are called
R1 and R2, and the lines of i are called S1 and S2. As
experimentally observed [6], the R lines show up pre-
cisely in the same wavelength, 680.4 and 678.5 nm, re-
spectively, at room temperature, in both spectra: optical
absorption and emission. In the emission spectra, the
lines S1 and S2 show up around 695.8 and 689.9 nm and
in the absorption spectra they are seen as narrow lines at
655.7, 649.3 and 645.2 nm [10,11].
3+
Cr
3+
Cr
2. Experimental
Alexandrite stones come from Minas Gerais state in Bra-
zil, and show a dark green color, due to the presence of
clusters. Samples have been cut such that parallel plans
between the faces were provided, leading to an average
Temperature Dependent Iuminescence Spectra of Synthetic and Natural Alexandrite (BeAlO:Cr3+) 285
2 4
thickness of 1.5 mm. The synthetic sample has been
grown by H. P. Jenssen and R. Morris (from Allied Sig-
nal Inc, U.S.A.), by the Czochralsky method as men-
tioned elsewhere [6]. The thickness is 2.3 mm and show
perfectly parallel faces.
For luminescence excitation it is used an Ar+ laser
tuned at 2.51 eVh
. In the excitation system, the
laser beam is irradiated through a chopper, being redi-
rected to the sample, which is placed inside a closed cy-
cle He cryostat. The emitted light from the sample (pho-
toluminescence) is sent to a spectrophotometer coupled
to a germanium detector, where the electrical signal is
amplified by a lock-in amplifier, linked to a computer
which controls the spectrophotometer and collects the
obtained data.
3. Results and Discussion
Figure 1 shows the Luminescence spectra for the syn-
thetic alexandrite sample measured at several tempera-
tures. Fig ure 1(a) evidences the lines R, and Figure 1(b),
lines S. Below room temperature, the luminescence
spectra is dominated by the R lines of individual Cr ions
and the S lines, originated from exchange-coupled pairs
of chromium ions [11].
The luminescence of R and S lines points towards a
dependency with the measurement temperature, as can be
observed in Figures 1(a) and 1(b), for the synthetic sam-
ple.
In Figure 1(a), the relative intensity of lines, R1
and R2, present always the same behavior, with the in-
tensity of line R1 being higher than for line R2, and the
difference between them decreases with temperature. As
the temperature is raised, the line R1 has an intensity de-
crease, whereas the line R2 show intensity increase until
135 K. Above this temperature, this line also shows a
gradual intensity decrease. For the lines, S1 and S2,
shown in Figure 1(b), the line S1 is more intense than
line S2. The variation in the intensities of these lines is
explained as an indicative that more then one type of
carrier relaxation mechanism is present [12]. Figure 1(b)
shows that line S1 decreases, whereas line S2 has a slight
intensity increase until about 135 K, and above that a
regular intensity decrease.
3+
s
Cr
3+
i
Cr
The variation in intensities of R lines as well as S lines
for natural alexandrite is shown in Figure 2. The varia-
tion of both lines occurs in a similar way for this sample,
as shown in the photoluminescence spectra of Figures
2(a) and 2(b). In the spectra, it is also possible to observe
that the lines R and S change position, starting from 135
K, shifting to higher wavelengths (lower energy), fol-
lowed by a wavelength broadening of these lines. More-
over, in a comparison of synthetic and natural samples, it
can be noticed that the lines position is practically in the
(a)
(b)
Figure 1. Luminescence spectra for the synthetic alexan-
drite sample as function of temperature. (a) Lines R, (b)
Lines S.
same wavelength.
Considering that either the natural as the synthetic
sample shows the same effect in the intensity of emission
lines measured at different temperatures, the explanation
concerning the behavior of lines R and S, can be done by
analogy. A simple model is proposed and is shown in
Figure 3, where the electron and hole ground states are
represented. Vertical lines stand for radiative transition
and oblique lines represent the electron transfer from an
electronic level to another. t represents the lifetime of the
carrier in the level and is associated with the transition
probability between two levels.
In this model, it is supposed that initially there is no
interaction between electronic levels R and S. Free carri-
ers of a site probably do not interact with the carriers
from another level, and with the associated levels of Cr3+
clusters. Then, the probability that carriers from level R
C
opyright © 2011 SciRes. MSA
Temperature Dependent Iuminescence Spectra of Synthetic and Natural Alexandrite (BeAlO:Cr3+)
286 2 4
(a)
(b)
Figure 2. Luminescence spectra for natural sample as func-
tion of temperature (a) Lines R and (b) Lines S.
are transferred to level S and vice-versa is very low, as
well as from levels R or S to the levels associated with
Cr3+ clusters.
Then, at low temperature, electrons excited by optical
pumping lose energy by phonon emission (lattice vibra-
tion) and are trapped by levels R and S. Then, they re-
combine with holes from the ground state, generating the
lines R1, R2, S1 and S2. With the temperature increase, as
the intensity of lines R1 and S1 decrease due to interac-
tion between electrons and phonons, the emission associ-
ated to lines R2 and S2 show inverse behavior, and pre-
sent intensity increase. This behavior is observed until
135 K. Above that temperature, the intensities decrease
due to the electron-phonon coupling. This behavior is
explained as follows: as the temperature is increased,
some R1 carriers are excited back to R2. This is possible
if the lifetime t21 is long enough for the excitation or at
Figure 3. Diagram representing the transfer ratio between
emission levels and lifetime (t).
least of the same order of magnitude of t41, the lifetime
for excitation back of carriers from R1 to R2. On the other
hand, if the lifetime t31 is longer than t11, the carriers in
R2 tend to recombine radiatively with holes in the ground
state instead of finishing in the R1 level, making the
emission intensity associated with R2 to increase. With
higher temperature increase, more carriers in R1 will gain
energy to populate R2, and then, the intensity grows with
the temperature increase. However, above 135 K, the
electron-phonon coupling becomes very strong and the
relaxation via phonons (non-radiative) becomes domi-
nant. In this case, the intensity of lines R1 in the photo-
luminescence spectra decreases. The same process may
be applied to the tran sition involving S levels.
We have observed that it leads to some interesting
variation in the luminescence dependency with tempera-
ture. Lines R and S remains fixed at their wavelengths
until about 135 K, where a peak shift takes place to
higher wavelengths (lower energy), followed by a wave-
length broadening of theses lines, shown in the emission
spectra. This peak shift is as sociated with the increase of
the alexandrite unit cell with temperature.
The luminescence spectra also allow analyzing the dif-
ference between wavelengths of emission lines in these
samples, as can be seen in Table 1.
It can be verified in Table 1 that the wavelength sepa-
ration between S lines is about three times larger than the
Table 1. R1, R2, S1 and S2 lines position and separation (
)
between these lines at room temperature, for synthetic and
natural alexandrite samples.
Sample R2 (nm) R1 (nm) S2 (nm) S1 (nm)
Synthetic 678.5 680.3 689.9 695.7
1.8
5.8

Natural 678.5 680.3 689.9 695.8
1.8
 5.9

C
opyright © 2011 SciRes. MSA
Temperature Dependent Iuminescence Spectra of Synthetic and Natural Alexandrite (BeAl2O4:Cr3+)
Copyright © 2011 SciRes. MSA
287
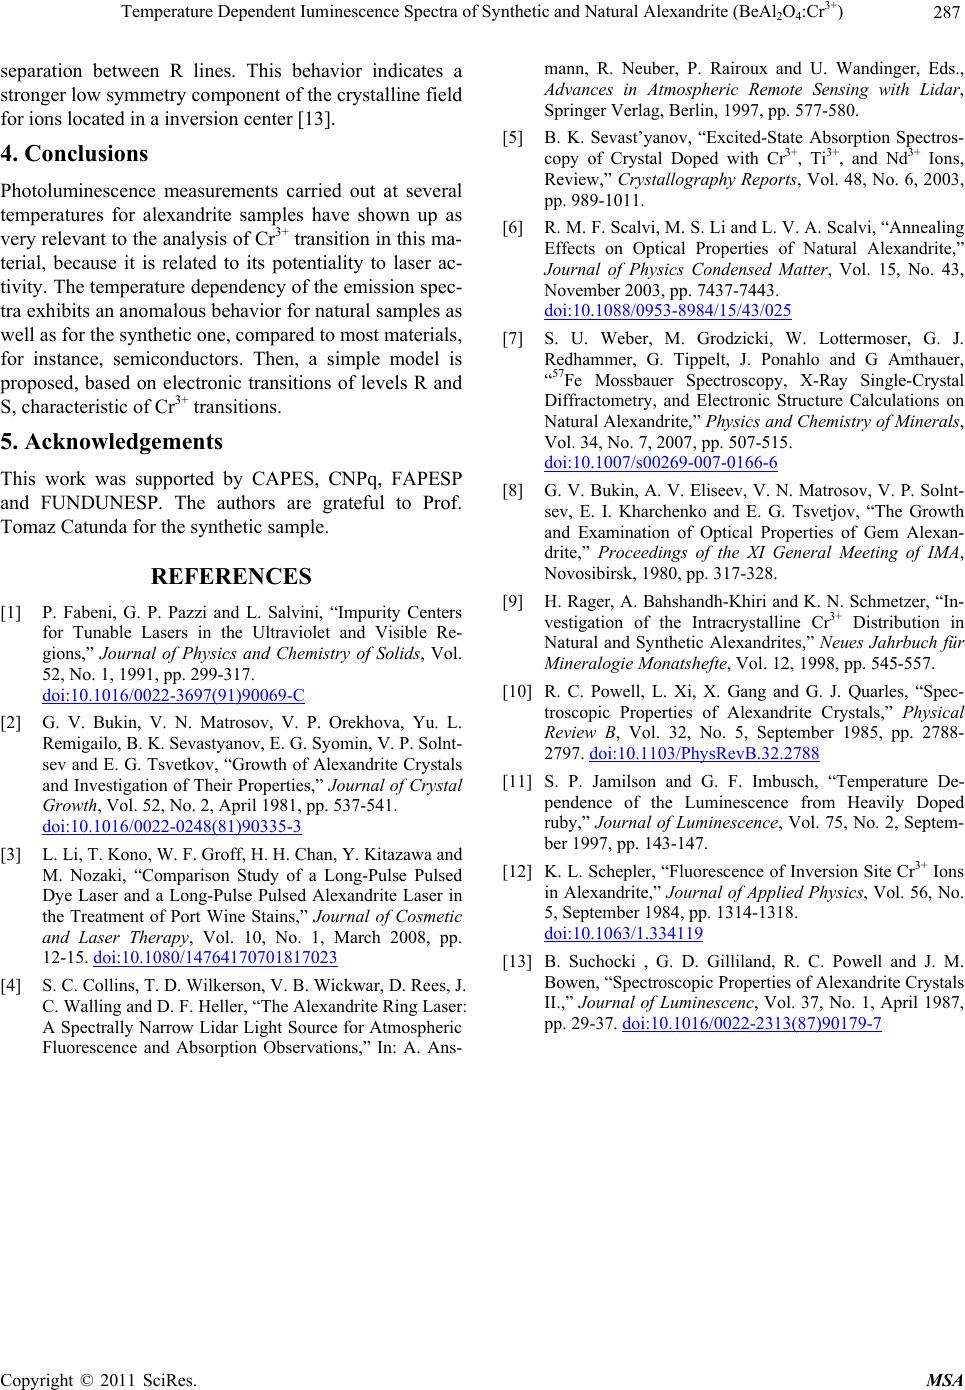
separation between R lines. This behavior indicates a
stronger low symmetry component of the crystalline field
for ions located in a inversion center [13].
4. Conclusions
Photoluminescence measurements carried out at several
temperatures for alexandrite samples have shown up as
very relevant to the analysis of Cr3+ transition in this ma-
terial, because it is related to its potentiality to laser ac-
tivity. The temperature dependency of the emission spec-
tra exhibits an anomalous behavior for natural samples as
well as for the synthetic one, compared to most materials,
for instance, semiconductors. Then, a simple model is
proposed, based on electronic transitions of levels R and
S, characteristic of Cr3+ transitions.
5. Acknowledgements
This work was supported by CAPES, CNPq, FAPESP
and FUNDUNESP. The authors are grateful to Prof.
Tomaz Catunda for the synthetic sample.
REFERENCES
[1] P. Fabeni, G. P. Pazzi and L. Salvini, “Impurity Centers
for Tunable Lasers in the Ultraviolet and Visible Re-
gions,” Journal of Physics and Chemistry of Solids, Vol.
52, No. 1, 1991, pp. 299-317.
doi:10.1016/0022-3697(91)90069-C
[2] G. V. Bukin, V. N. Matrosov, V. P. Orekhova, Yu. L.
Remigailo, B. K. Sevastyanov, E. G. Syomin, V. P. Solnt-
sev and E. G. Tsvetkov, “Growth of Alexandrite Crystals
and Investigation of Their Properties,” Journal of Crystal
Growth, Vol. 52, No. 2, April 1981, pp. 537-541.
doi:10.1016/0022-0248(81)90335-3
[3] L. Li, T. Kono, W. F. Groff, H. H. Chan, Y. Kitazawa and
M. Nozaki, “Comparison Study of a Long-Pulse Pulsed
Dye Laser and a Long-Pulse Pulsed Alexandrite Laser in
the Treatment of Port Wine Stains,” Journal of Cosmetic
and Laser Therapy, Vol. 10, No. 1, March 2008, pp.
12-15. doi:10.1080/14764170701817023
[4] S. C. Collins, T. D. Wilkerson, V. B. Wickwar, D. Rees, J.
C. Walling and D. F. Heller, “The Alexandrite Ring Laser:
A Spectrally Narrow Lidar Light Source for Atmospheric
Fluorescence and Absorption Observations,” In: A. Ans-
mann, R. Neuber, P. Rairoux and U. Wandinger, Eds.,
Advances in Atmospheric Remote Sensing with Lidar,
Springer Verlag, Berlin, 1997, pp. 577-580.
[5] B. K. Sevast’yanov, “Excited-State Absorption Spectros-
copy of Crystal Doped with Cr3+, Ti3+, and Nd3+ Ions,
Review,” Crystallography Reports, Vol. 48, No. 6, 2003,
pp. 989-1011.
[6] R. M. F. Scalvi, M. S. Li and L. V. A. Scalvi, “Annealing
Effects on Optical Properties of Natural Alexandrite,”
Journal of Physics Condensed Matter, Vol. 15, No. 43,
November 2003, pp. 7437-7443.
doi:10.1088/0953-8984/15/43/025
[7] S. U. Weber, M. Grodzicki, W. Lottermoser, G. J.
Redhammer, G. Tippelt, J. Ponahlo and G Amthauer,
57Fe Mossbauer Spectroscopy, X-Ray Single-Crystal
Diffractometry, and Electronic Structure Calculations on
Natural Alexandrite,” Physics and Chemistry of Minerals,
Vol. 34, No. 7, 2007, pp. 507-515.
doi:10.1007/s00269-007-0166-6
[8] G. V. Bukin, A. V. Eliseev, V. N. Matrosov, V. P. Solnt-
sev, E. I. Kharchenko and E. G. Tsvetjov, “The Growth
and Examination of Optical Properties of Gem Alexan-
drite,” Proceedings of the XI General Meeting of IMA,
Novosibirsk, 1980, pp. 317-328.
[9] H. Rager, A. Bahshandh-Khiri and K. N. Schmetzer, “In-
vestigation of the Intracrystalline Cr3+ Distribution in
Natural and Synthetic Alexandrites,” Neues Jahrbuch für
Mineralogie Monatshefte, Vol. 12, 1998, pp. 545-557.
[10] R. C. Powell, L. Xi, X. Gang and G. J. Quarles, “Spec-
troscopic Properties of Alexandrite Crystals,” Physical
Review B, Vol. 32, No. 5, September 1985, pp. 2788-
2797. doi:10.1103/PhysRevB.32.2788
[11] S. P. Jamilson and G. F. Imbusch, “Temperature De-
pendence of the Luminescence from Heavily Doped
ruby,” Journal of Luminescence, Vol. 75, No. 2, Septem-
ber 1997, pp. 143-147.
[12] K. L. Schepler, “Fluorescence of Inversion Site Cr3+ Ions
in Alexandrit e,” Journal of Applied Physics, Vol. 56, No.
5, September 1984, pp. 1314-1318.
doi:10.1063/1.334119
[13] B. Suchocki , G. D. Gilliland, R. C. Powell and J. M.
Bowen, “Spectroscopic Properties of Alexandrite Crystals
II.,” Journal of Luminescenc, Vol. 37, No. 1, April 1987,
pp. 29-37. doi:10.1016/0022-2313(87)90179-7