Journal of Environmental Protection, 2011, 2, 186-193
doi:10.4236/jep.2011.22021 Published Online April 2011 (http://www.SciRP.org/journal/jep)
Copyright © 2011 SciRes. JEP
Correlation of Asthma Symptoms with Prevalence
of Indoor NO2 Concentration in Kuwait
Fawaz S. Al-Anzi, Ayed A. Salman
College of Engineering and Petroleum, Kuwait University, Kuwait, Kuwait.
Email: Fawaz.AlAnzi@ku.edu.kw, Ayed@eng.kuniv.edu.kw
Received November 27th, 2010; revised January 8th, 2011; accepted February 24th, 2011.
ABSTRACT
The research literature provides strong evidence that characteristics of buildings and their indoor environments influ-
ence the prevalence of several adverse health effects. Kuwait is considered one of the countries with harshest weather
conditions. It is estimated that Kuwaitis spend most of their times indoors. Indoor environments quality should be taken
seriously since indoor allergens and irritants can play a significant role in determining the health of households. In this
research we propose to profile synergistic interaction between morbidity differentials and air quality in Kuwait resi-
dential area. The objective of this project is to investigate the relation between indoors air quality and asthma symp-
toms. Data mining techniques are employed to discover the correlation between indoor air quality measures and
asthma symptoms and trigger. The main trigger considered in this research is the concentration of nitrogen dioxide.
Some other triggers investigated are dust mites, smoking and others.
Keywords: Asthma, Indoor Air Quality, Data mining, Correlation
1. Introduction
Collecting real environment data about Kuwait is con-
sidered one of the most important tasks in developing a
suitable environment. This is especially true when such
data can be used in solving actual problems related to
population health. Asthma is considered one of the
common Sick Building Syndrome symptoms. Kuwait is
considered one of the countries with harshest weather
conditions. It is estimated that Kuwaitis spend most of
their times indoors. Indoor environment quality should
be taken seriously since indoor allergens and irritants can
play a significant role in determining the health of
households. It is important to recognize potential asthma
triggers in the indoor environment and reduce exposure
to those triggers. Some of most common indoor asthma
triggers include secondhand smoke, dust mites, mold,
cockroaches and other pests, household pets and com-
bustion byproducts. Indoors, nitrogen dioxide (NO2) can
be a byproduct of fuel burning appliances, such as gas
stoves, gas or oil furnaces, fireplaces, and gas space hea-
ters. For outdoors, nitrogen dioxide can produced by in-
ternal and external combustion vehicles, desalination
plants, recycling centers, waste burning facilities and
furnaces, factories and petrochemical facilities. Data
mining advanced techniques will be used to process and
extract useful, hidden rules and relationships from the
data that we will collect.
Data mining is successfully utilized in many situations
where a better insight is required to make a better deci-
sion. In this project, we used the data mining software,
Weka and the different data mining algorithms in it to
make high quality decisions to determine whether Nitro-
gen Dioxide affects asthma patients.
2. Literature Review
2.1. Literature Review about Asthma
In [1] asthma is a multifactor disease that is likely to be
the result of interactions between a genetically deter-
mined predisposition to allergic diseases and environ-
mental factors that serve to enhance allergic inflamma-
tion and target inflammation to the lower airway.
In [2] The Expert Panel of the National Asthma Edu-
cation and Prevention defined asthma as a chronic in-
flammatory disorder of the airways, in which many cells
and cellular elements play a role, in particular mast cells,
eosinophils and, T-lymphocytes, neutrophils, and epithe-
lial cells.
In [3] Asthma may present in all age groups, but most
studies suggest that the majority of patients’ asthma will
present before puberty. Asthma is the most common
Correlation of Asthma Symptoms with Prevalence of Indoor NO Concentration in Kuwait187
2
chronic medical condition affecting children. The in-
crease in case of childhood asthma is of critical health
concern because the onset of asthma in children is par-
ticular debilitating. Although with some children, symp-
toms will decrease in adulthood, approximately 50% will
continue to be affected throughout their life. The effects
of asthma on children and adolescent social role function,
including children’s ability to play, participate in school
activities, and construct meaningful social and family
relationships, are important to consider in accounting for
the overall burden of this disease.
In [4-11] it is shown that people spend approximately
90% of their time indoors, where the levels of some pol-
lutants often are higher than they are outdoors. Indoor
pollutants that can trigger asthma include house dust,
environmental tobacco smoke, pet dander, incenses, and
molds.
2.2. Asthma and Studies Done in Kuwait
There have been a number of studies done on respiratory
problems in Kuwait in the aftermath of the burning of oil
wells in Kuwait after the first Gulf war. Subsequently,
Kuwait also participated in the International Study of
Asthma and Allergies in Childhood [12-15]. Recently,
there has been increased interest in the effect of indoor
allergens on asthma. Studies have been carried out on the
effect of moulds and pets on asthma patients.
2.3. Asthma Triggers
Some of the most common indoor asthma triggers in-
clude secondhand smoke, dust mites, mold, cockroaches
and other pests, household pets, and combustion by-
products. The following are a brief description of each
asthma trigger.
1) Secondhand Smoke
Secondhand smoke is a mixture of smoke from the
burning end of a cigarette, pipe or cigar and the smoke
exhaled by the smoker that is often found in homes and
cars where smoking is allowed.
2) Dust Mites
Dust mites are too small to be seen, but can be found
in almost every home in mattresses and bedding materi-
als, carpets, upholstered furniture, stuffed toys and cur-
tains.
3) Mold
Mold can grow indoors when mould spores land on
wet or damp surfaces. In the home, mold is most com-
monly found in the bathroom, kitchen and basement.
4) Cockroaches and Other Pests
Cockroach body parts, secretions and droppings, and
the urine, droppings and saliva of pests, such as rodents,
are often found in areas where food and water are pre-
sent.
5) Warm-Blooded Pets (Such as Cats and Dogs)
Pets skin flakes, urine and saliva can be found in
homes where pets are allowed inside.
6) Nitrogen Dioxide
Nitrogen Dioxide can be a byproduct of indoor fuel-
burning appliances, such as gas stoves, gas or oil fur-
naces, fireplaces, wood stoves and unvented kerosene or
gas space heaters. NO2 is an odorless gas that can irritate
your eyes, nose and throat and cause shortness of breath.
In people with asthma, exposure to low levels of NO2
may cause increased bronchial reactivity and make
young children more susceptible to respiratory infections.
Long-term exposure to high levels of NO2 can lead to
chronic bronchitis.
The Environmental Protection Agency uses its Air
Quality Index to provide general information to the pub-
lic about air quality and associated health effects. An Air
Quality Index (AQI) of 100 for any pollutant corresponds
to the level needed to violate the federal health standard
for that pollutant.
For nitrogen dioxide, an AQI of 100 corresponds
0.053 parts per million (averaged over 24 hours) - the
current federal standard. Short-term health effects for
NO2 do not occur until index values are above 200;
therefore, an AQI value is not calculated below 201 for
NO2. An index value of 201 for NO2 corresponds to an
NO2 level of 0.65 parts per million (averaged over 24
hours). As shown in Table 1 as below, the EPA Air
Quality Index, Levels of Health Concentration and Cau-
tionary Statements are as follows:
Table 1. EPA Quality Index.
EPA Air
Quality IndexLevels of Health
Concern
Cautionary
Statements
0 - 50 Good None
51 - 100 Moderate None
101 - 150 Unhealthy for
Sensitive Groups None
151 - 200 Unhealthy None
201 - 300 Very Unhealthy
Children and people
with respiratory
disease, such as
asthma, should limit
heavy outdoor
exertion.
301 – 500 Hazardous
Children and people
with respiratory
disease, such as
asthma, should limit
moderate or heavy
outdoor exertion.
Copyright © 2011 SciRes. JEP
Correlation of Asthma Symptoms with Prevalence of Indoor NO Concentration in Kuwait
188 2
3. Waikato Environment for Knowledge
Analysis – Weka
The Weka workbench is a common research tool con-
sisting of state-of-the-art machine learning algorithms
and data processing tools. It is flexible allowing a variety
of methods to be applied on the datasets easily. Weka is
developed at the University of Waikato in New Zealand.
“Weka” stands for the Waikato Environment for Knowl-
edge Analysis. The system is written in Java, an object
oriented programming language that is widely available
for all major computer platforms, and Weka has been
tested under Linux, Windows, and Macintosh operating
systems. Java allows us to provide a uniform interface to
many different learning algorithms, along with methods
for pre- and post-processing and for evaluating the result
of learning schemes on any given dataset.
There are several different levels at which Weka can
be used. First of all, it provides implementations of state-
of-the-art learning algorithms, it also includes a variety
of tools for transforming datasets. By Weka we can pre-
process a dataset, feed it into a learning scheme, and
analyze the resulting classifier and its performance, all
without writing any program code at all. The most im-
portant resource for navigating through the software is
the online documentation, which has been automatically
generated from the source code and concisely reflects its
structure. It is very helpful because it is the only com-
plete list of available algorithms and it is always up to
date.
One way of using the workbench is to apply a learning
method to a dataset and analyze its output to extract in-
formation about the data. Another is to apply several
learners and compare their performance in order to
choose one for prediction. Weka contains methods such
as classification, clustering, association rule mining and
attribute selection.
4. Asthma and NO2 Project
4.1. Scope of the Problem
This project aims at identifying the correlation of the
concentration of nitrogen dioxide and Asthma symptoms
in Kuwait. To achieve this goal, a number of steps were
performed. A set of real data from asthma patients in
Kuwait was collected. The data was cleaned and errors
were eliminated to obtain only the interesting and rele-
vant data. Once such data was identified, it was tested
using data mining techniques to prove the effect of ni-
trogen dioxide on asthma patients.
4.2. Sample Size Determination
If x is used as estimate of m, we can be 100(1 α) per-
cent confidant that the error E = |x m| will not exceed a
specified amount of error E when the sample size is
2
2
z
nE



The more reliable the sample, the lower the value of
STD will be and the narrower the confidence interval
will be. The research has shown that it is seldom neces-
sary to sample more than 10% of the population to obtain
adequate confidence (if the population is above 1000).
The research also indicates that confidence intervals nar-
row sharply when very small sample size are increased,
up to about 100 respondents [17,18].
This means that the maximum practical size of a sam-
ple has absolutely nothing to do with the sample size of
the population if it is many times greater than the sample.
Hence, we targeted 80 houses distributed through Ku-
wait.
5. Implementation of Asthma Project
The following are the phases of the project implementa-
tion.
5.1. Phase I: Data Collection
The first phase of this project was data collection. A tar-
get of data of 40 asthma patients and 40 non-patients
distributed throughout Kuwait was set and a 7 - page
questionnaire was designed in Arabic to collect data
about the various habits and indoor living conditions of
the asthma patents. To collect this data, we needed ad-
dresses of 40 patients and 40 non-patients. An official
letter was sent from Kuwait University to the Ministry of
Health requesting residential data of asthma patients but
no response came from the ministry for several months.
After this we decided to collect data directly from the
patients in form of a survey. We now needed 80 persons
who voluntarily agreed to take part in this study. To col-
lect the residential addresses of the patients, the follow-
ing three methods were utilized:
1) Data Collection through Private Hospitals and
Clinics:
Twelve Private Hospitals and Clinics dealing with
asthma patients and located across different areas of
Kuwait were identified. Official letters giving details of
this survey were prepared and sent by fax as well as local
courier to these medical centers. This action was fol-
lowed up by phone contact for further explanation of the
survey. A few clinics responded positively. A consent
form was designed and sent to these clinics to be filled
by the patients. This consent form stated that the patients
were ready to take part in this survey voluntarily and
would allow university personnel to enter their homes to
measure indoor NO2 gas levels. It was also used to record
Copyright © 2011 SciRes. JEP
Correlation of Asthma Symptoms with Prevalence of Indoor NO2 Concentration in Kuwait
Copyright © 2011 SciRes. JEP
189
the address and phone numbers of the patients.
2) Data Collection thro ugh Website:
For data collection directly by the patients on a web-
site was created giving details of the survey and request-
ing voluntary participation and residential address entry
from the website.
3) Data Collection thr ou gh Personal Contacts :
Three volunteers were recruited among the university
students. They worked through personal contacts and
word of mouth publicity to motivate patients to take part
in this survey.
Out of the above three methods, the 3rd one generated
the maximum interest, and the response from the first
two methods was very low. This was reported to be due
to reluctance on patient’s part on allowing strangers in-
side their houses to measure the gaseous data. After con-
tinuous and sustained effort, the data from residences of
80 persons were collected.
A total of 4 monitors were used in the measurement of
NO2 levels inside residential premises. Out of these two
were Q-RAE PLUS Four-Gas Monitors and two were
iTX Multi Gas Monitors.
5.2. Phase II: Data Cleansing
In the data cleansing process, we excluded some attrib-
utes because data of these attributes was missing in most
of survey forms. The attributes that we selected after
cleaning the data are the following:
NO2
Carpet
Smokers
Incense
Coal_Kind
Kitchen_Inside_Home
Heat_Kind
Nearest_Industrial_Area,
Nearest_distance_MainRoad
A total of 80 survey forms – 40 asthma & 40 non
asthma households were obtained. The following (Table
2) is a summary of the survey forms.
Table 2. Summary of the survey forms.
Attribute Asthma Forms
(out of 40)
Non-Asthma Forms
(out of 40)
Total No Blank
(out of 80)
Percentage
Blank
Amicable animals (Pets) 28 33 61 76.25%
Oven Trademark & Country of make 39 27 66 82.5%
Last time oven Maintenance done 1 0 1 1.25%
Distance to main road 4 0 4 5%
Nearest Industrial Area distance 4 0 4 5%
No of times windows opened 13 2 15 18.75%
Cars ( full detail ) 9 0 9 11.25%
Leave Car ON in garage & number of minutes a car left O N 9 0 9 11.25%
Park Cars Inside 1 0 1 1.25%
Age of Carpet 6 0 6 7.5%
Age of filled (stuffed) toys 10 0 10 12.5%
Years in same work 2 0 2 2.5%
Hours drive car 2 0 2 2.5%
Smoky Mist 2 0 2
2.5%
Number of Family Members 1 40 41 51.25%
Number of Asthma Patients in Family 19 0 19 23.75%
Correlation of Asthma Symptoms with Prevalence of Indoor NO Concentration in Kuwait
190 2
5.3. Phase III: Data Processing
In order to process the data, the Weka workbench was
used which is common tool consisting of state-of-the-art
machine learning algorithms and data processing tools.
Weka contains methods such as classification, clustering,
association rule mining and attribute selection. The ones
of interest to this project are classification and attribute
selection [19].
6. Classification
In this section, we outline different classification meth-
ods we used.
6.1. Classifier Subcategories
Classification allows the user to select a learning algo-
rithm, also called a classifier, to be applied to the dataset.
The output can then be analyzed in order to learn more
about the nature of the data. Weka provides a large col-
lection of learning algorithms for users to choose. The
subcategories that we selected for testing are Bayes,
Function, Trees, and Rules.
A comparison between all of the algorithms is made to
check which one gives the best success percentage under
each subcategory and then use these success percentages
to evaluate the different attributes we have in this project.
Along with classification, attribute selection will also
be used. Attribute selection chooses a set of attributes
that most influence the decision making process. It oper-
ates by searching the space of attributes and evaluating
the attributes. In Weka, an attribute evaluator must be
specified along with a search method. The attribute eva-
luator to be used is the Correlation-based Feature selec-
tion, which is provided in Weka under the name CfsSub-
setEval. This algorithm calculates the predictive ability
of each attribute and the relationship with others. It then
picks those that identify the different classes best and
have the least inter-relationship. The search method used
is Genetic search which is a simple genetic algorithm that
uses parameters like population size and probabilities of
crossover.
6.2. Test Options
To evaluate the performance of each classifier, the per-
centage of correctly classified instances was used. Weka
provides a number of test options, the ones used are test-
ing using two sets: percentage split, and the cross valida-
tion technique. The first strategy allows the user to split
data into a training set and a separate independent test set.
Each set contains data that depends on the percentage the
user entered for splitting. Percentage split 90% will be
used in our project, which means that 90% of the data is
used for training and 10% of the data for testing. For
cross validation, this method reserves a certain amount
for testing and uses the rest for training. This method
requires the user to enter a fixed number of folds before
starting. For example, if 10 is entered, the data is divided
into 10 equal groups and one group is used for testing
while the rest for training. The groups alternate at being
the test set so that all groups are used for testing. There-
fore, the learning procedure is carried out 10 times and
the average of the results is calculated.
Also different random seed value will be used with
both strategies. Random seed value is used to randomize
the dataset before it is split into train and test set.
In this project, these two procedures were used. The
percentage split set procedure and the 10-fold cross vali-
dation. Each algorithm run 10 iterations and the average
was taken.
6.3. Test Details
Classification was performed on the attributes we ob-
tained after cleaning the data. Four different classifica-
tion subcategories were used as mentioned earlier. Clas-
sification was done at first on all the attributes that we
obtained after cleaning the data to compare between the
different algorithms under each subcategory and to check
which algorithm gives best success percentage under
each sub category. In next phase test each trigger was
tested to check its success percentage under the chosen
algorithms. Also each trigger was tested correlated with
nitrogen dioxide to check the effect of nitrogen dioxide
on specific trigger.
6.3.1. Classi fi er Test
The test were performed on data of 80 persons, 40 asth-
ma patients and 40 non asthma patients with following
attributes:
(NO2, Carpet, Smokers, Incense, Kitchen Inside Home,
Heat Kind, Coal Kind, Neatest Industrial Area, Nearest
distance Main Road)
As mentioned earlier, the tests were applied on the da-
ta using 10-fold cross validation strategy and percentage
split 90%. The data of the 80 persons were fed into the
classifier and the algorithms from the 4 subcategories of
classifiers were tested on all the attributes.
By comparing the performance of the algorithms under
the 4 subcategories using both the 10-fold cross valida-
tion and percentage split-90%, results in Table 3 shows
that clearly show that under Bayes category, the best
algorithm performance is Navie Bayes Simple, under
Function category, is Radial Basis Function Network
(RBF Network), under Trees category is Alternating De-
cision Tree (AD Tree) algorithm, and under Rules cate-
gory is Nearest Neighbor Generalized Exemplars (NNge)
algorithm.
Copyright © 2011 SciRes. JEP
Correlation of Asthma Symptoms with Prevalence of Indoor NO Concentration in Kuwait191
2
Table 3. Alogrithms used.
Algorithm Name Cross Validation
Folds 10
Percentage
Split 90%
Bayes Net 71.13 75
Naïve Bayes 73.33 82.33
Naïve Bayes Simple 77.42 80.36
Naïve Bayes Updateable 73.33 82.33
The results above clearly show that nitrogen dioxide
has effect on the other triggers. The success percentage
of any attribute in this project has a higher value when it
is correlated with nitrogen dioxide. This indicates the
importance of the effect of the concentration of nitrogen
dioxide on asthma symptoms, see Table 4.
6.3.2. Classifi cation Test on Selected Attributes
Classification test will be done on selected attributes af-
ter removing three attributes from the list. The attributes
that removed are (Nearest Industrial Area, Nearest Main
Road, and smokers), we believe that Nearest Industrial
Area, and Nearest Main Road effect asthma symptom but
they are removed because in the data that is collected, the
distances of the nearest industrial area and the main road
are far from the houses of the asthma patients. Also for
Smoker trigger, we believe that it has an effect on asthma
patients but it is removed because most of questioners
that we collected are for non smokers’ patients. Classifi-
cation testes will be performed on the following attrib-
utes (NO2, Carpet, Incense, KitchenInsideHome, Coal_
Kind). The results of the 10 iterations tests using cross
validation folds 10 and percentage split 90% are summa-
rized in Table 5.
By comparing the results, it is noticed that the best
success percentage which is 95.75 is obtained by using
RBF Network algorithm.
6.3.3. Attribu te Selection
Attribute selection will also be used to choose the set of
attributes that most influence classification process. The
attribute evaluator used as mentioned earlier is the Cor-
relation-based Feature selection (CfsSubsetEval). The
search methods used is Genetic search and Best First
method. It is noticed that the attribute that is selected by
the selection attribute category using Genetic search and
Best First method is nitrogen dioxide.
7. Conclusions
The goal of this project was to investigate the relation
between indoors concentration of nitrogen dioxide and
asthma symptoms. The goal has been achieved. The clas-
sifier tests performed on 4 subcategories which are Bayes,
Function, Trees, and Rules, selected Navie Bayes Simple,
Table 4. Success percentage of different attributes.
Algorithm Name Cross Validation
Folds 10
Percentage
Split 90%
Conjunctive Rule 75 72.92
Decision Table 70.04 64.58
PART 72.21 77.83
NNge 82.86 75.4
Algorithm Name Cross Validation
Folds 10
Percentage
Split 90%
Logistic 70.63 75.3
Multilayer Perception 71.25 64.5
RBF Network 83.16 87.5
SMO 72.5 77.1
Algorithm Name Cross Validation
Folds 10
Percentage
Split 90%
AD Tree 71.45 69.42
J48 68.45 66.66
Random Forest 69.5 70.58
NB Tree 70.73 68.75
Carpet NO2
Naïve Bayes
Simple
RBF
Network AD TreeNNge
Yes No 62.33 65.57 64.25 55
Yes Yes72.15 78.75 76.39 70
Incense NO2
Naïve Bayes
Simple
RBF
Network AD TreeNNge
Yes No55.2 53 57.5 58.75
Yes Yes75 67.5 69.53 71.3
Smok-
ers NO2
Naïve Bayes
Simple
RBF
Network AD TreeNNge
Yes No 51.22 56 48.7 63.75
Yes Yes70 72.5 67.67 72.5
Heat
Kind NO2
Naïve Bayes
Simple
RBF
Network AD TreeNNge
YesNo57.55 55 51.43 43.75
YesYes73.75 60 62.5 72.5
Coal
Kind NO2 Naïve Bayes
Simple
RBF
Network AD TreeNNge
Yes No 58.75 57.5 54.5 55
Yes Yes 78.75 75 76.25 72.5
Copyright © 2011 SciRes. JEP
Correlation of Asthma Symptoms with Prevalence of Indoor NO Concentration in Kuwait
192 2
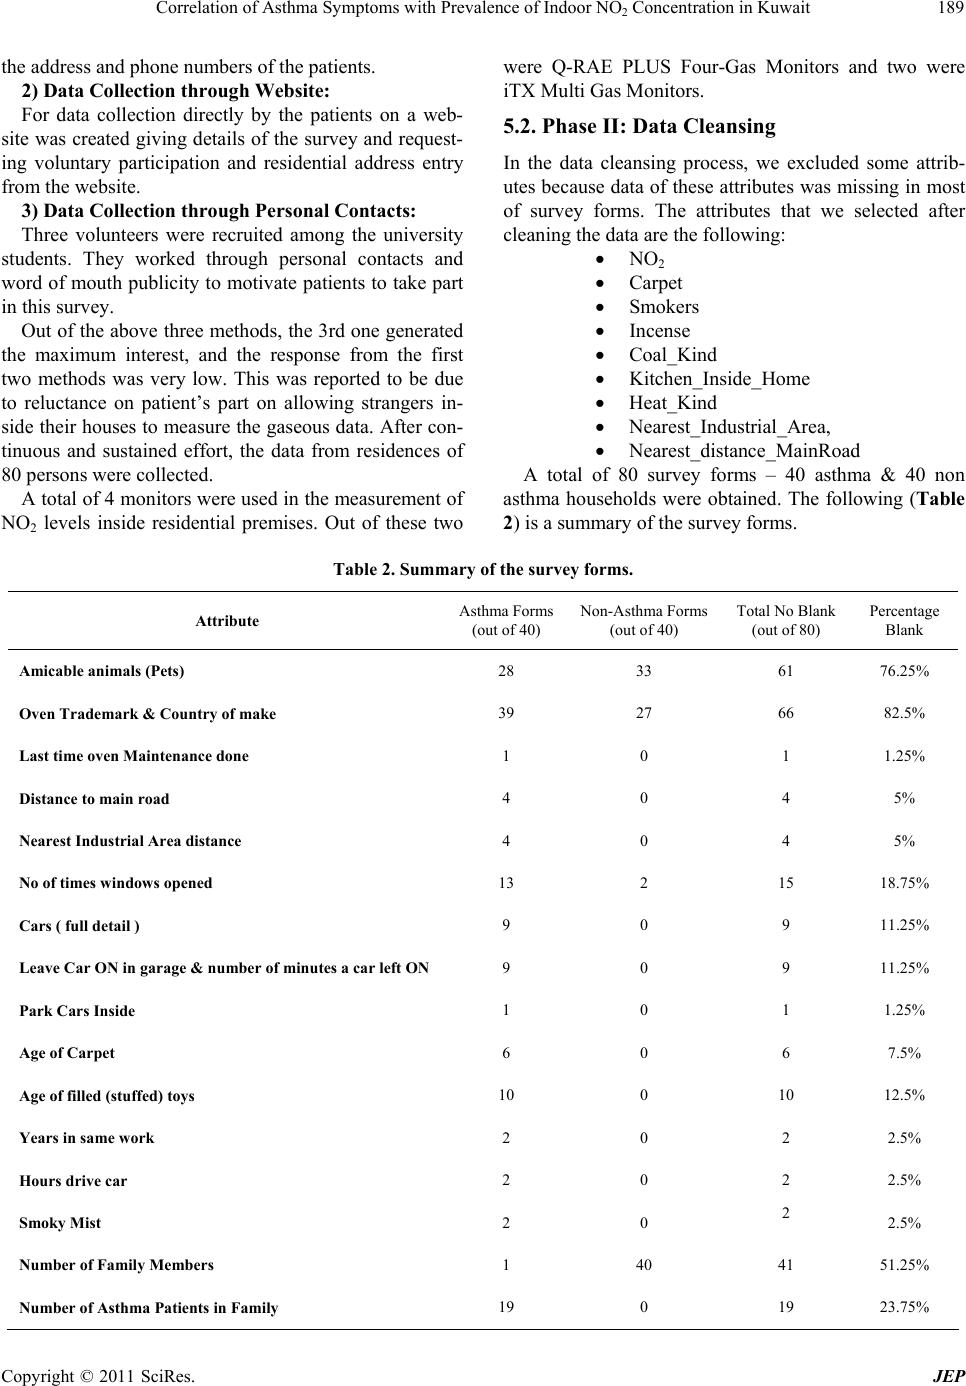
Table 5. Results of 10 iterations tests.
Algorithm_Name Cross Validation
Folds 10
Percentage
Split 90%
Bayes Net 85.6 75
Naïve Bayes 78.75 70.8
Naïve Bayes Simple 79.125 81.32
Naïve Bayes Updateable 78.75 70.8
Algorithm Name Cross Validation
Folds 10
Percentage
Split 90%
Logistic 80.7
90.56
Multilayer Perception 72.29 87.5
RBF Network 78.23 95.75
SMO 72.5 85.25
Algorithm Name Cross Validation
Folds 10
Percentage
Split 90%
AD Tree 74.8 83.66
J48 70.25 62.4
Random Forest 71.8 70.8
NB Tree 73.5 72.9
Algorithm Name Cross Validation
Folds 10
Percentage
Split 90%
Conjunctive Rule 78.1 72.83
Decision Table 77.29 83.26
PART 67.7 60.4
NNge 70.6 68.75
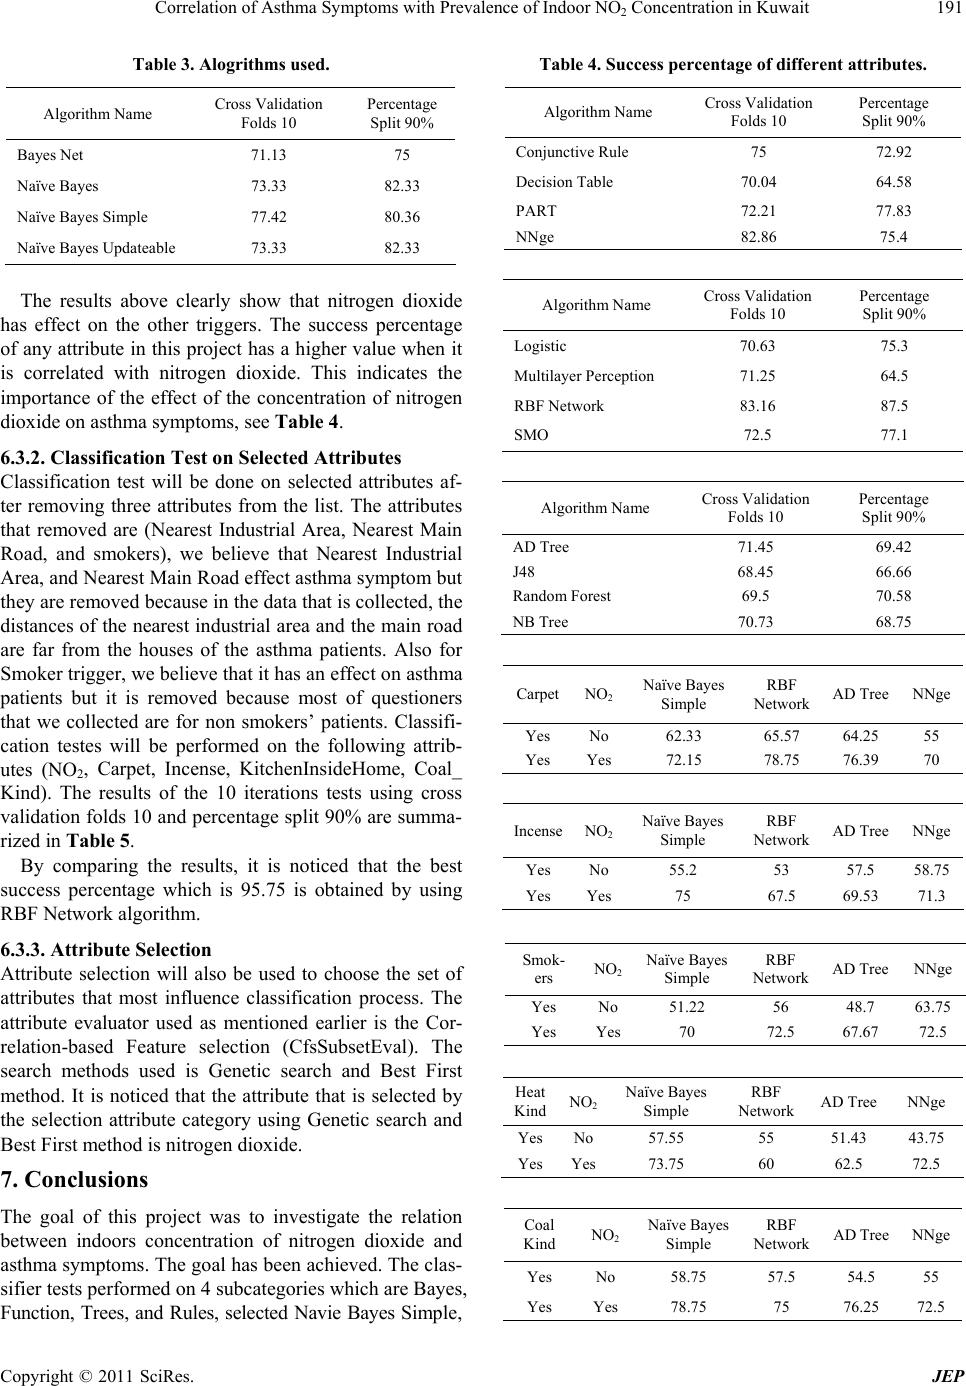
RBF Network, AD Tree, and NNge as the best classifier
algorithms yielding the highest classification correctness
in our project. The classification correctness using 10
fold cross validation for Navie Bayes Simple, RBF Net-
work, AD Tree, and NNge in order was 77.42%, 83.16%,
71.45% and 82.86%. These percentages were obtained
by using all the attributes we have in this project after
applying the data mining cleaning process.
A number of classification tests were done using each
attribute we have in individual and then correlated it with
nitrogen dioxide to compare the success percentages. It
was found that when using any attribute correlated with
nitrogen dioxide always yield to higher percentage than
the success percentage of using individual attribute.
In next phase of tests, some attributes were removed,
and another classification tests were done on the rest of
the attributes. It was noticed that the RBF network has
the best performance over the other algorithms. The per-
centage obtained using this algorithm was 95.75. This
result validates our hypothesis that there is relation be-
tween indoors concentration of nitrogen dioxide and
asthma symptoms. By discovering these facts which
prove the negative effect of such concentrations of nitro-
gen dioxide in Kuwait's environment, we hope to raise
awareness to this issue so suitable action can be taken.
8. Acknowledgements
The authors would like to thank Kuwait Environment
Public Authority for funding this research.
REFERENCES
[1] H. H. Al-Jahdali, A. I. Al-Zahrani, S. T. Al-Otaibi, I. S.
Hassan, M. S. Al-Moamary and A. S. Al-Duhaim, “Per-
ception of the Role of Inhaled Corticosteroid and Factors
Affecting Compliance among Asthmatic Adult Patients,”
Saudi Medical Journal, Vol. 28, No. 3, 2007, pp. 569-
573.
[2] Expert Panel Report 2, “Guidelines for the Diagnosis and
Management of Asthma,” NIH publication, Bethesda,
1997.
[3] “Arizona Air Quality EPA Report,” 2009.
http://ag.arizona.edu/plp/alternaria/ online/asthma.htm,
[4] J. Wever-Hess, J. M. Kouwerberg, E. J. Diverman and A.
M. J. Wever, “Risk Factors for Exacerbations and Hospi-
tal Admissions in Asthma of Early Childhood,” Pediatr
Pulmonol, 2000, Vol. 29, No. 4, pp. 2250-256.
[5] K. Moussa, “Factors Associated with Asthma in School
Children,” European Journal of Epidemiology, Vol. 12,
No. 6, 1996, pp. 583-588. doi:10.1007/BF00499456
[6] “Abu Dhabi Air Quality Monitoring Management Project
Reprot,” 2002.
[7] A. R. Al Frayh, Z. Shakoor, M. O. Gad El Ra and S. M.
Hasnain, “Increased Prevalence of Asthma in Saudi Ara-
bia,” Annals of Allergy, Asthma and Immunology, Vol. 86,
No. 1, 2001, pp. 292-296.
doi:10.1016/S1081-1206(10)63301-7
[8] A. Bush, A. Bener and A. Janahi, “Prevalence of Asthma
among Qatari Schoolchildren,” International Study of
Asthma and Allergies in Childhood, Vol. 41, 2006, pp.
80-86. 1.
[9] N. Groom, “Frankincense and Myrrh: A study of the
Arabian Incense Trade,” Longman, London, 1981.
[10] A. J. Mohammed and L. G. Jasim, “A Relatively High
Prevalence and Severity of Asthma, Allergic Rhinitis and
Atopic Eczema in Schoolchildren in the Sultanate of
Oman,” International Study of Asthma and Allergies in
Childhood, Vol. 8, No. 1, 2003, pp. 69-76.
[11] A. Brebner and E. Norman, “Asthma and Respiratory
Symptoms among School Children in United Arab Emir-
ates,” International Study of Asthma and Allergies in
Childhood, Vol 32, No. 4, 2000, pp. 159-163.
[12] A. AbdAzeem, E. Shareef and J. Al-Momen, “Prevalence
of Asthma, Allergic Rhinitis, and Eczema in 13- to
14-Year-Old Children in Kuwait: An Isaac Study,” In-
ternational Study of Asthma and Allergies in Childhood,
Vol. 85, No. 1, 2000, pp. 58-63.
[13] S. Al-Ali, M. Khan, Z. Hijazi, A. Dowaisan, M. S.
Thomson and J. Georgi, “IgE-Mediated Sensitization to
Copyright © 2011 SciRes. JEP
Correlation of Asthma Symptoms with Prevalence of Indoor NO2 Concentration in Kuwait
Copyright © 2011 SciRes. JEP
193
Mould Allergens among Patients with Allergic Respira-
tory Diseases in a Desert Environment,” C. I. Ezeamuzie,
International Archives of Allergy and Immunology, Vol.
121, No. 4 , 2000, pp 300-307.
[14] A. Al-Mousawi, “Asthma and Sensitization in a Commu-
nity with Low Indoor Allergen Levels and Low
Pet-Keeping Frequency,” Journal of Allergy and Clinical
Inmmunology, Vol. 114 , No. 6 , 2004, pp. 1389-1394.
doi:10.1016/j.jaci.2004.09.005
[15] W. S. Bouhamra and S. A. Abdul-Wahab, “Description of
Outdoor Air Quality in a Typical Residential Area in
Kuwait,” Environmental pollution, Vol. 105, No. 2, 1999,
pp. 221-229. doi:10.1016/S0269-7491(98)00221-8
[16] A. A. Ramadan, A. Khan and S. Al-Hajraf, “Ambient Air
Quality Monitoring in Southern Kuwait,” Ecology and
the Environment, Vol. 101, 2007, pp. 363-372.
[17] P. L. Alreck and R. B. Settle, “The Survey Research
Handbook: Guidelines and Strategies for Conducting a
Survey,” IRWIN Professional Publishing, New York,
1995.
[18] S. C. Albright, W. L. Winston and C. Zappe, “Data
Analysis and Decision Making with Microsoft Excel,”
Duxbury Press, Boston, 2002.
[19] I. H. Witten and E. Frank, “Data Mining: Practical Ma-
chine Learning Tools and Techniques,” 2nd Edition,
Morgan-Kaufman, New York, 2005.