Journal of Environmental Protection, 2011, 2, 162-167
doi:10.4236/jep.2011.22018 Published Online April 2011 (http://www.SciRP.org/journal/jep)
Copyright © 2011 SciRes. JEP
Changes in Temperatures in Okayama Area
Compared with Different Urbanization Areas,
Japan
Noriko Sakano1*, Nobuyuki Miyatake1, Shoko Murakami1, Takeshi Suzue2, Tomohiro Hirao2, Keiki
Ogino3
1Department of Hygiene, Faculty of Medicine, Kagawa University, Kagawa, Japan; 2Department of Public Health, Faculty of
Medicine, Kagawa University, Kagawa, Japan; 3Department of Public Health, Okayama University Graduate School of Medicine,
Dentistry and Pharmaceutical Sciences, Okayama, Japan.
Email: snoriko@med.kagawa-u.ac.jp
Received November 11th, 2010; revised January 10th, 2011; accepted March 1st, 2011.
ABSTRACT
To investigate the changes in temperatures in Okayama area compared with different levels of three urbanization areas
such as Tsuyama, Tokyo areas and Hachijo island in Japan. Data of temperatures in Okayama (1891-2009), Tsuyama
(1943-2009), Tokyo areas (1876-2009) and Hachijo Island (1907-2009) in Japan was obtained from Japan
Meteorological Agency. Changes in temperatures in 4 areas in Japan were analyzed and compared. By using data from
1943 to 2009, some parameters of temperatures were significantly correla ted with years. The change in parameters of
temperatur es in Hachijo Island was calmest among 4 areas. The changes in mean temperature in Augu st and in a year
in Okayama area for 50 years were the highest (August: 1.55˚C, Year: 2.05˚C) among 4 areas. In addition, correlation
coefficient rate between years and the number of days over 35˚C in August in Okayama area was highest (r = 0.407, p
= 0.0037). Parameters of temperatures were gradually increased with years in Okayama area, especially in recent
years. However, those associations were not clearly noted in Hachijo Island. In conclusion, global warming in
Okayama might be accelerated more rapidly than that in Tokyo area in recent 50 years.
Keywords: Temper ature, Global Warmin g, Urbanization, Okayama Area
1. Introduction
Global warming has become a serious issue for human
beings. The Fourth report of the Intergovernmental Panel
on Climate Change (IPCC) at 2007 on climate change has
forecast that global warming will have a major impact on
health conditions [1]. Global average temperatures are
projected to increase between 1.8 and 4.0 °C by the end of
21st century [1]. Heat waves such as Shanghai in 1998 and
Paris in 2003 may be representative of the increases in
short-term climate change events [2-5]. It has also reported
that the levels of atmospheric CO2 concentrations are
increasing since the last century [6,7]. In addition, global
warming has accelerated, and changes in temperatures
were remarkably noted since the 1980s, resulting in
increased numbers of heat related disorder in summer
[8,9].
Most cities show a large heat island phenomenon,
registering 5-11˚C warmer than surrounding rural areas
[10]. On local and regional scales, changes in land cover can
sometimes exacerbate the effect of greenhouse-gas-induced
warming, or even exert the largest impact on climatic
conditions.
We have also previously reported that higher
temperatures were closely linked to higher ambulance
transports in Okayama area, Japan [11]. However, accurate
analysis of warming, whether temperature is actually
increasing in Okayama area and what affects this will
have, remain to be investigated.
The aim of this study was to investigate the current
status of global warming in Okayama. In addition, we
compared various parameters of temperatures between
various areas from the viewpoint of the heat island effects.
2. Methods
2.1. Study Area
Okayama area in Okayama Prefecture is on the southern
Changes in Temperatures in Okayama Area Compared with Different Urbanization Areas, Japan163
shore of Honshu Island. The population of 700 000
people is situated on Okayama area. Currently several
public offices of Chugoku district are located in Okayama
area. Although the surrounds of Okayama area had been
used primarily as paddy fields for agriculture, recently
they have undergone rapid changes, developing into
residential and/or commercial areas (Figure 1).
We selected three areas, Tokyo as the city part area,
and Tsuyama or Hachijo Island as the provinces, for the
analysis in comparison with Okayama city, Japan.
Tsuyama area in Okayama prefecture is on the central
of Chugoku area, Japan. The population of 110 000
people is situated on the Tsuyama area. Tsuyama area
had been used primarily as paddy fields for agriculture
compared to Okayama area (Figure 1).
Tokyo area is the largest metropolitan area in Japan
and its population is about 13.0 million. Tokyo central
(8.8 million population, 621 km2) is located in the center
of the metropolitan area, and is mostly urbanized in
Japan (Figure 1).
Hachijo Island (65.52 km2) is located at the south from
Tokyo area (287 km) and the population of 9 000 people
is situated on the Hachijo Island. Island is affected by the
Kuroshio Current (in an oceanic climate zone) (Figure
1).
2.2. Temperatures
Daily, monthly and annual temperatures in Okayama,
Tsuyama, Tokyo area and Hachijo Island in Japan for the
required periods were obtained from Japan Meteorological
Agency (http://www.data.jma.go.jp/obd/stats/etrn/index.
php, accessed 27 Jan, 2010). Mean temperature in Au-
Tsuyama Area
Tokyo Area
Okayama Area Hachijo Island
Figure 1. Four study areas in Japan. (Craft Map: http://
www.craftmap.box-i.net/map.php, accessed 6 Aug, 2010).
gust, mean temperature in a year, mean of the highest
temperatures in August, mean of the highest temperatures
in a year, mean of the lowest temperatures in August and
mean of the lowest temperatures in a year (Okayama area:
1891~2009, Tsuyama area: 1943~2009, Tokyo area:
1876~2009, Hachijo Island: 1907~2009). The number of
days over the level of various temperatures in August
was also used for analysis (1961~2009).
2.3. Statistical Analysis
Pearson’s correlation analysis by using Statistical
Package of SPSS 12.0J for Windows was performed to
examine the significance of the linear relationship among
continuous variables: p < 0.05 was considered to be
statistically significant. In addition, joinpoint regression
program (National Cancer Institute Joinpoint regression
program, version 3.4.3, http://srab.cancer.gov/joinpoint/,
accessed 18 August, 2010) was also used to investigated
the where the different lines of temperatures are
connected together.
3. Results
Simple correlation analysis by Pearson’s correlation
between years and parameters of temperatures in 4 areas is
summarized in Table 1 . All parameters of temperatures in
Okayama area (1891~2009) were significantly correlated
with years. Tokyo area (1876~2009) also showed
significant relationship between various parameters of
temperatures and years (Table 1 ). In Tsuyama area, some
parameters of temperatures i.e. mean temperature in a
year, mean of the highest temperatures in a year and mean
of the lowest temperatures in a year was significantly
correlated with years.
To adjust the observation period, by using data from
1943 to 2009, we also analyzed the relationship between
various parameters of temperatures and years in 4 areas
(Table 2). In Okayama area, all parameters except mean
of the highest temperatures in August, were also
correlated with years. Mean temperature in a year, mean
of the highest temperatures in a year and mean of the
lowest temperatures in a year were significantly correlated
with years in Tsuyama and Tokyo areas. Mean of the
lowest temperatures in August in Tokyo areas was also
correlated with years. However, no parameters were
correlated with years in Hachijo Island.
Correlation coefficients between various parameters of
temperatures and years in Okayama area were the highest
among 4 areas. From single regression line, positive
change in mean temperature for 50 years was corresponded
to 2.05˚C in Okayama area, Japan (Table 2). However,
the change in temperatures was the lowest in Hachijo
Island among 4 areas. In addition, using single regression
line in Tables 1 and 2, positive changes in temperatures
Copyright © 2011 SciRes. JEP
Changes in Temperatures in Okayama Area Compared with Different Urbanization Areas, Japan
Copyright © 2011 SciRes. JEP
164
for 50 years in Table 2 were higher than those in Table 1
in Okayama area. Therefore, positive changes in
temperatures for 50 years were accelerated in Okayama
area. In Tokyo areas, positive changes in mean
temperature in a year and mean of the lowest temperatures
in a year were also accelerated. However, other parameters
in Tokyo areas and Hachijo Island were not accelerated. In
addition, using joinpoint regression program, we analyzed
the point of change in mean temperature in 4 different
areas. The point of change in mean temperatures in
Tokyo was 1921, that in Okayama was 1973 (Figure 2)
and that in Tsuyama was 1984. However, the point of
change in mean temperature in Hachijo Island was not
noted.
Finally, the relationship between the number of days
of over various temperatures which seem to be related to
heat disorder is pointed out and years was also evaluated
(Table 3). The number of days of over 33˚C and 35˚C in
Okayama area was significantly correlated with years.
Especially correlation coefficient between the number of
days of over 35˚C and years in Okayama area was the
highest (r = 0.407, p = 0.0037) (Fi gure 3).
Table 1. Simple correlation analysis between years and paramete r s of temperature in four areas.
r p Single regression line Changes in temperatures (˚C)
for 50 years
Okayama prefecture
Okayama area (f r om 1891 to 2009)
Mean temperature in August 0.416 < 0.0001y = 0.012x + 3.139 0.60
Mean temperature in a year 0.648 < 0.0001y = 0.015x – 14.969 0.75
Mean of the highest temperatures in August 0.328 0.0003 y = 0.012x + 8.965 0.60
Mean of the highest temperatures in a year 0.668 < 0.0001y = 0.012x – 4.023 0.60
Mean of the lowest temperatures in August 0.518 < 0.0001y = 0.015x – 6.511 0.75
Mean of the lowest temperatures in a year 0.580 < 0.0001y = 0.018x – 24.349 0.90
Tsuyama area (from 1943 to 2009)
Mean temperature in August 0.130 0.2939 y = 0.006x + 14.814 0.30
Mean temperature in a year 0.458 < 0.0001y = 0.014x – 13.598 0.70
Mean of the highest temperatures in August 0.043 0.7299 y = 0.003x + 25.890 0.15
Mean of the highest temperatures in a year 0.447 0.0001 y = 0.014x – 8.107 0.70
Mean of the lowest temperatures in August 0.132 0.2866 y = 0.005x + 11.671 0.25
Mean of the lowest temperatures in a year 0.443 0.0002 y = 0.014x – 18.968 0.70
Tokyo prefecture
Tokyo area (from 1876 to 2009)
Mean temperature in August 0.556 < 0.0001y = 0.018x – 8.853 0.90
Mean temperature in a year 0.887 < 0.0001y = 0.025x – 32.904 1.25
Mean of the highest temperatures in August 0.353 < 0.0001y = 0.013x + 0.6077 0.65
Mean of the highest temperatures in a year 0.728 < 0.0001y = 0.015x – 9.010 0.75
Mean of the lowest temperatures in August 0.714 < 0.0001y = 0.025x – 24.606 1.25
Mean of the lowest temperatures in a year 0.917 < 0.0001y = 0.033x – 53.700 1.65
Hachijo island (from 1907 to 2009)
Mean temperature in August 0.285 0.0036 y = 0.006x + 15.136 0.30
Mean temperature in a year 0.350 0.0003 y = 0.005x + 7.624 0.25
Mean of the highest temperature in August 0.249 0.1111 y = 0.007x + 15.819 0.35
Mean of the highest temperature in a year 0.290 0.0029 y = 0.004x + 12.482 0.20
Mean of the lowest temperature in August 0.364 0.0002 y = 0.008x + 8.178 0.40
Mean of the lowest temperature in a year 0.416 < 0.0001y = 0.008x + 0.379 0.40
Changes in Temperatures in Okayama Area Compared with Different Urbanization Areas, Japan165
Table 2. Simple correlation analysis between years and parameters of temperatures in four areas from 1943 to 2009.
r p Single regression line Changes in temperatures (˚C)
for 50 years
Okayama prefecture
Okayama area
Mean temperature in August 0.554 < 0.0001y = 0.031x – 33.852 1.55
Mean temperature in a year 0.833 < 0.0001y = 0.041x – 65.744 2.05
Mean of the highest temperatures in August 0.223 0.0701 y = 0.014x + 4.996 0.70
Mean of the highest temperatures in a year 0.558 < 0.0001y = 0.018x – 14.764 0.90
Mean of the lowest temperatures in August 0.619 < 0.0001y = 0.035x – 45.840 1.75
Mean of the lowest temperatures in a year 0.811 < 0.0001y = 0.053x – 93.859 2.65
Tsuyama area
Mean temperature in August 0.130 0.2939 y = 0.006x + 14.814 0.30
Mean temperature in a year 0.458 < 0.0001y = 0.014x – 13.598 0.70
Mean of the highest temperatures in August 0.043 0.7299 y = 0.003x + 25.890 0.15
Mean of the highest temperatures in a year 0.447 0.0001 y = 0.014x – 8.107 0.70
Mean of the lowest temperatures in August 0.132 0.2866 y = 0.005x + 11.671 0.25
Mean of the lowest temperatures in a year 0.443 0.0002 y = 0.014x – 18.968 0.70
Tokyo prefecture
Tokyo area
Mean temperature in August 0.233 0.0581 y = 0.013x + 0.841 0.65
Mean temperature in a year 0.825 < 0.0001y = 0.035x – 52.678 1.75
Mean of the highest temperatures in August 0.016 0.8956 y = 0.001x + 33.094 –0.05
Mean of the highest temperatures in a year 0.426 0.0003 y = 0.013x – 5.960 0.65
Mean of the lowest temperatures in August 0.396 0.0009 y = 0.022x – 18.966 1.10
Mean of the lowest temperatures in a year 0.889 < 0.0001y = 0.048x – 82.257 2.40
Hachijo island
Mean temperature in August 0.008 0.9505 y = 0.002x + 26.121 0.01
Mean temperature in a year 0.194 0.1152 y = 0.005x + 9.067 0.25
Mean of the highest temperature in August –0.130 0.2938 y = 0.004x + 38.272 –0.20
Mean of the highest temperature in a year 0.073 0.5565 y = 0.002x + 17.722 0.10
Mean of the lowest temperature in August 0.113 0.3625 y = 0.004x + 17.188 0.20
Mean of the lowest temperature in a year 0.153 0.2175 y = 0.004x + 7.593 0.20
Figure 2. Change point of annual mean temperatures in Okayama, Japan (1891~2009).
Copyright © 2011 SciRes. JEP
Changes in Temperatures in Okayama Area Compared with Different Urbanization Areas, Japan
Copyright © 2011 SciRes. JEP
166
Table 3. Simple correlation analysis between years and number of days over various temperatures in August from 1961 to
2009.
Okayama area Tsuyama area Tokyo area Hachijo island
r p r p r p r p
Number of days over
30˚C 0.071 0.6301 0.053 0.7169 0.016 0.9113 0.118 0.4213
Number of days over
31˚C 0.073 0.6184 0.004 0.9799 0.074 0.6127 0.107 0.4628
Number of days over
32˚C 0.173 0.2346 0.086 0.5552 0.023 0.8731 0.085 0.5637
Number of days over
33˚C 0.343 0.0159 0.069 0.6384 0.077 0.5968 0.058 0.6905
Number of days over
34˚C 0.266 0.0643 0.101 0.4917 0.130 0.3748
Number of days over
35˚C 0.407 0.0037 0.000 0.9978 0.125 0.3929
4. Discussion
We firstly investigated the changes in parameters of
temperatures among 4 different urbanization areas such
as Okayama, Tsuyama, Tokyo areas and Hachijo Island,
Japan. Parameters of temperatures were gradually
increased with years in Okayama area, especially in
recent years. In addition, the change point of 1973 in
mean temperature may be reflected that heat island effect
in Okayama area was remarkably accelerated.
According to the research of Osaka in Japan, the mean
warming rate in Osaka surface air temperature is about
2.0˚C over the period from 1883 to 2006, at least half of
which can be attributed to the urban heat island effects [12].
However, this surface air temperature warming was not as
strong as the ground warming recorded in the subsurface
temperature profiles. Therefore, the anthropo- genic
thermal impacts on the subsurface can be more persistent
and profound than the impacts on the atmosphere.
Figure 3. Simple correlation analysis between the number
of days over 35˚C and years in Okayama area, Japan
(1961~2009).
In some previous reports, the relation between high
temperatures and heat stroke in Japan [16-18]. Nakai et
al. investigated heat-related deaths in Japan from 1968
through 1994 and heat-related deaths were most prone to
occur on days with a peak daily temperature above 38˚C
[16]. In addition, they reported that incidence of heat-
related deaths showed and exponential dependence on
the number of hot days [16]. Piver et al. reported that
heat stroke was associated with prolonged exposures to
higher air temperatures that usually occur in the summer
months of July and August in 1980-1995 in Tokyo.
Residents in Tokyo were also often exposed simultaneously
to high concentrations of air pollutants [17]. Qui et al.
reported that an unusual hot spell in 1999 was followed
by a high mortality rate in Hokkaido, Japan [18]. We
have also previously showed that higher temperatures
were closely linked to ambulance transports in Okayama
area, Japan [11].
Taniguchi et al. reported that subsurface environmental
indicators were evaluated from three points of view i.e.
human activities, climate change, and character of
urbanization and social policies. Heat island effect due to
urbanization creates subsurface thermal contamination in
many cities [13]. Average subsurface temperature profiles
in four Asian cities (Tokyo, Osaka, Seoul and Bangkok)
were compared and analyzed to evaluate the effects of
surface warming [14]. The magnitude of surface warming
is evaluated to be the largest in Tokyo (2.8 ˚C), followed by
Seoul, Osaka and Bangkok. And this observation showed
mean depth of deviation from the regional geothermal
gradient in each urban area may be a useful indicator of the
history of urbanization. The combination of the heat island
effect due to urbanization and global warming on
subsurface temperatures also relates to global ground water
quality issues. This relationship holds because increased
subsurface temper- atures alter the ground water system
chemically and microbiologically [15].
In this study, we compared points of change in mean
temperature among 4 areas, and we found that point of
Changes in Temperatures in Okayama Area Compared with Different Urbanization Areas, Japan167
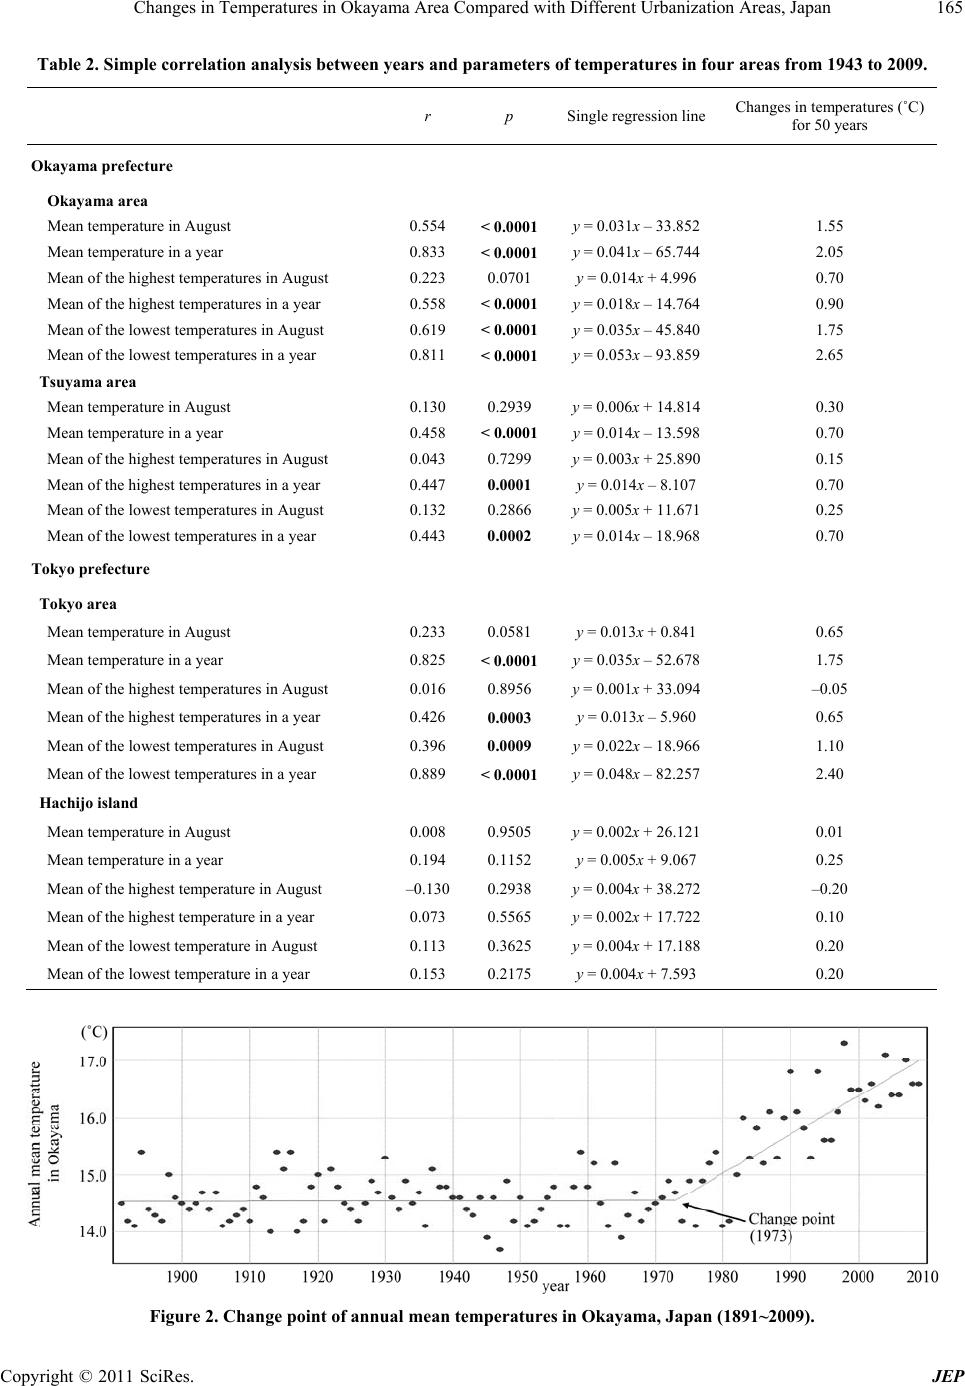
change in mean temperature in Tokyo was 1921, that in
Okayama was 1973 and that in Tsuyama was in 1984.
Therefore, it seems reasonable to suggest that simply
dealing with heat island effect in Okayama area i.e.
innovation of the thermal energy metabolism in cities
and individual coping with high temperatures is urgently
required in Okayama as well as Tokyo area, Japan. In
addition, the point of change in mean temperature may
be good parameter of urbanization in Japan.
Potential limitation still remains in this study. The
changes in parameters of temperatures, which were noted
in 4 areas, may not apply for all areas in Japan. Therefore,
we could not accurately evaluate the changes in
temperatures in Japan. Further studies are required to prove
the changes in temperatures and heat island effect in Japan.
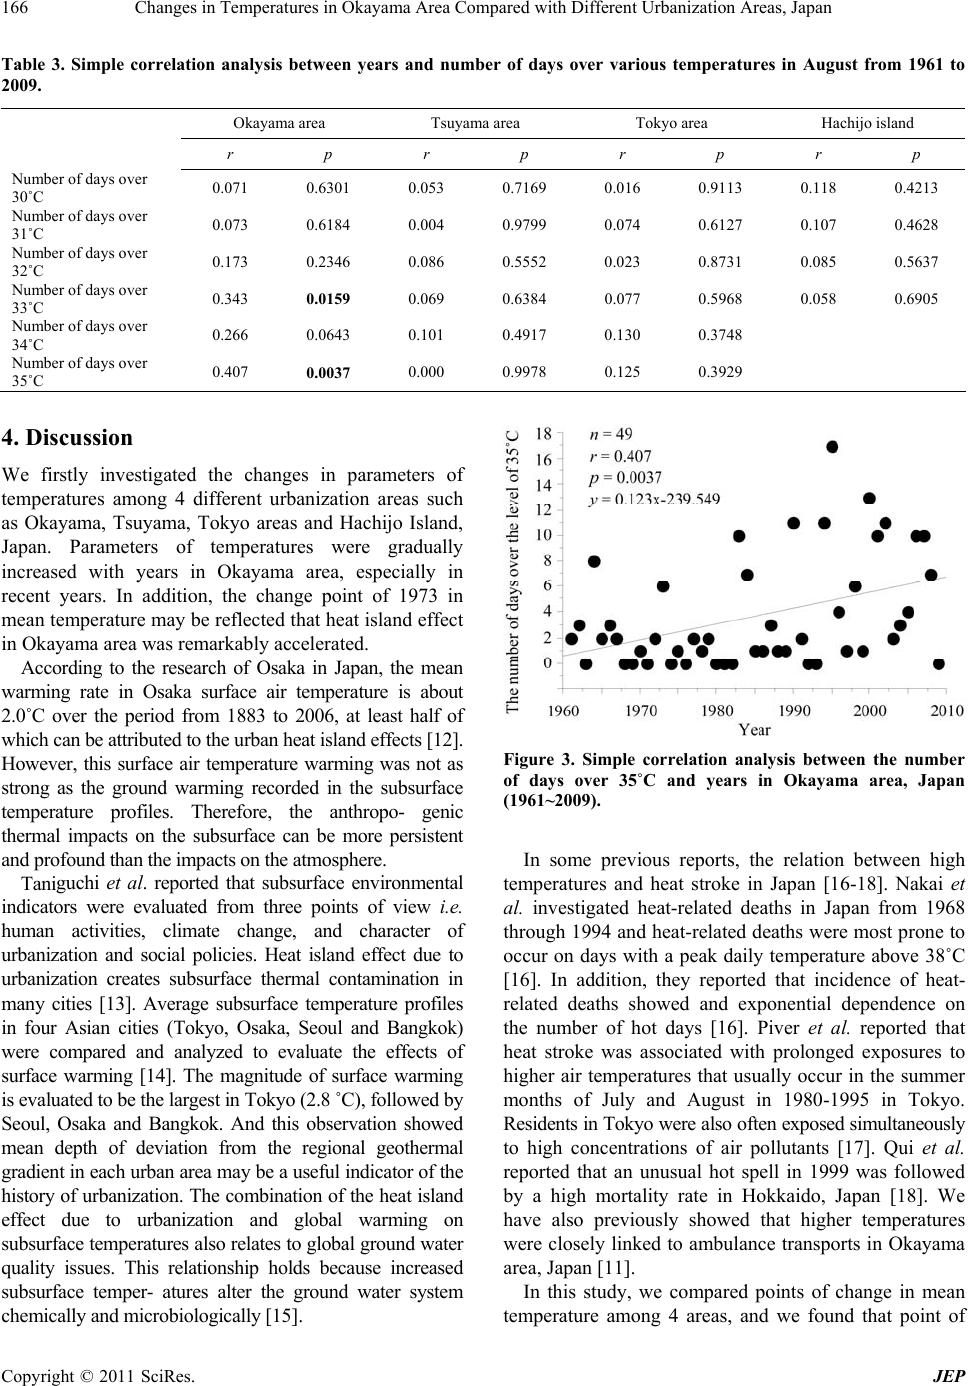
In conclusion, the mean temperature in Okayama area
is rising intentionally higher than that in Tokyo area,
especially in recent years. The number of days of over
33˚C and 35˚C in only Okayama area was significantly
correlated with years.
5. Acknowledgements
We gratefully thank to Mrs. Michiyo Mitani for
assistance of data preparation.
REFERENCES
[1] IPCC, “Climate Change 2007, Fourth Assessment Report
of the Intergovenmental Panel on Climate Change
(IPCC),” Cambridge University Press, Cambridge, 2007.
[2] J. Tan, L. S. Kalkstein, J. Huang, S. Lin, H. Yin and D.
Shao, “An Operational Heat/Health Warning System in
Shanghai,” International Journal of Biometeorology, Vol.
48, No. 3, 2004, pp. 157-162.
doi:10.1007/s00484-003-0193-z
[3] C. Schär, P. L. Vidale, D. Lüthi, C. Frei, C. Häberli, M. A.
Liniger and C. Appenzeller, “The Role of Increasing
Temperature Variability in European Summer Heatwaves,”
Nature, Vol. 427, No. 6972, 2004, pp. 332- 336.
[4] P. A. Stott, D. A. Stone and M. R. Allen, “Human
Contribution to the European Heatwave of 2003,” Nature,
Vol. 432, No. 7017, 2004, pp. 610-614.
doi:10.1038/nature03089
[5] K. E. Smoyer, “A Comparative Analysis of Heat Waves
and Associated Mortality in St. Louis, Missouri – 1980
and 1995,” International Journal of Biometeorology, Vol.
42, No. 1, 1998, pp. 44-50.
doi:10.1007/s004840050082
[6] W. Buermann, B. R. Lintner, C. D. Koven, A. Angert, J.
E. Pinzon, C. J. Tucker, et al., “The Changing Carbon
Cycle at Mauna Loa Observatory,” Proceedings of the
National Academy of Sciences USA, Vol. 104, No. 11,
2007, pp. 4249-4254.
doi:10.1073/pnas.0611224104
[7] D. Lüthi, M. L. Floch, B. Bereiter, T. Blunier, J. M.
Barnola, U. Siegenthaler, D. Raynaud, J. Jouzel, H. Fischer,
K. Kawamura and T. F. Stocker, “High-Resolution Carbon
Dioxide Concentration Record 650 000- 800 000 years
before Present,” Nature, Vol. 453, No. 7193, 2008, pp.
379-382.
[8] C. Schär and G. Jendritzky, “Climate Change: Hot News
from Summer 2003,” Nature, Vol. 432, No. 7017, 2004,
pp. 559-560.
[9] A. Haines and J. A. Patz, “Health Effects of Climate
Change,” JAMA, Vol. 291, No. 1, 2004, pp. 99-103.
doi:10.1001/jama.291.1.99
[10] C. Aniello, K. Morgan, A. Busbey and L. Newland,
“Mapping Micro-Urban Heat Islands Using LANDSAT
TM and a GIS,” Computer Geosciences, Vol. 21, No. 8,
1995, pp. 965-969. doi:10.1016/0098-3004(95)00033-5
[11] N. Sakano, N. Miyatake, T. Suzue, S. Suna, T. Hirao and
K. Ogino, “The Relation between High Temperatures and
Ambulance Transports in Okayama City, Japan,”Journal
of Preventive Medicine, (in Japanese), (in press).
[12] S. Huang, M. Taniguchi, M. Yamano and C. H. Wang,
“Detecting Urbanization Effects on Surface and
Subsurface Thermal Environment a Case Study of
Osaka,” Science of the Total Environment, Vol. 407, No.
9, 2009, pp. 3142-3152.
doi:10.1016/j.scitotenv.2008.04.019
[13] M. Taniguchi, W. C. Burnett and G. D. Ness, “Integrated
Research on Subsurface Environments in Asian Urban
Areas,” Science of the Total Environment, Vol. 404, No.
2-3, 2008, pp. 377-392.
doi:10.1016/j.scitotenv.2008.04.033
[14] M. Taniguchi, T. Uemura and K. Jago-On, “Combined
Effects of Urbanization and Global Warming on
Subsurface Temperature in four Asian Cities,” Vadose
Zone Journal, Vol. 6, No. 3, 2007, pp. 591-596.
doi:10.2136/vzj2006.0094
[15] W. Knorr, I. C. Prentice, J. I. House and E. A. Holland,
“Long-Term Sensitivity of Soil Carbon Turnover to
Warming,” Nature, Vol. 433, No. 7023, 2005, pp. 298-301.
doi:10.1038/nature03226
[16] S. Nakai, T. Itoh and T. Morimoto, “Deaths from
Heat-Stroke in Japan: 1968-1994,” International Journal
of Biometeorology, Vol. 43, No. 3, 1999, pp. 124-127.
doi:10.1007/s004840050127
[17] W. T. Piver, M. Ando, F. Ye and C. J. Portier,
“Temperature and Air Pollution as Risk Factors for Heat
Stroke in Tokyo, July and August 1980-1995,” Environ
Health Perspect, Vol. 107, No. 11, 1999, pp. 911-916.
doi:10.1289/ehp.99107911
[18] D. Qiu, T. Tanihata, H. Aoyama, T. Fujita, Y. Inaba and
M. Minowa, “Relationship between a High Mortality
Rate and Extreme Heat during the Summer of 1999 in
Hokkaido Prefecture, Japan,” Journal of Epidemiolody,
Vol. 12, No. 3, 2002, pp. 254-257.
Copyright © 2011 SciRes. JEP