 Journal of Biomaterials and Nanobiotechnology, 2011, 2, 181-193 doi:10.4236/jbnb.2011.22023 Published Online April 2011 (http://www.scirp.org/journal/jbnb) Copyright © 2011 SciRes. JBNB Structural Rearrangements of Polymeric Insulin-loaded Nanoparticles Interacting with Surface-Supported Model Lipid Membranes Rickard Frost1, Christian Grandfils2, Bernardino Cerda2, Bengt Kasemo1, Sofia Svedhem1* 1Department of Applied Physics, Chalmers University of Technology, Göteborg, Sweden; 2Interfacultary Research Centre of Bioma- terials (CEIB), University of Liège, Liège, Belgium. Email: sofia.svedhem@chalmers.se Received December 22nd, 2010; revised February 15th, 2011; accepted February 18th, 2011. ABSTRACT The design and screening of nanoparticles for therapeutic applications (nanodrugs) belong to an emerging research area, where surface based analytical techniques are promising tools. This study reports on the interaction of electro- statically assembled nanoparticles, developed for non-invasive administration of human insulin, with cell membrane mimics. Interactions between the nanoparticles and differently charged surface-supported model membranes were studied in real-time with the quartz crysta l microbalance with dissipa tion monitoring (QCM-D) technique, in some ex- periments combined with optical reflectometry. Based on the experimental observations, we conclude that structural rearrangements of the nanoparticles occur upon adsorption to negatively charged lipid membranes.The degree of structural changes in the nanoparticles will have important implications for the induced release of the protein drug load. The presented results provide an example of how a surface-based experimental platform can be used to charac- terize the physico-chemical properties of nanosized drug carriers with respect to their interactions at different surfaces. Keywords: Nanoparticle, Human Insulin, Drug Delivery, Supported Lipid Bilayer, QCM-D, Reflectom etry, DLS, Zeta Potential 1. Introduction Nanotechnology based methodologies are important tools for the development of novel drug delivery systems. In particular, model studies using mimics of cell mem- branes, or other biological barriers (e.g. mucus layers or extracellular matrices), will improve our understanding of interactions in the proximity of cells [1]. This is highly relevant for the design of nanoparticles with specific biomedical functions [2]. It is often desired to protect drugs before they reach their site of action and also to minimize adverse systemic effects by targeting of active substances and their local release in a particular tissue or cell [3,4] In the following, we will focus on studies of a nanoparticulate protein drug formulation and its interac- tion with surface supported biomimetic membranes. These membranes are well-defined model systems, which can be controlled and manipulated at the molecu- lar and nano-level with respect to lipid composition [5], morphology [6], as well as with respect to the incorpora- tion of various membrane bound [7] or membrane asso- ciated [8] molecules. These model systems can be used to study the physico-chemical properties of the nanopar- ticles upon exposure to membranes. Due to the wide range of possibilities of the membrane mimics and the multitude of available analytical tools, we believe that supported lipid membranes will be developed into an early screening platform for nanodrugs. The approach must of course be seen as just one early component in a screening hierarchy, where earlier “upstream” methods are material characterization and theoretical modeling, while “downstream” methods include more complex sub- cellular structures, in vitro cell studies, in vivo screening, and eventually clinical trials. An important field where nanoparticle drug formula- tion has great potential is for the non-invasive admini- stration of insulin. Non-invasive alternatives (e.g. oral, nasal, or pulmonary) to injections of the drug are highly desired.[9] For this purpose, a cationic polymer (the drug carrier) and the anionic proteins (the insulin drug load) were assembled into nanoparticles (referred to as NP-HI below) following established procedures (such assem- 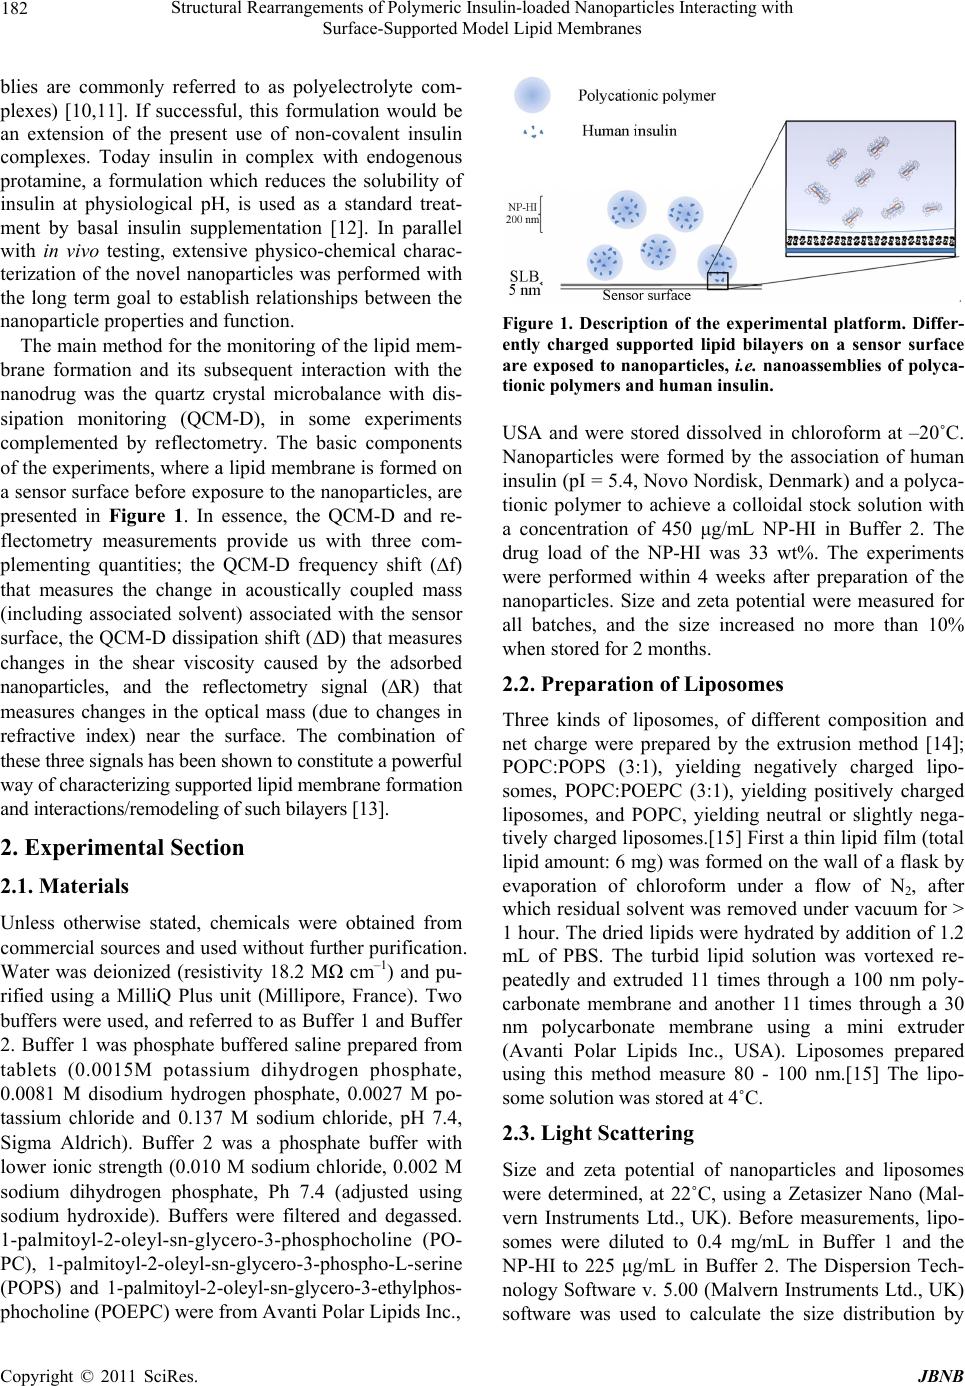 Structural Rearrangements of Polymeric Insulin-loaded Nanoparticles Interacting with Surface-Supported Model Lipid Membranes 182 blies are commonly referred to as polyelectrolyte com- plexes) [10,11]. If successful, this formulation would be an extension of the present use of non-covalent insulin complexes. Today insulin in complex with endogenous protamine, a formulation which reduces the solubility of insulin at physiological pH, is used as a standard treat- ment by basal insulin supplementation [12]. In parallel with in vivo testing, extensive physico-chemical charac- terization of the novel nanoparticles was performed with the long term goal to establish relationships between the nanoparticle properties and function. The main method for the monitoring of the lipid mem- brane formation and its subsequent interaction with the nanodrug was the quartz crystal microbalance with dis- sipation monitoring (QCM-D), in some experiments complemented by reflectometry. The basic components of the experiments, where a lipid membrane is formed on a sensor surface before exposure to the nanoparticles, are presented in Figure 1. In essence, the QCM-D and re- flectometry measurements provide us with three com- plementing quantities; the QCM-D frequency shift (∆f) that measures the change in acoustically coupled mass (including associated solvent) associated with the sensor surface, the QCM-D dissipation shift (∆D) that measures changes in the shear viscosity caused by the adsorbed nanoparticles, and the reflectometry signal (∆R) that measures changes in the optical mass (due to changes in refractive index) near the surface. The combination of these three signals has been shown to constitute a powerful way of characterizing supported lipid membrane formation and interactions/remodeling of such bilayers [13]. 2. Experimental Section 2.1. Materials Unless otherwise stated, chemicals were obtained from commercial sources and used without further purification. Water was deionized (resistivity 18.2 MΩ cm–1) and pu- rified using a MilliQ Plus unit (Millipore, France). Two buffers were used, and referred to as Buffer 1 and Buffer 2. Buffer 1 was phosphate buffered saline prepared from tablets (0.0015M potassium dihydrogen phosphate, 0.0081 M disodium hydrogen phosphate, 0.0027 M po- tassium chloride and 0.137 M sodium chloride, pH 7.4, Sigma Aldrich). Buffer 2 was a phosphate buffer with lower ionic strength (0.010 M sodium chloride, 0.002 M sodium dihydrogen phosphate, Ph 7.4 (adjusted using sodium hydroxide). Buffers were filtered and degassed. 1-palmitoyl-2-oleyl-sn-glycero-3-phosphocholine (PO- PC), 1-palmitoyl-2-oleyl-sn-glycero-3-phospho-L-serine (POPS) and 1-palmitoyl-2-oleyl-sn-glycero-3-ethylphos- phocholine (POEPC) were from Avanti Polar Lipids Inc., Figure 1. Description of the experimental platform. Differ- ently charged supported lipid bilayers on a sensor surface are exposed to nanoparticles, i.e. nanoassemblies of polyca- tionic polymers and human insulin. USA and were stored dissolved in chloroform at –20˚C. Nanoparticles were formed by the association of human insulin (pI = 5.4, Novo Nordisk, Denmark) and a polyca- tionic polymer to achieve a colloidal stock solution with a concentration of 450 μg/mL NP-HI in Buffer 2. The drug load of the NP-HI was 33 wt%. The experiments were performed within 4 weeks after preparation of the nanoparticles. Size and zeta potential were measured for all batches, and the size increased no more than 10% when stored for 2 months. 2.2. Preparation of Liposomes Three kinds of liposomes, of different composition and net charge were prepared by the extrusion method [14]; POPC:POPS (3:1), yielding negatively charged lipo- somes, POPC:POEPC (3:1), yielding positively charged liposomes, and POPC, yielding neutral or slightly nega- tively charged liposomes.[15] First a thin lipid film (total lipid amount: 6 mg) was formed on the wall of a flask by evaporation of chloroform under a flow of N2, after which residual solvent was removed under vacuum for > 1 hour. The dried lipids were hydrated by addition of 1.2 mL of PBS. The turbid lipid solution was vortexed re- peatedly and extruded 11 times through a 100 nm poly- carbonate membrane and another 11 times through a 30 nm polycarbonate membrane using a mini extruder (Avanti Polar Lipids Inc., USA). Liposomes prepared using this method measure 80 - 100 nm.[15] The lipo- some solution was stored at 4˚C. 2.3. Light Scattering Size and zeta potential of nanoparticles and liposomes were determined, at 22˚C, using a Zetasizer Nano (Mal- vern Instruments Ltd., UK). Before measurements, lipo- somes were diluted to 0.4 mg/mL in Buffer 1 and the NP-HI to 225 μg/mL in Buffer 2. The Dispersion Tech- nology Software v. 5.00 (Malvern Instruments Ltd., UK) software was used to calculate the size distribution by C opyright © 2011 SciRes. JBNB 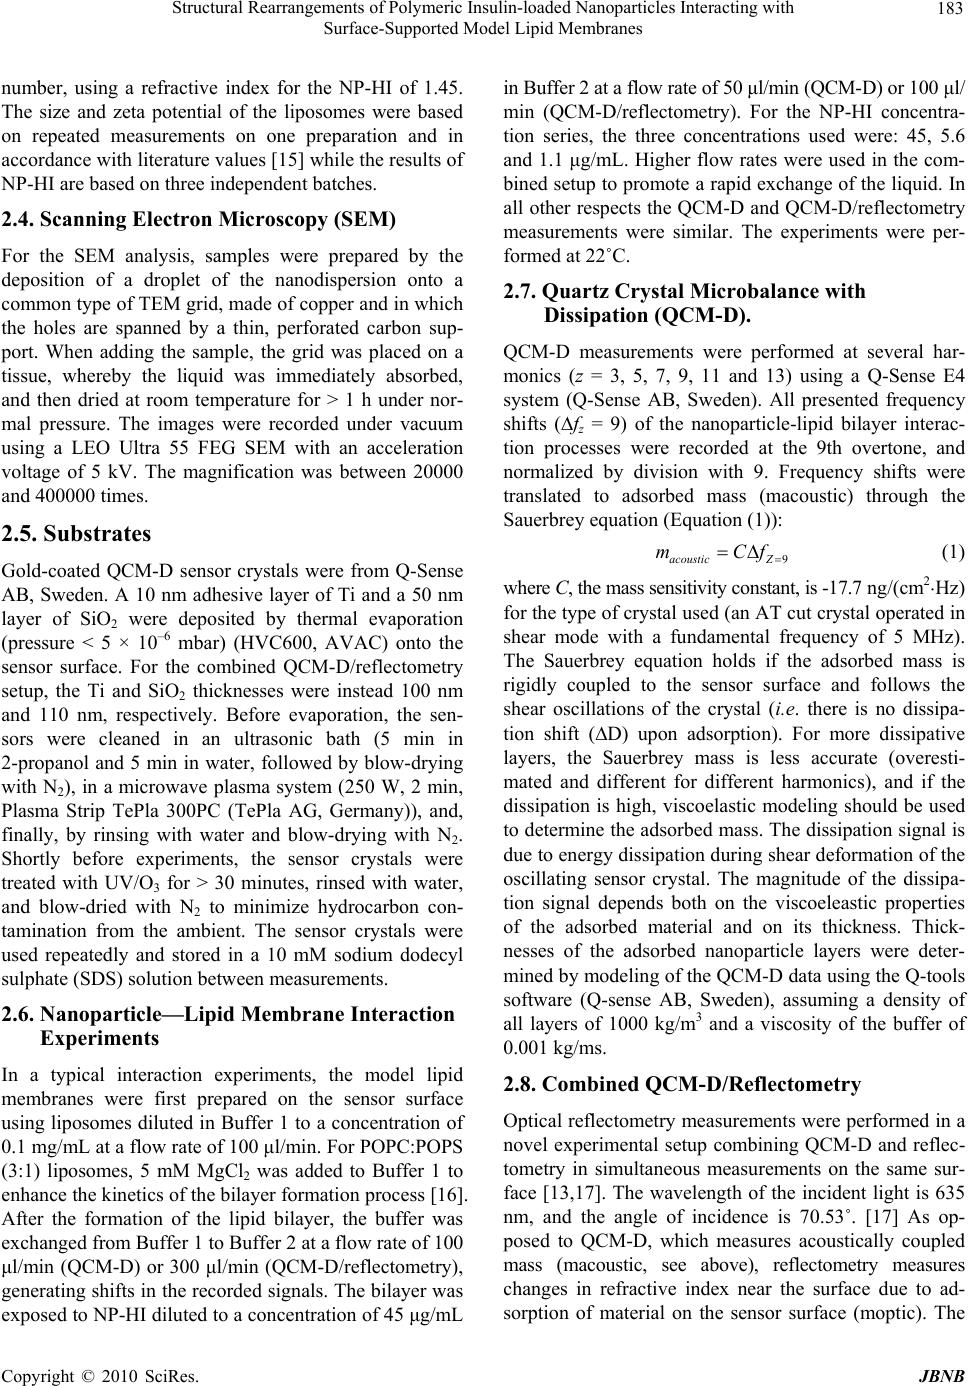 Structural Rearrangements of Polymeric Insulin-loaded Nanoparticles Interacting with Surface-Supported Model Lipid Membranes 183 number, using a refractive index for the NP-HI of 1.45. The size and zeta potential of the liposomes were based on repeated measurements on one preparation and in accordance with literature values [15] while the results of NP-HI are based on three independent batches. 2.4. Scanning Electron Microscopy (SEM) For the SEM analysis, samples were prepared by the deposition of a droplet of the nanodispersion onto a common type of TEM grid, made of copper and in which the holes are spanned by a thin, perforated carbon sup- port. When adding the sample, the grid was placed on a tissue, whereby the liquid was immediately absorbed, and then dried at room temperature for > 1 h under nor- mal pressure. The images were recorded under vacuum using a LEO Ultra 55 FEG SEM with an acceleration voltage of 5 kV. The magnification was between 20000 and 400000 times. 2.5. Substrates Gold-coated QCM-D sensor crystals were from Q-Sense AB, Sweden. A 10 nm adhesive layer of Ti and a 50 nm layer of SiO2 were deposited by thermal evaporation (pressure < 5 × 10⁻⁶ mbar) (HVC600, AVAC) onto the sensor surface. For the combined QCM-D/reflectometry setup, the Ti and SiO2 thicknesses were instead 100 nm and 110 nm, respectively. Before evaporation, the sen- sors were cleaned in an ultrasonic bath (5 min in 2-propanol and 5 min in water, followed by blow-drying with N2), in a microwave plasma system (250 W, 2 min, Plasma Strip TePla 300PC (TePla AG, Germany)), and, finally, by rinsing with water and blow-drying with N2. Shortly before experiments, the sensor crystals were treated with UV/O3 for > 30 minutes, rinsed with water, and blow-dried with N2 to minimize hydrocarbon con- tamination from the ambient. The sensor crystals were used repeatedly and stored in a 10 mM sodium dodecyl sulphate (SDS) solution between measurements. 2.6. Nanoparticle—Lipid Membrane Interaction Experiments In a typical interaction experiments, the model lipid membranes were first prepared on the sensor surface using liposomes diluted in Buffer 1 to a concentration of 0.1 mg/mL at a flow rate of 100 μl/min. For POPC:POPS (3:1) liposomes, 5 mM MgCl2 was added to Buffer 1 to enhance the kinetics of the bilayer formation process [16]. After the formation of the lipid bilayer, the buffer was exchanged from Buffer 1 to Buffer 2 at a flow rate of 100 μl/min (QCM-D) or 300 μl/min (QCM-D/reflectometry), generating shifts in the recorded signals. The bilayer was exposed to NP-HI diluted to a concentration of 45 μg/mL in Buffer 2 at a flow rate of 50 μl/min (QCM-D) or 100 μl/ min (QCM-D/reflectometry). For the NP-HI concentra- tion series, the three concentrations used were: 45, 5.6 and 1.1 μg/mL. Higher flow rates were used in the com- bined setup to promote a rapid exchange of the liquid. In all other respects the QCM-D and QCM-D/reflectometry measurements were similar. The experiments were per- formed at 22˚C. 2.7. Quartz Crystal Microbalance with Dissipation (QCM-D). QCM-D measurements were performed at several har- monics (z = 3, 5, 7, 9, 11 and 13) using a Q-Sense E4 system (Q-Sense AB, Sweden). All presented frequency shifts (∆fz = 9) of the nanoparticle-lipid bilayer interac- tion processes were recorded at the 9th overtone, and normalized by division with 9. Frequency shifts were translated to adsorbed mass (macoustic) through the Sauerbrey equation (Equation (1)): 9 acoustic Z mCf (1) where C, the mass sensitivity constant, is -17.7 ng/(cm2·Hz) for the type of crystal used (an AT cut crystal operated in shear mode with a fundamental frequency of 5 MHz). The Sauerbrey equation holds if the adsorbed mass is rigidly coupled to the sensor surface and follows the shear oscillations of the crystal (i.e. there is no dissipa- tion shift (∆D) upon adsorption). For more dissipative layers, the Sauerbrey mass is less accurate (overesti- mated and different for different harmonics), and if the dissipation is high, viscoelastic modeling should be used to determine the adsorbed mass. The dissipation signal is due to energy dissipation during shear deformation of the oscillating sensor crystal. The magnitude of the dissipa- tion signal depends both on the viscoeleastic properties of the adsorbed material and on its thickness. Thick- nesses of the adsorbed nanoparticle layers were deter- mined by modeling of the QCM-D data using the Q-tools software (Q-sense AB, Sweden), assuming a density of all layers of 1000 kg/m3 and a viscosity of the buffer of 0.001 kg/ms. 2.8. Combined QCM-D/Reflectometry Optical reflectometry measurements were performed in a novel experimental setup combining QCM-D and reflec- tometry in simultaneous measurements on the same sur- face [13,17]. The wavelength of the incident light is 635 nm, and the angle of incidence is 70.53˚. [17] As op- posed to QCM-D, which measures acoustically coupled mass (macoustic, see above), reflectometry measures changes in refractive index near the surface due to ad- sorption of material on the sensor surface (moptic). The C opyright © 2010 SciRes. JBNB 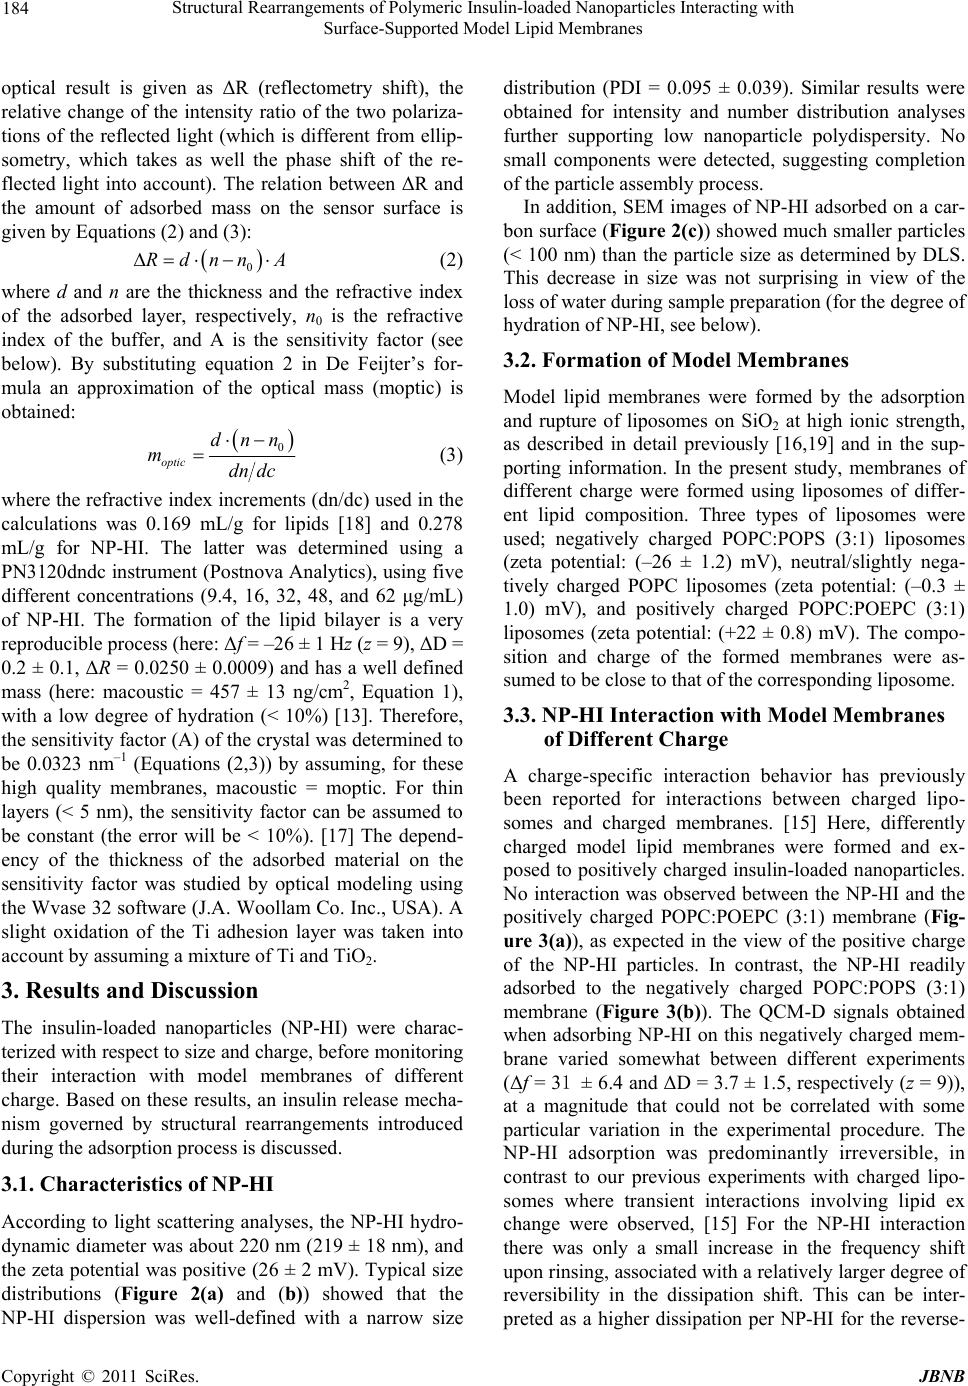 Structural Rearrangements of Polymeric Insulin-loaded Nanoparticles Interacting with Surface-Supported Model Lipid Membranes 184 optical result is given as ΔR (reflectometry shift), the relative change of the intensity ratio of the two polariza- tions of the reflected light (which is different from ellip- sometry, which takes as well the phase shift of the re- flected light into account). The relation between ΔR and the amount of adsorbed mass on the sensor surface is given by Equations (2) and (3): 0 RdnnA (2) where d and n are the thickness and the refractive index of the adsorbed layer, respectively, n0 is the refractive index of the buffer, and A is the sensitivity factor (see below). By substituting equation 2 in De Feijter’s for- mula an approximation of the optical mass (moptic) is obtained: 0 optic dnn mdn dc (3) where the refractive index increments (dn/dc) used in the calculations was 0.169 mL/g for lipids [18] and 0.278 mL/g for NP-HI. The latter was determined using a PN3120dndc instrument (Postnova Analytics), using five different concentrations (9.4, 16, 32, 48, and 62 μg/mL) of NP-HI. The formation of the lipid bilayer is a very reproducible process (here: Δf = –26 ± 1 Hz (z = 9), ΔD = 0.2 ± 0.1, ΔR = 0.0250 ± 0.0009) and has a well defined mass (here: macoustic = 457 ± 13 ng/cm2, Equation 1), with a low degree of hydration (< 10%) [13]. Therefore, the sensitivity factor (A) of the crystal was determined to be 0.0323 nm–1 (Equations (2,3)) by assuming, for these high quality membranes, macoustic = moptic. For thin layers (< 5 nm), the sensitivity factor can be assumed to be constant (the error will be < 10%). [17] The depend- ency of the thickness of the adsorbed material on the sensitivity factor was studied by optical modeling using the Wvase 32 software (J.A. Woollam Co. Inc., USA). A slight oxidation of the Ti adhesion layer was taken into account by assuming a mixture of Ti and TiO2. 3. Results and Discussion The insulin-loaded nanoparticles (NP-HI) were charac- terized with respect to size and charge, before monitoring their interaction with model membranes of different charge. Based on these results, an insulin release mecha- nism governed by structural rearrangements introduced during the adsorption process is discussed. 3.1. Characteristics of NP-HI According to light scattering analyses, the NP-HI hydro- dynamic diameter was about 220 nm (219 ± 18 nm), and the zeta potential was positive (26 ± 2 mV). Typical size distributions (Figure 2(a) and (b)) showed that the NP-HI dispersion was well-defined with a narrow size distribution (PDI = 0.095 ± 0.039). Similar results were obtained for intensity and number distribution analyses further supporting low nanoparticle polydispersity. No small components were detected, suggesting completion of the particle assembly process. In addition, SEM images of NP-HI adsorbed on a car- bon surface (Figure 2(c)) showed much smaller particles (< 100 nm) than the particle size as determined by DLS. This decrease in size was not surprising in view of the loss of water during sample preparation (for the degree of hydration of NP-HI, see below). 3.2. Formation of Model Membranes Model lipid membranes were formed by the adsorption and rupture of liposomes on SiO2 at high ionic strength, as described in detail previously [16,19] and in the sup- porting information. In the present study, membranes of different charge were formed using liposomes of differ- ent lipid composition. Three types of liposomes were used; negatively charged POPC:POPS (3:1) liposomes (zeta potential: (–26 ± 1.2) mV), neutral/slightly nega- tively charged POPC liposomes (zeta potential: (–0.3 ± 1.0) mV), and positively charged POPC:POEPC (3:1) liposomes (zeta potential: (+22 ± 0.8) mV). The compo- sition and charge of the formed membranes were as- sumed to be close to that of the corresponding liposome. 3.3. NP-HI Interaction with Model Membranes of Different Charge A charge-specific interaction behavior has previously been reported for interactions between charged lipo- somes and charged membranes. [15] Here, differently charged model lipid membranes were formed and ex- posed to positively charged insulin-loaded nanoparticles. No interaction was observed between the NP-HI and the positively charged POPC:POEPC (3:1) membrane (Fig- ure 3(a)), as expected in the view of the positive charge of the NP-HI particles. In contrast, the NP-HI readily adsorbed to the negatively charged POPC:POPS (3:1) membrane (Figure 3(b)). The QCM-D signals obtained when adsorbing NP-HI on this negatively charged mem- brane varied somewhat between different experiments (Δf = 31 ± 6.4 and ΔD = 3.7 ± 1.5, respectively (z = 9)), at a magnitude that could not be correlated with some particular variation in the experimental procedure. The NP-HI adsorption was predominantly irreversible, in contrast to our previous experiments with charged lipo- somes where transient interactions involving lipid ex change were observed, [15] For the NP-HI interaction there was only a small increase in the frequency shift upon rinsing, associated with a relatively larger degree of reversibility in the dissipation shift. This can be inter- preted as a higher dissipation per NP-HI for the reverse- C opyright © 2011 SciRes. JBNB 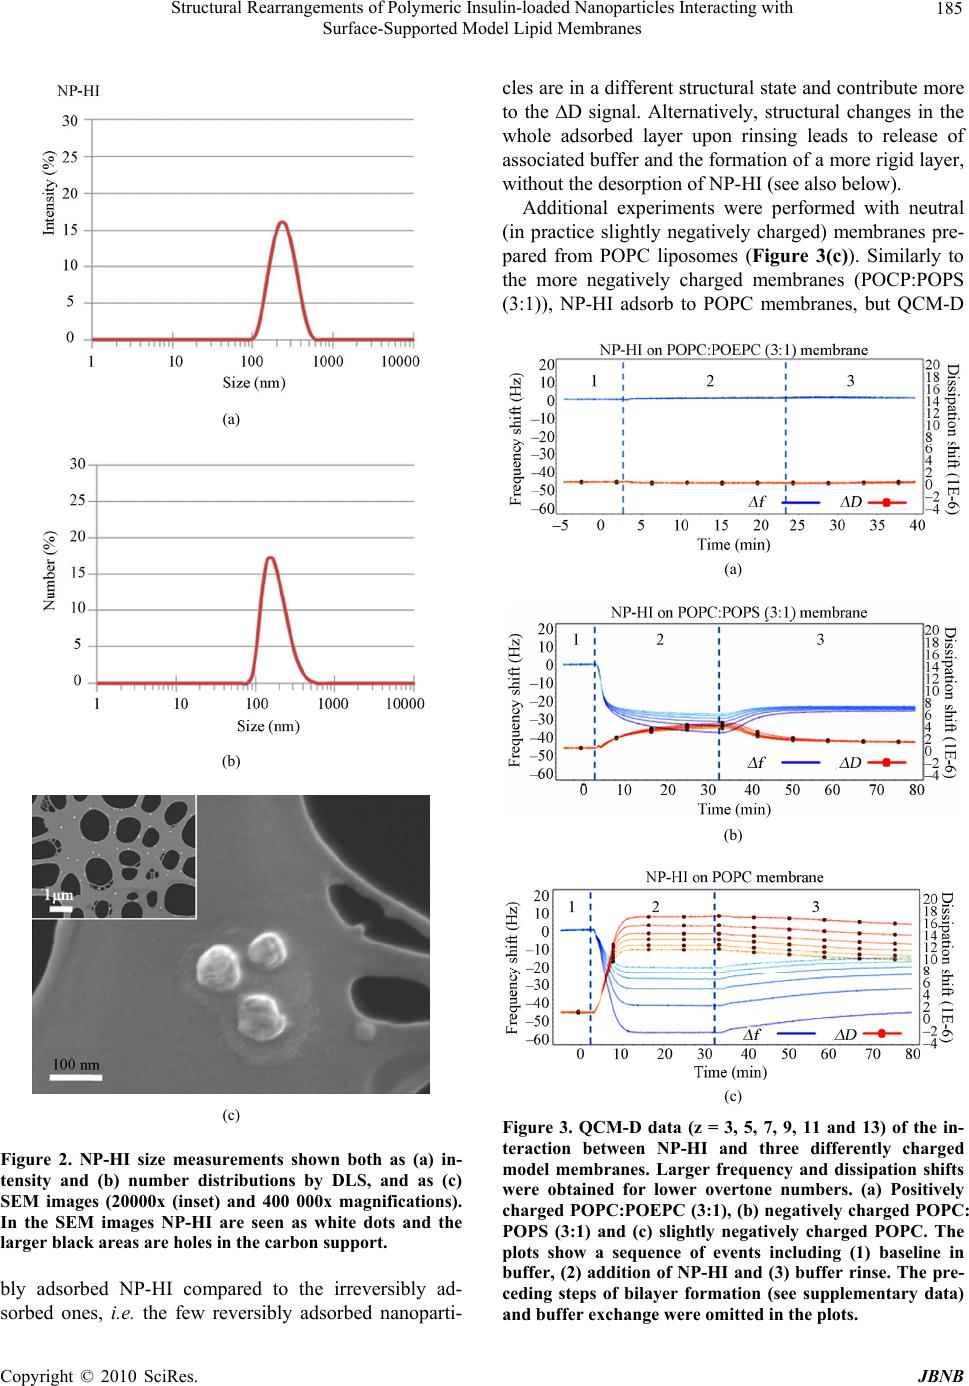 Structural Rearrangements of Polymeric Insulin-loaded Nanoparticles Interacting with Surface-Supported Model Lipid Membranes 185 (a) (b) (c) Figure 2. NP-HI size measurements shown both as (a) in- tensity and (b) number distributions by DLS, and as (c) SEM images (20000x (inset) and 400 000x magnifications). In the SEM images NP-HI are seen as white dots and the larger black areas are holes in the carbon support. bly adsorbed NP-HI compared to the irreversibly ad- sorbed ones, i.e. the few reversibly adsorbed nanoparti- cles are in a different structural state and contribute more to the ∆D signal. Alternatively, structural changes in the whole adsorbed layer upon rinsing leads to release of associated buffer and the formation of a more rigid layer, without the desorption of NP-HI (see also below). Additional experiments were performed with neutral (in practice slightly negatively charged) membranes pre- pared from POPC liposomes (Figure 3(c)). Similarly to the more negatively charged membranes (POCP:POPS (3:1)), NP-HI adsorb to POPC membranes, but QCM-D (a) (b) (c) Figure 3. QCM-D data (z = 3, 5, 7, 9, 11 and 13) of the in- teraction between NP-HI and three differently charged model membranes. Larger frequency and dissipation shifts were obtained for lower overtone numbers. (a) Positively charged POPC:POEPC (3:1), (b) negatively charged POPC: POPS (3:1) and (c) slightly negatively charged POPC. The plots show a sequence of events including (1) baseline in buffer, (2) addition of NP-HI and (3) buffer rinse. The pre- ceding steps of bilayer formation (see supplementary data) and buffer exchange were omitted in the plots. C opyright © 2010 SciRes. JBNB 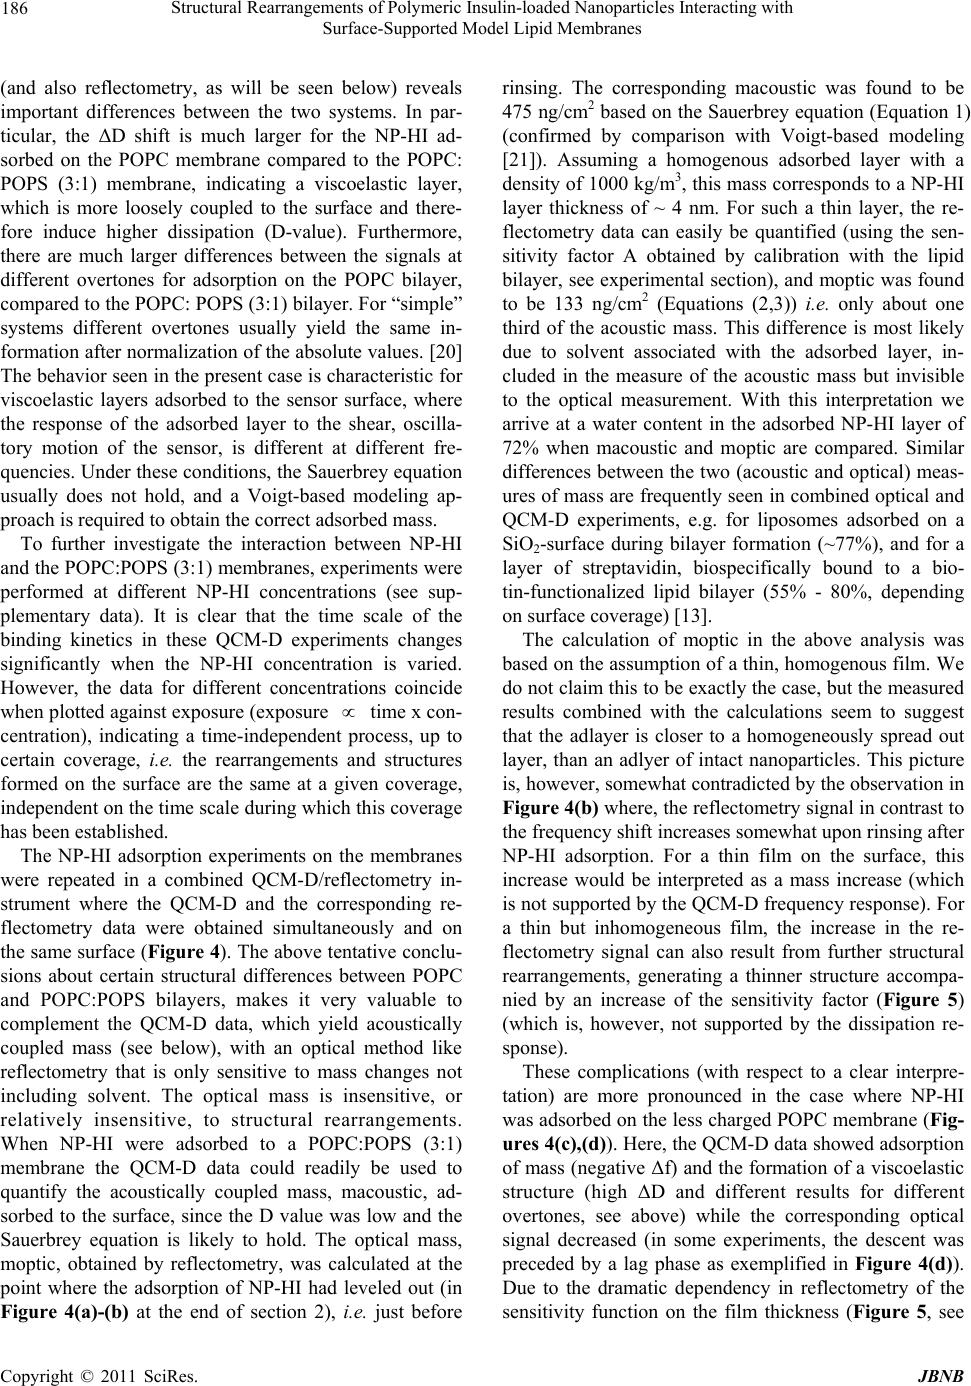 Structural Rearrangements of Polymeric Insulin-loaded Nanoparticles Interacting with Surface-Supported Model Lipid Membranes 186 (and also reflectometry, as will be seen below) reveals important differences between the two systems. In par- ticular, the ΔD shift is much larger for the NP-HI ad- sorbed on the POPC membrane compared to the POPC: POPS (3:1) membrane, indicating a viscoelastic layer, which is more loosely coupled to the surface and there- fore induce higher dissipation (D-value). Furthermore, there are much larger differences between the signals at different overtones for adsorption on the POPC bilayer, compared to the POPC: POPS (3:1) bilayer. For “simple” systems different overtones usually yield the same in- formation after normalization of the absolute values. [20] The behavior seen in the present case is characteristic for viscoelastic layers adsorbed to the sensor surface, where the response of the adsorbed layer to the shear, oscilla- tory motion of the sensor, is different at different fre- quencies. Under these conditions, the Sauerbrey equation usually does not hold, and a Voigt-based modeling ap- proach is required to obtain the correct adsorbed mass. To further investigate the interaction between NP-HI and the POPC:POPS (3:1) membranes, experiments were performed at different NP-HI concentrations (see sup- plementary data). It is clear that the time scale of the binding kinetics in these QCM-D experiments changes significantly when the NP-HI concentration is varied. However, the data for different concentrations coincide when plotted against exposure (exposure time x con- centration), indicating a time-independent process, up to certain coverage, i.e. the rearrangements and structures formed on the surface are the same at a given coverage, independent on the time scale during which this coverage has been established. The NP-HI adsorption experiments on the membranes were repeated in a combined QCM-D/reflectometry in- strument where the QCM-D and the corresponding re- flectometry data were obtained simultaneously and on the same surface (Figure 4). The above tentative conclu- sions about certain structural differences between POPC and POPC:POPS bilayers, makes it very valuable to complement the QCM-D data, which yield acoustically coupled mass (see below), with an optical method like reflectometry that is only sensitive to mass changes not including solvent. The optical mass is insensitive, or relatively insensitive, to structural rearrangements. When NP-HI were adsorbed to a POPC:POPS (3:1) membrane the QCM-D data could readily be used to quantify the acoustically coupled mass, macoustic, ad- sorbed to the surface, since the D value was low and the Sauerbrey equation is likely to hold. The optical mass, moptic, obtained by reflectometry, was calculated at the point where the adsorption of NP-HI had leveled out (in Figure 4(a)-(b) at the end of section 2), i.e. just before rinsing. The corresponding macoustic was found to be 475 ng/cm2 based on the Sauerbrey equation (Equation 1) (confirmed by comparison with Voigt-based modeling [21]). Assuming a homogenous adsorbed layer with a density of 1000 kg/m3, this mass corresponds to a NP-HI layer thickness of ~ 4 nm. For such a thin layer, the re- flectometry data can easily be quantified (using the sen- sitivity factor A obtained by calibration with the lipid bilayer, see experimental section), and moptic was found to be 133 ng/cm2 (Equations (2,3)) i.e. only about one third of the acoustic mass. This difference is most likely due to solvent associated with the adsorbed layer, in- cluded in the measure of the acoustic mass but invisible to the optical measurement. With this interpretation we arrive at a water content in the adsorbed NP-HI layer of 72% when macoustic and moptic are compared. Similar differences between the two (acoustic and optical) meas- ures of mass are frequently seen in combined optical and QCM-D experiments, e.g. for liposomes adsorbed on a SiO2-surface during bilayer formation (~77%), and for a layer of streptavidin, biospecifically bound to a bio- tin-functionalized lipid bilayer (55% - 80%, depending on surface coverage) [13]. The calculation of moptic in the above analysis was based on the assumption of a thin, homogenous film. We do not claim this to be exactly the case, but the measured results combined with the calculations seem to suggest that the adlayer is closer to a homogeneously spread out layer, than an adlyer of intact nanoparticles. This picture is, however, somewhat contradicted by the observation in Figure 4(b) where, the reflectometry signal in contrast to the frequency shift increases somewhat upon rinsing after NP-HI adsorption. For a thin film on the surface, this increase would be interpreted as a mass increase (which is not supported by the QCM-D frequency response). For a thin but inhomogeneous film, the increase in the re- flectometry signal can also result from further structural rearrangements, generating a thinner structure accompa- nied by an increase of the sensitivity factor (Figure 5) (which is, however, not supported by the dissipation re- sponse). These complications (with respect to a clear interpre- tation) are more pronounced in the case where NP-HI was adsorbed on the less charged POPC membrane (Fig- ures 4(c),(d)). Here, the QCM-D data showed adsorption of mass (negative Δf) and the formation of a viscoelastic structure (high ΔD and different results for different overtones, see above) while the corresponding optical signal decreased (in some experiments, the descent was preceded by a lag phase as exemplified in Figure 4(d)). Due to the dramatic dependency in reflectometry of the sensitivity function on the film thickness (Figure 5, see C opyright © 2011 SciRes. JBNB  Structural Rearrangements of Polymeric Insulin-loaded Nanoparticles Interacting with Surface-Supported Model Lipid Membranes Copyright © 2010 SciRes. JBNB 187 Figure 4. Combined QCM-D and reflectometry results where the data from the two techniques were collected simultaneously on the same sensor surface. (A) QCM-D data (z = 9) from the interaction between the positively charged NP-HI (45 μg/ml) and the negatively charged model membrane (POPC:POPS (3:1)). (b) Reflectometry data corresponding to (a). (c) QCM-D data (z = 9) from the interaction between the positively charged NP-HI (45 μg/ml) and the slightly negatively charged model membrane (POPC). (d) Reflectometry data corresponding to (c). Both plots show a sequence of events including (1) baseline in buffer, (2) addition of NP-HI and (3) buffer rinse. The bilayer formation and buffer exchange were omitted from the plots. Figure 5. Modeling of the reflectometry sensitivity factor A. (a) The different layers included in the model and their respec- tive thicknesses (d) and optical properties (n, k). (b) The plot shows how the calculated sensitivity factor varies as a function of the thickness (10-500 nm) of the NP-HI layer (grey in (a)). 3.4. Suggested Scenario for NP-HI Adsorption and Insulin Release upon Membrane Interaction also work on hyaluronan films [22]), we believe that the NP-HI layer on the less charged POPC membrane is much thicker than on the POPC:POPS (3:1) membrane. The sensitivity factor is negative for film thicknesses similar to the present nanoparticle size, and Voigt-based modeling [21] of the QCM-D data confirms thicknesses of about 100 nm on the POPC membrane. Based on our experimental results we attempt to formu- late a scenario for the interaction between the insu- lin-loaded polymeric nanoparticles and model mem- branes. As the system is obviously complex in behavior  Structural Rearrangements of Polymeric Insulin-loaded Nanoparticles Interacting with Surface-Supported Model Lipid Membranes 188 and some of the measured signals partly contradict each other when too simple pictures are tried, the suggested scenarios should be taken as tentative. We also want to emphasize that the results, although complex to interpret, demonstrate the value of the experimental platform as such, i.e. a multitechnique approach to study the interac- tions between supported biomimetic membranes and drug loaded nanoparticles. Our first conclusion is that the cationic nanoparticles in this study adsorb selectively to negatively charged membranes. This observation is in line with the general idea that the electrostatic properties of the drug carrier are very important for its interaction with biological bar- riers. We note however, that the observed specificity of the interaction between NP-HI and model membranes with respect to charge cannot always be predicted based on the nanoparticle zeta potential alone. Cationic nano- materials which have the ability to interact as well via hydrophobic interactions will bind to lipid membranes independently of membrane charge, if the interaction is such the hydrophobic regions are exposed to each other. Furthermore, for targeted drug carriers it is desirable that the interaction with the membrane is only governed by the (biospecific) targeting entity. In our experiments with negatively charged mem- branes we observed adsorption of cationic nanoparticles and different interaction behaviors dependent on the de- gree of negative charge. In all experiments the NP-HI mass obtained on the negatively charged membranes is much lower than would have been expected for a closely packed layer of nanoparticles. This low surface coverage, about 3% assuming intact particles1, cannot be explained by a simple scenario where electrostatic repulsion be- tween the charged nanoparticles controls the adsorption, since the typical Debye-length in these experiments is much smaller (nm range) than the calculated interparticle distance (μm range). A likely explanation for the low number of adsorbed nanoparticles was already discussed above, and involves conformational changes of the nanoparticles upon ad- sorption, e.g. due to particle flattening, governed by the membrane charge, so that each particle occupy a much larger area (Figure 6) than it would do if it adsorbed in- tact. Alternatively the conformational change of the nanoparticles (partly) goes even further so that they dis- assemble and free polycations bind to the surface. The low number of adsorbed particles could also be related to a more dynamic participation of the supported membrane, than being just a 2D film surface for adsorption. For ex- Figure 6. Schematic illustration of possible NP-HI adsorp- tion scenarios on two model membranes. When NP-HI are adsorbed on a POPC:POPS (3:1) membrane the particles collapse, possibly in associated with the release of human insulin. If instead the membrane consist of POPC lipids only, the NP-HI adsorb fairly intact and a thicker layer is formed. In the latter case disruption of the membrane could occur. See text for details. ample, fluid model lipid membranes are different from- many other model surfaces in that the lipids within the membrane can move rapidly on the time scale of nanopar- ticle adsorption. Thus lateral surface rearrangements occur in response to adsorbing material, e.g., nanoparticles could affect the fluidity of the membrane [23] and positively charged liposomes could move laterally when adsorbed to a negatively charged membrane due to an induced charge gradient [24]. In our experiments with mixed membrane compositions (POPC:POPS), it is likely that the negatively charged lipids (POPS) accumulate under the adsorbed positively charged nanoparticles. In this way the adsorbed nanoparticles deplete the membrane zone around them from negative lipids. This lateral mobility cannot fully explain the observed low surface coverage, since nanopar- ticles adsorb as well (in separate experiments) readily to membranes consisting of only POPC lipids. However it is likely to give rise to an inhomogeneous layer which is also suggested by the experimental data (see above). The pas- sivation of the surface in between the particles could also be explained by remodeling and even disruption of the membrane and removal of the membrane from the surface. [25] Note however that the NP-HI was observed to adsorb to bare SiO2 surfaces as well, and thus exposed areas of SiO2 would not be resistant to NP-HI adsorption. Taking all these considerations into account, it is likely that the low surface coverage of nanoparticles is due mainly to structural rearrangements of the nanoparticles occurring at or just after the adsorption event. The driv- ing force for such rearrangement is most likely domi- 1By assuming spherical nanoparticles, with a diameter of 200 nm and an effective density of 1.1 - 1.3 g/cm3, the (saturation) surface coverage of NP-HI (based on macoustic) was estimated to 3%, with an interparti- cle distance of ~1 m. C opyright © 2011 SciRes. JBNB  Structural Rearrangements of Polymeric Insulin-loaded Nanoparticles Interacting with Surface-Supported Model Lipid Membranes 189 nated, or at least initiated, by electrostatic interactions between the components of the nanoparticles (polyelec- trolyte and human insulin) and the fluid membrane. This is consistent with the fact that the (suggested) structural rearrangements are more pronounced on the more nega- tively charged membrane (Figure 6), where the particles collapse. We suggest that the collapse of the particles is controlled by the membrane charge and that the struc- tural rearrangements are accompanied by release of insu- lin, which is negatively charged, when the polycation is exposed to the negatively charged surface. A complete disintegration of the nanoparticles is not likely to have occurred, since the resulting layer would then yield, even on the more charged membrane, a much lower dissipa- tion shift than observed. The measured dissipation shift instead correlates well with previously reported values, on SiO2, for a layer of adsorbed lipid vesicles of the same size range as the nanoparticles (~200 nm) [26]. 3.5. Extensions of the Experimental Platform Our results demonstrate how a surface-based approach, using model membranes supported on a surface and sur- face analytical techniques, can provide valuable struc- ture-function relationships for novel nanoparticles. With such studies, properties of the drug carrier can be opti- mized to promote drug release at a target interface of a certain charge. The three model membranes used in this study consists each of one or two types of lipids. This is of course far from the complexity of a native cell membrane, and the biological relevance might therefore be questioned. However, firstly the results still demonstrate the value of the current methodological approach, with which the complexity of the membranes can be increased succes- sively. Secondly the strategy followed for further devel- opment of the nanoparticles used in this study does not rely upon targeting of a specific biological receptor. There- fore, our simple model membranes are relevant as model membranes to address efficiency and kinetics of the nanoparticle interaction with charged surfaces in general and lipid membranes in particular. Native cell mem- branes are negatively charged, and because of this an interaction with the nanoparticles is expected. Even if specific membrane receptors were targeted, the overall interaction would still be influenced by the demonstrated non-specific interactions. Note however that although we have emphasized electrostatic interactions above, other non-specific interactions may also be important, like van der Waals and hydrophobic interactions, perhaps follow- ing upon initial electrostatic interactions (which could be one possible cause of the difficulty to reconcile the meas- ured D and reflectometry signals in the present work). Besides QCM-D and reflectometry, other surface sen- sitive techniques can be added to the presented platform. For example, AFM would be useful to study the surface topography after nanoparticle adsorption [27], and elec- trochemical impedance spectroscopy (EIS) can be ap- plied to study the integrity of the membrane [28] and how it is affected by nanoparticles. Other methods within the scope of our future studies are FTIR and fluorescence measurements. Finally, the presented methodology (supported model lipid membranes and surface-sensitive analytical tech- niques to study nanoparticle interaction with biomimetic membranes) is not restricted to investigation of nanopar- ticles for drug delivery, but all nano- and micro- sized materials are possible to evaluate. Apart from drug de- livery, nanoparticles could for example be evaluated with respect to toxicity, since many toxic substances specifi- cally target the cell membrane. In particular, it has been demonstrated that it is possible to assess the disruptive effect that cationic nanoparticles exert on lipid bilayers [25]. 3.6. Implications for in Vivo Function For non-invasive insulin delivery it is desirable to obtain a release of protein drug load in close proximity to the cell surface e.g. in the epithelial cell lining of the small intestine or the lung. The insulin receptor is surface asso- ciated, wherefore uptake of intact nanoparticles is not desired. The presented data show that the nanoparticles structurally rearrange when adsorbed to negatively charged surfaces, a process that is also likely to occur for nanoparticles interacting with mucosa. These structural rearrangements are most likely associated with drug re- lease. For therapeutic use, products offering either rapid or slow release of the insulin will be required. The kind of data presented here can be used to tune the drug re- lease from its carrier with the aim to design efficient in vivo testing and to improve the fundamental understand- ing of the nano-bio interface. In general, the development of advanced drug delivery systems for biopharmaceuti- cals will require tools for in vitro characterization of their physico-chemical properties. We foresee that surface sensitive analytical techniques will play an important role in the field. 4. Conclusion The interaction of nanoassemblies of a polycationic polymer and human insulin with model lipid membranes was investigated. The cationic nanoparticles (hydrody- namic diameter about 220 nm) readily interacted with negatively charged membranes, while no adsorption oc- curred on a positively charged membrane. Based on a C opyright © 2010 SciRes. JBNB  Structural Rearrangements of Polymeric Insulin-loaded Nanoparticles Interacting with Surface-Supported Model Lipid Membranes 190 combined QCM-D/reflectometry analysis it was con- cluded that the insulin-loaded nanoparticles undergo structural rearrangements when adsorbed to a negatively charged membrane, likely also releasing the drug load. On a less negatively charged membrane, the structural collapse was less apparent. These results motivate the further use and development of this experimental plat- form to guide the design and development of novel nano-sized drug carriers. 5. Acknowledgements This work was financially supported by the EU FP6 IP NanoBioPharmaceutics. Novo Nordisk is acknowledged for supplying human insulin. The authors thank Stefan Gustafsson for performing the SEM analysis and Laurent Feuz for modeling of the sensitivity factor. Additional support was obtained from the Swedish Research Council. REFERENCES [1] E. Sackmann, “Supported Membranes: Scientific and Practical Applications,” Science, Vol. 271, 1996, pp. 43-48. [2] O. V. Salata, “Applications of Nanoparticles in Biology and Medicine,” Journal of Nanobiotechnology, Vol. 2, 2004, p. 3. [3] V. P. Torchilin, “Multifunctional Nanocarriers,” Advanced Drug Delivery Reviews, Vol. 58, 2006, pp. 1532-1555. [4] R. Arshady and K. Kono, “Smart Nanoparticles in Nano- medicine,” Kentus Books, London, 2006. [5] A. Kunze, P. Sjovall, B. Kasemo and S. Svedhem, “In Situ Preparation and Modification of Supported Lipid Layers by Lipid Transfer from Vesicles Studied by QCM- D and TOF-SIMS,” Journal of the American Chemical Society, Vol. 131, 2009, p. 2450. [6] K. Giger, E. R. Lamberson and J. S. Hovis, “Formation of Complex Three-Dimensional Structures in Supported Lipid Bilayers,” Langmuir, Vol. 25, 2009, pp. 71-74. [7] M. Tanaka and E. Sackmann, “Polymer-Supported Mem- branes as Models of the Cell Surface, ” Nature, Vol.437 , 2005, pp, 656-663. [8] R. P. Richter, J. L. K. Him, B. Tessier, C. Tessier and A. R. Brisson, “On the Kinetics of Adsorption and Two- Dimensional Self-Assembly of Annexin A5 on Supported Lipid Bilayers,” Biophysical Journal, Vol. 89, 2005, pp. 3372-3385. [9] G. S. Mack, “Pfizer dumps Exubera,” Nature Biotech- nology, Vol. 25, 2007, pp. 1331-1332. [10] C. Schatz, J.M. Lucas, C. Viton, A. Domard, C. Pichot and T. Delair, “Formation and Properties of Positively Charged Colloids Based on Polyelectrolyte Complexes of Biopolymers,” Langmuir, Vol. 20, 2004, pp. 7766-7778. [11] S. M. Hartig, R. R. Greene, M. M. Dikov, A. Prokop and J. M. Davidson, “Multifunctional Nanoparticulate Polye- lectrolyte Complexes,” Pharmaceutical Research, Vol. 24, 2007, pp 2353-2369. [12] D. R. Owens, B. Zinman and G. B. Bolli, “Insulins Today and beyond,” Lancet, Vol. 358, 2001, pp. 739-746. [13] M. Edvardsson, S. Svedhem, G. Wang, R. Richter, M. Rodahl and B. Kasemo, “QCM-D and Reflectometry In- strument: Applications to Supported Lipid Structures and Their Biomolecular Interactions,” Analytical Chemistry, Vol. 81, 2009, pp. 349-361. [14] M. J. Hope, M. B. Bally, G. Webb and P. R. Cullis, “Pro- duction of Large Unilamellar Vesicles by a Rapid Extru- sion Procedure. Characterization of Size Distribution, Trapped Volume and Ability to Maintain a Membrane Potential,” Biochimica Et Biophysica Acta, Vol. 812, 1985, pp. 55-65. [15] A. Kunze, S. Svedhem and B. Kasemo, “Lipid Transfer between Charged Supported Lipid Bilayers and Oppo- sitely Charged Vesicles,” Langmuir, Vol. 25, 2009, pp. 5146- 5158. [16] R. P. Richter, R. Bérat and A. R. Brisson, “Formation of Solid-Supported Lipid Bilayers: An Integrated View,” Langmuir, Vol. 22, 2006, pp. 3497-3505. [17] G. Wang, M. Rodahl, M. Edvardsson, S. Svedhem, G. Ohlsson, F. Höök and B. Kasemo, “A Combined Reflec- tometry and Quartz Crystal Microbalance with Dissipa- tion Setup for Surface Interaction Studies,” Review of Scientific Instruments, Vol. 79, 2008, Article ID, 075107. [18] Z. Salamon and G. Tollin, “Optical Anisotropy in Lipid Bilayer Membranes: Coupled Plasmon-Waveguide Reso- nance Measurements of Molecular Orientation, Polariza- bility, and Shape,” Biophysical Journal, Vol. 80, 2001, pp. 1557-1567. [19] E. Reimhult, F. Hook and B. Kasemo, “Intact Vesicle Adsorption and Supported Biomembrane Formation From Vesicles in Solution: Influence of Surface Chemistry, Vesicle Size, Temperature, and Osmotic Pressure,” Lang- muir, Vol. 19, 2003, pp. 1681-1691. [20] D. Johannsmann, “Viscoelastic, Mechanical, and Dielec- tric Measurements on Complex Samples with the Quartz Crystal Microbalance,” Physical Chemistry Chemical Physics, Vol. 10, 2008, pp. 4516-4534. [21] M. V. Voinova, M. Jonson and B. Kasemo, “Missing Mass Effect in Biosensor’s QCM Applications,” Biosen- sors & Bioelectronics, Vol. 17, 2002, pp. 835-841. [22] R. P. Richter, K. K. Hock, J. Burkhartsmeyer, H. Boehm, P. Bingen, G. L. Wang, N. F. Steinmetz, D. J. Evans and J. P. Spatz, “Membrane-Grafted Hyaluronan Films: A Well-Defined Model System of Glycoconjugate Cell Coats,” Journal of the American Chemical Society, Vol. 129, No. 17, 2007, pp. 5306-5307. [23] B. Wang, L. F. Zhang, S. C. Bae and S. Granick, “Nanoparticle-Induced Surface Reconstruction of Phos- pholipid Membranes,” Proceedings of the National Acad- emy of Sciences of the United States of America, Vol. 105, 2008, pp. 18171-18175. C opyright © 2011 SciRes. JBNB  Structural Rearrangements of Polymeric Insulin-loaded Nanoparticles Interacting with Surface-Supported Model Lipid Membranes Copyright © 2010 SciRes. JBNB 191 [24] J. Solon, P. Streicher, R. Richter, F. Brochard-Wyart and P. Bassereau, “Vesicles Surfing on a Lipid Bilayer: Self-Induced Haptotactic Motion,” Proceedings of the National Academy of Sciences of the United States of America, Vol. 103, 2006, pp. 12382-12387. [25] P. R. Leroueil, S. A. Berry, K. Duthie, G. Han, V. M. Rotello, D. Q. McNerny, J. R. Baker, B. G. Orr and M. M. B. Holl, “Wide Varieties of Cationic Nanoparticles In- duce Defects in Supported Lipid Bilayers,” Nano Letters, Vol. 8, 2008, pp. 420-424. [26] E. Reimhult, F. Hook and B. Kasemo, “Vesicle Adsorp- tion on SiO2 and TiO2: Dependence on Vesicle Size,” Journal of Chemical Physics, Vol. 117, 2002, pp. 7401- 7404. [27] J. Fatisson, R. F. Domingos, K. J. Wilkinson and N. Tufenkji, “Deposition of TiO2 Nanoparticles onto Silica Measured Using a Quartz Crystal Microbalance with Dis- sipation Monitoring,” Langmuir, Vol. 25, 2009, pp. 6062- 6069. [28] I. K. Vockenroth, P. P. Atanasova, J. R. Long, A. T. A. Jenkins, W. Knoll and I. Koper, “Functional Incorpora- tion of the Pore Forming Segment of AChR M2 into Tethered Bilayer Lipid Membranes,” Biochimica Et Bio- physica Acta-Biomembranes, Vol. 1768, 2007, pp. 1114- 1120.  Structural Rearrangements of Polymeric Insulin-loaded Nanoparticles Interacting with Surface-Supported Model Lipid Membranes 192 Supplementary Data Results and discussion Formation of Supported Lipid Bilayers The formation of supported lipid bilayers serves as a good illustration of the type of information that can be obtained from the two measured QCM-D responses (the resonance frequency shift (Δf) and the dissipation shift (ΔD)) and the combination with an optical surface sensi- tive technique (Figure S1). The frequency shift is a measure of mass adsorbed to the sensor surface (de- creasing frequency means increasing mass), and the dis- sipation shift is a measure of the viscoelastic properties of the adsorbed layer (increasing dissipation means more viscoelastic or more loosely bound structures on the sur- face). The frequency shift/mass change includes medium (buffer) which is associated with and acoustically cou- pled to the adsorbed material, e.g. inside or between ad- sorbed vesicles. This is in contrast to optical techniques, which measure effective changes in refractive index. When liposomes (under the present conditions) are ad- sorbed to a SiO2 surface, they first attach, temporarily, as intact liposomes, causing a large decrease in frequency (i.e. mass increase at the surface) and a high dissipation (indicating a viscoelastic structure) (Figure S2(a)). At a (a) (b) Figure S1. (a) QCM-D (z = 7) and (b) reflectometry data measured simultaneously during formation of a POPC: POPS (3:1) bilayer from vesicles on a SiO2-surface. (a) (b) Figure S2. (a) QCM-D results (frequency shift and dissipa- tion shift as functions of time) from experiments where a negatively charged bilayer (POPC:POPS (3:1)) was exposed to NP-HI of different concentrations (45 (x10), 5.6 (x80) and 1.1 (x400) μg/ml). The plot shows a sequence of events in- cluding (1) basekine in buffer, (2) addition of NP-HI and (3) buffer rinse. The bilayer formation and buffer exchange are omitted from the plot. (b) shows a different representation of the results in (a); the vertical axis is the same but the time axis has been replaced by exposure, i.e. time multiplied by concentration and flow rate. Since higher concentrations allow higher exposure values to be reached in a reasonable time, the curve for the lowest NP-HI concentration termi- nates at the lowest exposure and the highest concentration curve terminates at the highest exposure value. certain surface coverage, the liposomes will, due to a combination of their surface interaction and inter-vesicle interactions, start to rupture and fuse, leading to release of encapsulated liquid medium (buffer). This causes an increase in frequency (mass loss) and a decrease in dis- sipation. After a few minutes, a completed supported C opyright © 2011 SciRes. JBNB  Structural Rearrangements of Polymeric Insulin-loaded Nanoparticles Interacting with Surface-Supported Model Lipid Membranes 193 lipid bilayer has formed. Under the present conditions, characteristic values of Δf and ΔD for a completed lipid bilayer of high quality are –26 Hz and 0.2, respectively. The reflectometry signal shows, in contrast to QCM-D, just a monotonic increase in mass throughout the forma- tion of the lipid bilayer (Figure S2(b)), and it is insensi- tive to changes in the amount of the lipid-associated sol- vent, i.e. the optical signal monitors only the amount of lipid on the surface, not its supramolecular structure (e.g. it does not discriminate between lipid molecules in vesi- cles or in a surface-confined planar bilayer). Various NP-HI Concentrations on POPC: POPS (3:1) Membranes From Figure S2(a), it is clear that the time scale of the binding kinetics in these QCM-D experiments changes significantly when the NP-HI concentration is varied. The initial NP-HI adsorption is linear in time, and the rate is proportional to the concentration of NP-HI, in accordance with a mass transport limited process. In Figure S2b the data are plotted as adsorbed mass versus NP-HI exposure (exposure time x concentration). In this way, it is possible to test if there are differences in e.g., structural rearrangements that influence the ob- served signals at the different time scales of the experi- ment. The main feature is that the data for different con- centrations coincide when plotted against exposure, in- dicating a time-independent process, up to certain cov- erage, i.e. the rearrangements and structures formed on the surface are the same at a given coverage, independent on the time scale during which this coverage has been established. However, there is a tendency for a slightly higher uptake, at a given exposure, for lower concentra- tions. C opyright © 2010 SciRes. JBNB
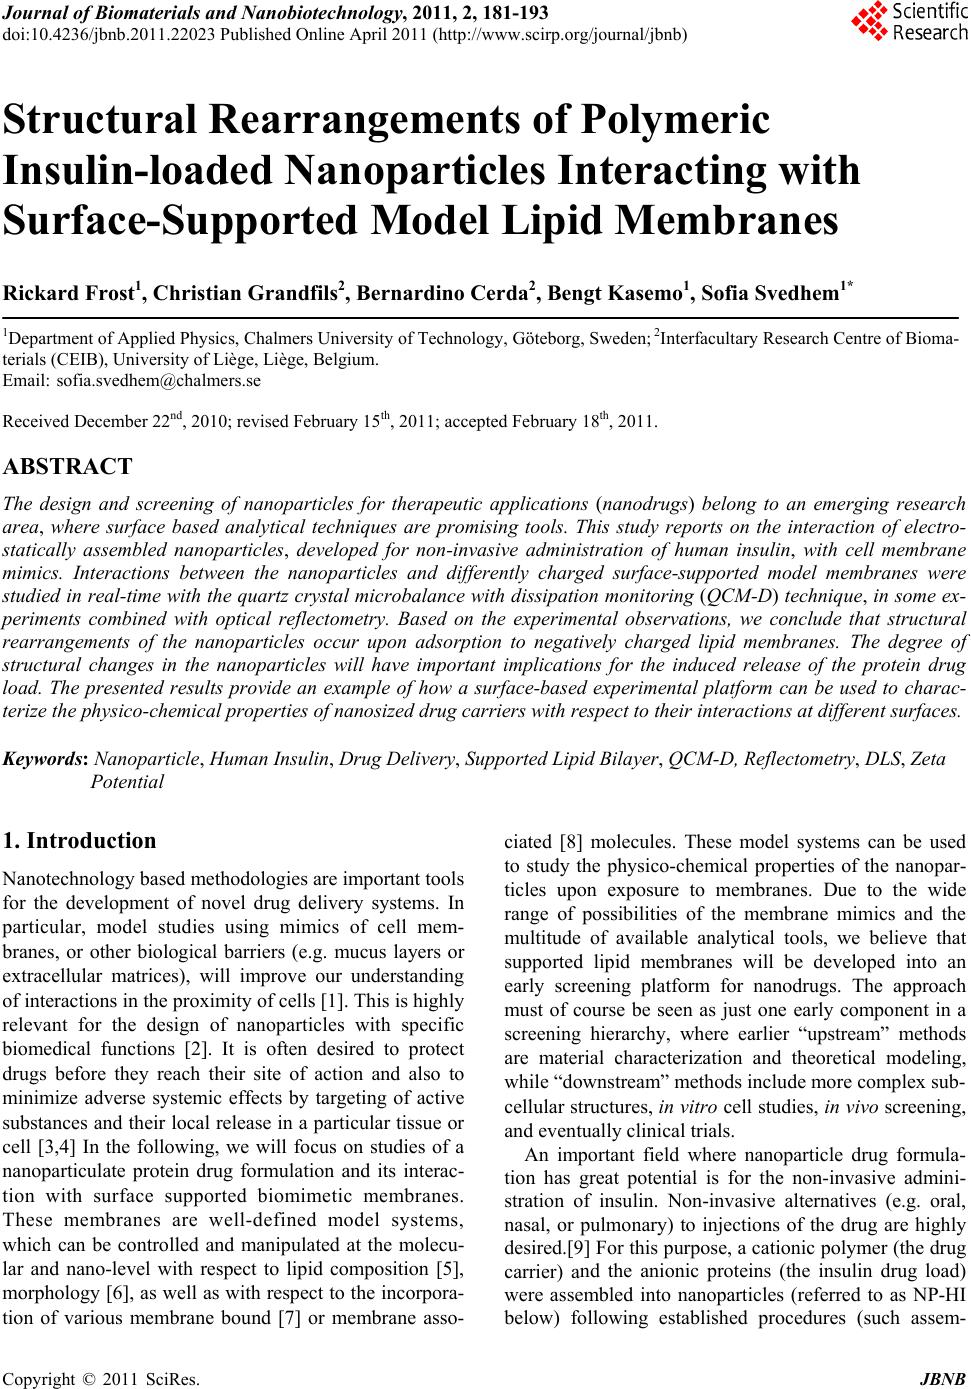
|