Social Networking, 2014, 3, 80-85
Published Online February 2014 (http://www.scirp.org/journal/sn)
http://dx.doi.org/10.4236/sn.2014.32010
OPEN ACCESS SN
Clique Approach for Networks: Applications for
Coauthorship Networks
Marcos Grilo Rosa1, Inácio de Sousa Fadigas1, Maria Teresinha Tamanini Andrade2,
Hernane Borges d e B arros Pereira3,4
1Universidade Estadual de Feira de Santana, Feira de Santana, Brazil
2Instituto Federal de Educação Ciência e Tecnologia, Simões Filho, Brazil
3Universidade do Estado da Bahia, Salvador, Brazil
4Programa de Modelagem Computacional, SENAI Cimatec, Salvador, Brazil
Email: gri l o@uefs.br, fadigas@uefs.br, tamanini@ifba.edu.br, hbbpereira@gmail.com
Received November 22, 2013; revised December 28, 2013; accepted February 6, 2014
Copyright © 2014 Marcos Grilo Rosa et al. This is an open access article distributed under the Creative Commons Attribution Li-
cense, which permits unrestricted use, distribution, and reproduction in any medium, provide d the original work is properly cited. In
accordance of the Creative Commons Attribution License all Copyrights © 2014 are reserved for SCIRP and the owner of the intel-
lectual property Marcos Grilo Rosa et al. A ll Copyright © 2014 are guarded by law and by SCIRP as a guardian.
ABSTRACT
Coauthorship networks consist of links among groups of mutually connected authors that form a clique. Classic-
al approaches using Social Network Analysis indices do not account for this characteristic. We propose two new
cohesion indices based on a clique approach, and we redefine the network density using an index of variance of
density. We have applied these indices to two coauthorship networks, one comprising researchers that published
in Mathematics Education journals and the other comprising researchers from a Computational Modeling
Graduate Program. A contextualized and comparative analysis was performed to show the applicability and po-
tential of the indices for analyzing social networks data.
KEYWORDS
Clique Networks; Cohesion Indices; Coauthorship
1. Introduction
Coauthorship networks are an example of social net-
works in which two authors are linked if they have writ-
ten an article together. Due to the low number of authors,
which is generally less than ten except for projects from
large research groups, coauthorship networks represent a
significant social involvement between authors. Because
they comprise mutually connected groups (groups of an
article’s authors), these networks can be modeled using
structures from graph theory known as cliques. Suppose
there is a graph G = (V,
ε
) with two sets: V, made of
vertices (or nodes), and
ε
, consisting of elements called
edges with one or two vertices connected to each [1]. A
subgraph with a cliqu e structure is the maximal sub set of
mutually adjacent vertices in G. For simple graphs
(without loops or multiple edges), such as the graphs
used in Social Network Analysis, a subgraph originating
from a clique is a complete graph by definition.
Several aspects of coauthorship networks have been
studied. For example, Katz and Martin [2] showed that
using coauthorship to evaluate scientific collaboration is
advantageous because, in addition to being invariant and
verifiable, it is a relatively practical and inexp ensive me-
thod. Similarly, although Vanz and Stump [3] distin-
guished between collaboration and coauthorship, desig-
nating coauthorship as one facet of scientific collabora-
tion, this distinction has not hindered the use of coau-
thorship to assess collaboration, especially in bibliome-
trics and scientometrics. In the broader field of Social
Network Analysis, where collaborations are treated as
complex networks, Newman [4-6] studied the structure
of scientific collaboration networks and found evidence
for the small-world phenomenon. Maia and Caregnato [7]
used degree centrality, betweenness centrality and close-
ness centrality to analyze a coauthorship network of pr o-
fessors in the Epidemiology graduate program at the
Federal University of Pelotas (Universidade Federal de
Pelotas—UFPel). Mello, Crubellate and Rossoni [8],
M. G. ROSA ET AL.
OPEN ACCESS SN
81
used density, number of components and centrality in
coauthorship networks constructed using data extracted
from the Lattes Platform to measure the level of collabo-
ration in Administration graduate programs (sensu stric-
to). These studies used classical Social Network Analysis
indices, es pecially centrality, to emphasize authors in the
network.
On the other hand, there are some papers on clique and
line graphs [9-11] that deal with the detection of com-
munities or clusters. Evans [9] provided a method of
community detection in networks based on line graphs.
The proposed clique and line graphs are weighted graphs
and of fixed order. Each vertex of the original graph is a
clique and network analysis centers on the edges rather
than the vertices as in the classical approach of Social
Network Analysis. Evans applied their method on several
networks of which we highlight co-authorship a network
and a network of teams of a football league.
This article, however, seeks to redefine the classical
concepts of density and show new cohesion indices for
networks comprising cliques, as defined by Fadigas and
Pereira [12], which will then be applied and interpreted
using co-authorship networks. Thus, we intend to inves-
tigate relationships between cliqu es and not just relations
between vertices (i.e. actors). The main cohesion index
used to characterize a network, i.e., density, is paramete-
rized by two extreme cases of network topology: a net-
work containing only vertices (density of 0) and a net-
work where all the vertices are mutually connected (cli-
que), i.e., a network with a density of 1. In networks such
as the ones involved in coauthorship, a topology with a
null density does not exist by definition (authors who
publish alone do not form coauthorships). At the other
extreme, it would be difficult for real coauthorship net-
works to exhibit a density of one, as it would imply that
all of the authors have published in collaboration with all
of the other authors in the network at least once.
2. Clique Approach for Networks
In this section, we present an original approach for ana-
lyzing networks whose basic elements are cliques, pro-
posing new cohesion indices and redefining classical
indices [12]. The approach is based on the notion that
initially isolated cliques form networks by juxtaposition
and/or superposition. Fadigas and Pereira [12] define
juxtaposition as th e proces s where two cliques are linked
by a single common vertex. The authors denote processes
where cliques are linked by two or more common vertic-
es by superposition.
Figure 1 shows an initial configuration of discon-
nected cliques, b efor e the juxtaposition and/or superposi-
tion process. Figure 2 shows an example of a network
formed by applying the processes of juxtaposition and/or
Figure 1. Initial configuration of disconnected cliques.
Figure 2. Formation of a clique network by juxtaposition
and superposition.
superposition to the initial configuration shown in Figure
1. The networks that result from these processes are
called clique networks, in reference to the basic compo-
nents that may or may not be connected.
3. Cohesion Index Based on a Clique
Approach
From the initial configuration of disconnected cliques
and the processes of juxtaposition and/or superposition
that create the clique network, Fadigas and Pereira [12]
propose two novel cohesion indices: normalized density
and variance of density. In this article, three additional
cohesion indices are introduced: edge superposition, ver-
tex reduction factor and component reduction factor.
3.1. Normalized Density and Variance of Densit y
One of the main cohesion indices for Social Network
Analysis is the density
( )
for undirected networks
with n vertices, which relates the number of edges in the
network
()
ε
to the maximum possible number of
edges, given by (
( )
12nn
). The density
( )
of a
network is an index that varies from 0 to 1. When
0∆=
,
the network is totally disconnected and does not ade-
quately reflect the initial configuration of disconnected
cliques (Figure 1). The density of the initial configura-
tion of disconnected cliques can be calculated using the
following expression:
M. G. ROSA ET AL.
OPEN ACCESS SN
82
( )
000
2
1
q
nn
ε
∆=
(1)
where n0 is the number of vertices in the initial configu-
ration of disconnected cliques. Fadigas and Pereira [12]
proposed a more appropriate normalization for density in
clique networks, denoted as the normalized density
( )
norm
:
0
0
1
q
norm q
∆−∆
∆=
−∆
(2)
when
0
norm
∆=
, the actual network is equivalent to the
initial configuration of disconnected cliques. Fadigas and
Pereira [12] also proposed the variance of density
( )
()v
,
which measures the densification of the network com-
pared to the initial configuration of disconnected cliques
and can be calculated by the following expression:
( )
[]
2
20
0
2
00
11
nn
n
vn
ε
εεε
∆≅× −=−


(3)
3.2. Edge Superposition
The variance of density depends on both the relationship
between the edges and the relationship between the ver-
tices. Therefore, it does not directly quantify clique su-
perposition. is a superposition rate that compares the
number of edges in the initial configuration of discon-
nected cliques with the number of edges after juxtaposi-
tion and/or superposition. This rate is defined by Equa-
tion (4) and is applicable to both connected and discon-
nected networks.
0
0 max
R
ε
εε
εε
=
(4)
In the above equation,
max
ε
is the number of edge s in
the largest clique present in the initial configuration of
disconnected cliques. A superposition value of 0 occurs
when
0
εε
=
and, therefo re, there is no superposition of
the edges, although juxtaposition may (or may not) occur.
A superposition value of 1 occurs when
max
εε
=
, i.e.,
when the network comprises only the largest clique.
3.3. Vertex Reduction Factor
In parallel to
R
ε
for the superposition of edges, (RV) is
a factor that measures the vertex juxtaposition rate and
can be used to compare the number of vertices in the
initial configuration of disconnected cliques with the
number of vertices in the network resulting from juxta-
position and/or superposition. The difference between the
number of vertices in the initial configuration of discon-
nected cliques and the number of vertices resulting from
the juxtaposition and/or superposition processes shows
how many vertices are shared between the two cliques,
and it can be parameterized by the number of vertices in
the resulting network. Symbolically, again denoting the
number of vertices in the initial configuration of discon-
nected cliques by n0, the number of vertices in the largest
clique of the initial configuration of disconnected cliques
by nmax and the number of vertices in the network after
the juxtaposition and/or superposition processes by n, we
obtain
0
0 max
v
nn
Rnn
=
(5)
The index varies from 0 to 1. A null value occurs
when n = n0, i.e., when there is no juxtaposition or su-
perposition. The maximum value, 1, occurs when the
network comprises only the largest clique in the initial
configura tion.
3.4. Component Reduction Factor
We observed in Section 3.1 that the number of cliques is
represented by nq in the initial clique configuration. We
consider this number to be the number of “components”
in the initial configuration. Thus, it is also possible to
quantify the reduction in the number of components as a
measure of the network cohesion. Therefore, the compo-
nent reduction (RC) measures how often cliques from the
initial configuration are connected to form larger com-
ponents, consequently reducing their number. It is nor-
malized in the same way as the previous indices, using
the minimum number of components that can result as
the base, which is 1. Considering that nq can be defined
as the number of components in the initial configuration
of disconnected cliques, let CC be the number of compo-
nents in the network. Thus, the factor can be expressed as
follows
1
qC
Cq
nC
Rn
=
(6)
The values for RC vary from 0 to 1. A value of 0 oc-
curs when there is no juxtaposition or superposition.
Conversely, a value of 1 results when the network is
connected.
4. Application to Coauthorship Networks
After defining the indices using this new approach, we
chose two coauthorship networks to calculate and interp-
ret the indices. One of the networks consists of authors
who published in six Mathematics journals, which we
grouped under the name of Mathematics Education jour-
nals. The other network consists of researchers in a
computational modeling graduate program.
The coauthorship networks were constructed so that
each group of coauthors is mutually connected, and each
M. G. ROSA ET AL.
OPEN ACCESS SN
83
group is connected to another if they have at least one
author in common. To interpret coauthorship as a type of
collaboration, we excluded from the network authors
who only published alone. We should note that the ME
and GP networks have 1000 and 795 vertices and 572
and 11 components, respectively, before authors who
published alone were excluded. Figures 3(a) and (b)
show the networks, and Table 1 summarizes some prop-
erties for the networks .
5. Results and Interpretation
As the indices from our clique approach were applied to
(a)
(b)
Figure 3. Coauthorship networks: (a) ME Network, where
the thickness of the edges is proportional to the number of
studies published by the corresponding pair of vertices; (b)
GP Network, with the thickness of the edges calculated as
described above. (a) ME Network; (b) GP Network.
Table 1. Basic properties of the ME and GP networks.
Properties ME network GP network
Number of vertices (n) 588 792
Number of authors 1751 3234
Author/vertex ratio 2.9779 4.083
Components 160 8
Largest component (%) 7.14 90.28
Coauthored publications 944 1030
Mean clique size 1.85 2.97
only two networks, we performed an interpretive analysis
of the new indices proposed here and compared the two.
Table 1 shows that the ME and GP networks possess
numbers of vertices of the same order of magnitude (588
and 792, respectively). The same is true for the number
of coauthored publications (944 and 1030, respectively).
However, the number of authors in the GP Network,
represented by the number of vertices in the initial con-
figuration of the discon nec ted cliques , is almost twice the
number of authors in the ME Network. One significant
difference between the networks is the relative size of the
largest component, i.e., the largest group of intercon-
nected authors in the network. For the ME Network, the
largest group contains only approximately 7% of the au-
thors; however, this number is approximately 90% in the
GP Network. This difference is due to th e distinct nature
of the two networks: while the ME Network contains
authors who publish in six distinct journals, the GP Net-
work comprises only researchers who are part of the
same graduate program. However, despite the distinct
nature of the Mathematics Education journals, they form
the corpus of publications on the field, and the relatively
small number of authors in a single group allows little
collaboration, in terms of coauthorship.
The cohesion indices calculated for the two networks
are shown in Table 2. The density (binary) is calculated
without accounting for the number of times that a pair of
authors published together, while the valued density does
account for repeated joint publications.
The ratio between the two numbers provides the mean
number of publications per pair and reflects how often
authors publish together. Table 2 shows that, in the ME
Network, each pair published once, on average, while the
mean is nearly two in the GP Network.
The variance of density measures the “densification”
of the network, i.e., how much the groups of coauthors
coalesce, either in isolation or in pairs, when the network
is formed. The index measures the variance of the vertic-
es and the edges simultaneously, compared to the initial
Table 2. Cohesion indices using a clique a pproach.
Properties ME network GP network
Density (binary)
( )
0.0037 0.0073
Density (valued)
( )
valued
0.0040 0.0135
valued
∆∆
1.1029 1.8554
Normalized density
( )
norm
0.0036 0.0127
Variance of density
( )
( )
v
7.8784 15.4440
Edge superposit ion
( )
R
ε
0.0972 0.5189
Vertex reduction factor
( )
v
R
0.6672 0.7857
Component reduction factor
( )
C
R
0.8736 0.9936
M. G. ROSA ET AL.
OPEN ACCESS SN
84
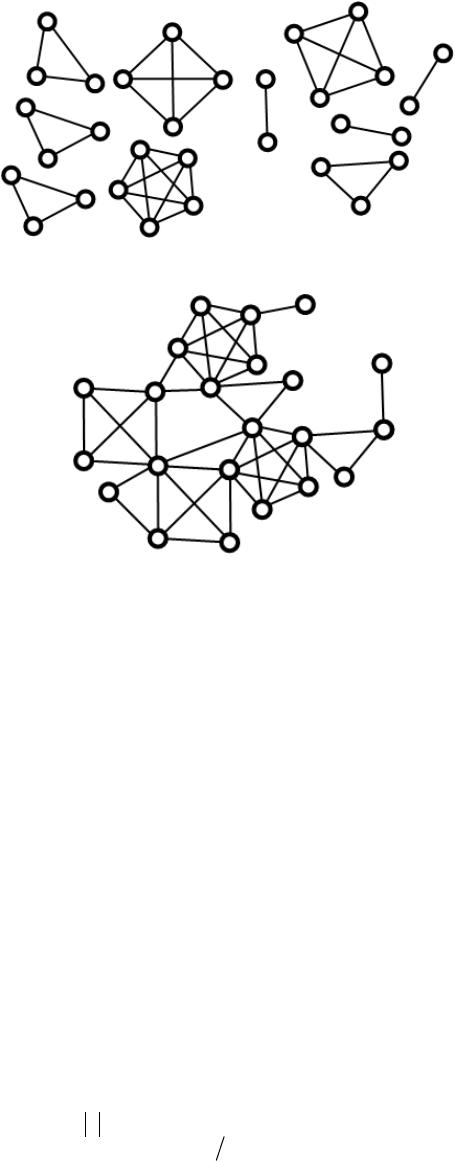
configuration of disconnected cliques. The results in
Table 2 show that the GP Network displays a higher
variance of density index score higher than the ME Net-
work. The theoretical maximum value for the variance of
density occur s when the network becomes a single clique,
i.e., all of the vertices are mutually connected. For the
ME Network, this maximum value is approximately
2200, and thus the value found herein (7.8784) corres-
ponds to only 0.4% of the maximum. In the case of the
GP Network, the maximum variance of the density is
1223, and the measured value (15.4440) is 1.3% of the
maximum. Comparatively, it can be stated that the GP
Network is more than threefold “densified” compared to
the ME Network. The variance of density index reflects
the coalescence of the authors that published alone but
also as coauthors (reduction of vertices without a reduc-
tion in the number of edges) in relation to the coales-
cence of pairs that published as coauthors (simultaneous
reduction of vertices and edges). To more precisely de-
termine what type of situation predominates in the net-
work, the superposition of edges and the vertex reduction
factor can be used.
The superposition of edges determines the proportion
of coauthor pairs in common; i.e., it is an index that
measures relationships, represented by the edges in the
network. The superposition of approximately 10% in the
ME Network indicates that few pairs of authors pub-
lished together more than once, unlike the GP Network,
where 52% of the pairs have more than one publication
together. This index, therefore, shows that there is more
scientific production by pairs of authors in the GP Net-
work than in the ME Network.
The vertex reduction factor, in turn, is directly related
to the author/vertex ratio in Ta bl e 1 . This index indicates
the percentage of authors with more than one publication.
The values obtained for the ME and GP networks indi-
cate that the researchers in the GP network display higher
individual productivity.
The values of the component reduction factor for the
two networks do not differ. Although the ME Network
has 160 components compared to only 08 for the GP
Network , the percentage difference is approximately
12%. However, almost all of the coauthorship groups
shared at least one vertex in common (link) in the GP
Network (99.4%), while a value of 87.4% was observed
in the ME Network.
6. Final Considerations
The clique approach in coauthorship networks allows the
social data to be analyzed in a way that is well suited for
the network topological structure. Network analysis us-
ing cohesion indices already allows new interpretations.
For example, considering the index that measures edge
superposition together with the vertex reduction factor
allowing us to clarify h ow the juxtaposition an d superpo-
sition processes create the network. Thus, we observed
that superposition predominated in the GP Network
compared to the ME Network. This effect also occurred
with the vertex reduction factor, but to a lesser extent.
These aspects result in a greater “densification” of the
GP Network, mostly due to the large number of pairs of
authors who have written more than one study together.
These results are consistent with the fact that the GP
Network comprises researchers connected through the
same research institution, while the ME Network in-
cludes researchers who may have stronger ties within
their own groups, but this collaboration is not shown
through their publication in jou rn a ls of the field .
The initial research us ing cohes ion indices showed that
other indices could potentially be added, and the dynam-
ics of network growth could be evaluated. Another aspect
that we emphasize is the applicability of the clique ap-
proach to other social networks with a similar structure,
such as actor-movie networks.
Finally, it is important to comment that th is work is an
ongoing research and initially it was published in the
proceedings of the 1st Brazilian Workshop on Social
Network Analysis and Mi ning [13].
REFERENCES
[1] J. L. Gross and J. Yellen, “Graph Theory and Its Applica-
tions. Discret Mathematics and Its Applications,” CRC
Press, Boca Raton, 2003.
[2] J. S. Katz and B. R. Martin, “What Is Research Collabo-
ration?” Research Policy, Vol. 26, N o . 1 , 1997, pp. 1-18.
http://dx.doi.org/10.1016/S0048-7333(96)00917-1
[3] S. A. d. S. Vanz and I. R. C. Stump, “Scientific Collabo-
ration: A Theoretical-Conceptual Review,” Perspectivas
em Ciência da Informação, Vol. 15, No. 2, 2010, pp. 42-
55. http://dx.doi.org/10.1590/S1413-99362010000200004
[4] M. E. J. Newman, “The Structure of Scientific Collabora-
tion Networks,” Proceedings of the National Academy of
Sciences, Vol. 98, No. 2, 2001, pp. 404-409.
http://dx.doi.org/10.1073/pnas.98.2.404
[5] M. E. J. Newman, “Scientific Collaboration Networks. I.
Network Construction and Fundamental Results,” Physi-
cal Review E, Vol. 64, No. 1, 2001, Article ID: 016131.
[6] M. E. J. Newman, “Scientific Collaboration Networks. II.
Shortest Paths, Weighted Networks, and Cen trality,” Phy-
sical Review E , Vol. 64, No. 1, 2001, Article I D: 016132.
[7] M. F. Maia and S. E. Caregnato, “Co-Authorship as an
Indicator of Scientific Collaboration Network,” Perspec-
tivas em Ciência da Informação, Vol. 13, No. 2, 2008, pp.
18-31.
[8] C. M. Mello, J. M. Crubellate and L. Rossoni, “Coauthor
Networks between Brazilian Graduate Administration
Program Faculty (Strictu Sensu): Structural and Dynamic
Aspects of Relationships,” Perspectivas em Ciência da
Informação, Vol. 15, No. 2, 2009, pp. 42-55.
M. G. ROSA ET AL.
OPEN ACCESS SN
85
[9] T. S. Evans, “Clique Graphs and Overlapping Communi-
ties,” Journal of Statistical Mechanics: Theory and Expe-
riment, Vol. 2010, 2010, Article ID: P12037.
http://dx.doi.org/10.1088/1742-5468/2010/12/P12037
[10] T. S. Evans and R. Lambiotte, “Line Graphs of Weighted
Networks for Overlapping Communities,” The European
Physical Journal B, Vol. 77, No. 2, 2010, pp. 265-272.
http://dx.doi.org/10.1140/epjb/e2010-00261-8
[11] T. S. Evans and R. Lambiotte, “Line Graphs, Link Parti-
tions, and Overlapping Communities,” Physical Review E,
Vol. 80, No. 1, 2009, Article ID: 016105.
http://dx.doi.org/10.1103/PhysRevE.80.016105
[12] I. S. Fadigas a nd H. B. B. Pereira, “A Network Approach
Based on Cliques,” Physica A: Statistical Mechanics and
its Applications, Vol. 392, No. 10, 2013, pp. 2576-2587.
[13] M. G. Rosa, I. S. Fadigas, M. T. T. Andrade and H. B. B.
Pereira, “Clique Approach for Networks: Applications for
Coauthorship Networks,” Proceedings of the Brazilian
Workshop on Social Network Analysis and Mining, XXXII
Congress of the Brazilian Computer Society Computer
Society, Curitiba, 2012.