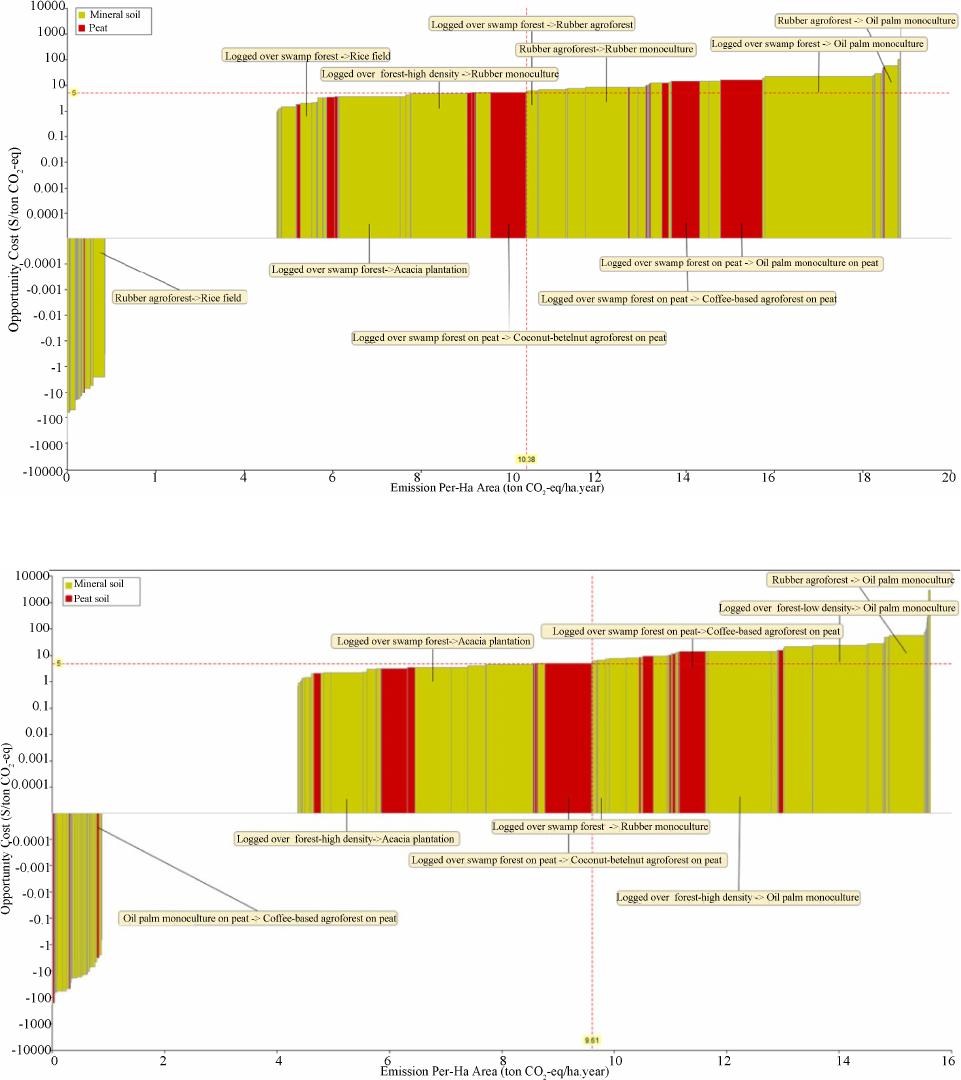
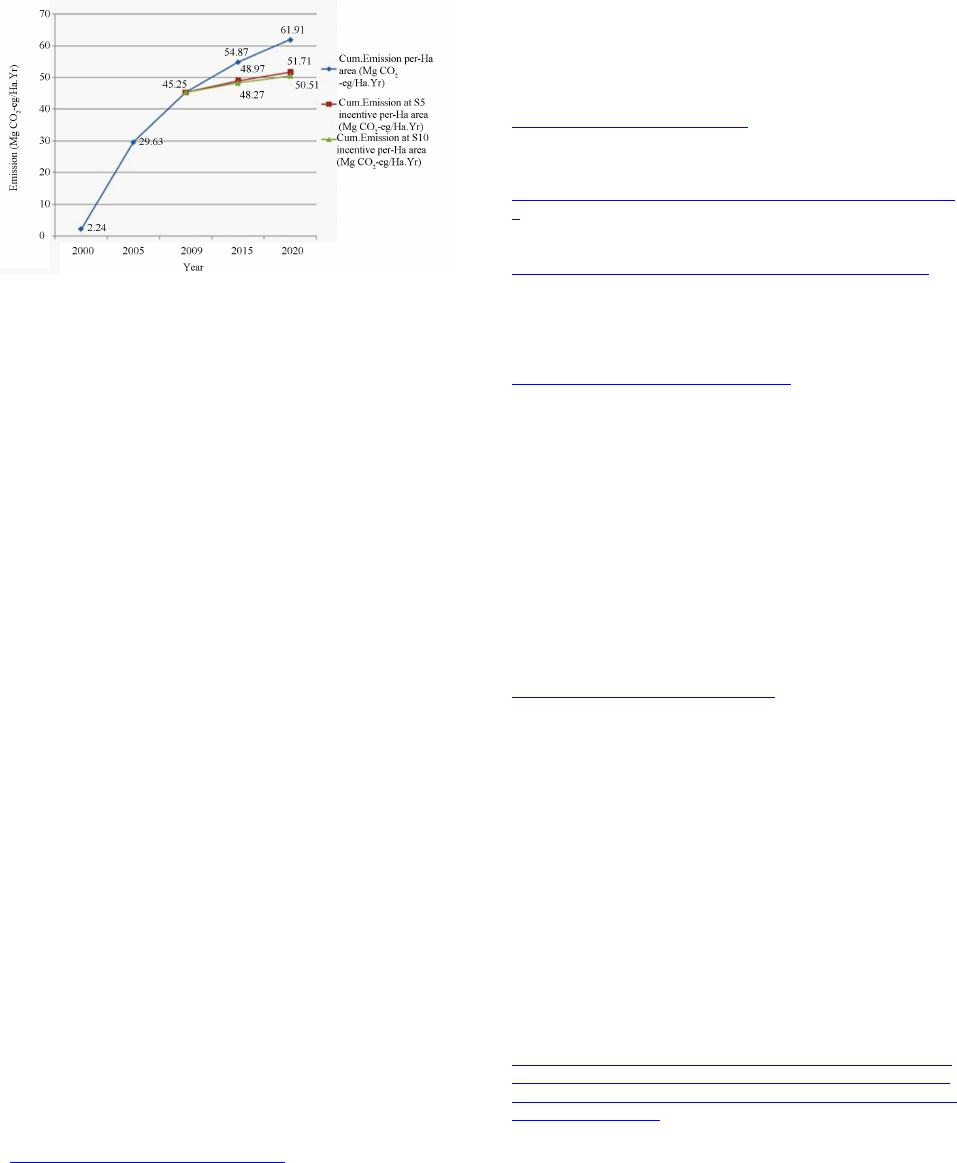
Open Journal of Forestry
2014. Vol.4, No.1, 85-90
Published Online January 2014 in SciRes (http://www.scirp.org/journal/ojf) http://dx.doi.org/10.4236/ojf.2014.41013
Opportunity Costs of Emissions Caused by Land-Use Changes
S. Suyanto, Andree Ekadinata, Muhammad Sofiyuddin, Arif Rahmanullah
World Agroforestry Center (ICRAF Southeast Asia Program), Bogor, Indonesia
Email: suyanto@cgiar.org
Received October 16th, 2013; revised November 21st, 2013; accepted December 14th, 2013
Copyright © 2014 S. Suyanto et al. This is an open access article distrib uted under the Creative Commons At-
tribution License, which permits unrestricted use, distribution, and reproduction in any medium, provided the
original work is properly cited. In accordance of the Creative Commons Attribution License all Copyrights ©
2014 are reserved for SCIRP an d the owner of the intellectual p roperty S. Suyanto et al. All Copyright © 2014
are guarded by law and by SCIRP as a guardian.
Amid the euphoria of Reducing Emissions from Deforestation and Forest Degradation (REDD) and
REDD+ discussions, the expectations of large financial gains raise the interest of all. A country, how ever,
will only enjoy REDD benefits if the cost of REDD is lower than the benefit. The opportunity cost analy-
sis is an effective tool for assessing the feasibility of REDD+ since the largest portion of costs associated
with REDD+ and can help to identify fair compensation for those who change their land use. The oppor-
tunity cost analysis has been exercised in Tanjung Jabung Barat (Tanjabar) district-Indonesia to examine
the economic-feasibility of carbon emission reduction under different type carbon price scenarios. This
study reveals a sharp decline of land-use systems with high carbon-stock and low profitability is obvious.
On mineral soil, low carbon-stock and high profitability (mostly oil palm) has increased rapidly, espe-
cially in the period 2000-2009. It has become the dominant land-use system. The low-to-medium carbon
stock and medium profitability land-use category increased from 1990 to 2005 but declined from 2005 to
2009. The low carbon-stock and low profitability category was constant and the proportion of the area
was below 15%. The ex-ante analysis in predicting the potential for future emissions reduction in Tanja-
bar through REDD+ approaches shows that the cumulative emission of Tanjabar in 2020 is estimated at
61.91 Mg CO2-eq/Ha.Year, while the reduced emission by excluding all land use conversion below $5
threshold is estimated at 51.71 Mg CO2-eq/Ha.Year. This means that there is a potential for 16% emission
reduction using $5/ton CO2-eq incentive. Another important finding in this study is that if the price of car-
bon increases by double to $10, the amount of reduced emission does not change much. This can use as a
basis for determining the right amount of incentive for trade-off between economic profitability and cli-
mate change mitigation effort in Tanjabar using REDD+ scheme both at seller and buyer perspectives.
Keywords: Opportunity Cost; Land Use Change; Carbon Emission; REDDS
Introduction
Amid the euphoria of REDD and REDD+ discussions, the
expectations of large financial gains raise the interest of all.
This expectation seems reasonable as indicating by the value of
REDD projects that reached USD 87 million and A/R projects
USD 65 million in 2011, and where transaction volume reached
significantly to 7.3 MtCO2e for REDD projects and 7.6 MtCO2e
for A/R projects (Ecosystem Marketplace & Bloomberg New
Energy Finance, 2012). Globally, the growth of world carbon
market has increased by 11% in 2011, to $176 billion (World
Bank, 2012).
REDD+ emerges as promising incentive mechanism for
tropical forest protection (Huettner, 2011). Such effort requires
sustained financial incentives, which go beyond positive incen-
tives for reduced emissions but also give incentives for sus-
tainable forest management (Mollicone et al., 2007). A country
will only enjoy REDD benefits if the cost of REDD is lower
than the benefit. White and Minang (2011) grouped the cost
into three categories as follow (1) Opportunity cost (2) Imple-
mentation cost and (3) Transaction cost.
White and Minang (2011) argued that their analysis was fo-
cusing on opportunity costs because they will (1) be the la rgest
portion of costs associated with REDD+; (2) provide insight
into the drivers of deforestation; (3) help to understand impact;
and (4) help to identify fair compensation for those who change
their land use.
According to Pagiola et al. (2009), opportunity costs are usu-
ally the single most important category of costs a country
would incur if it reduced its rate of forest loss to secure REDD
payments. It represents the highest alternative land-use of the
area under deforestation threat, including net revenue from the
conversion itself (Böttcher et al., 2009).
To estimate the opportunity cost of forgone land use, we can
approach at the local or micro level of return to land. By this
approach, Greig-Gran (2008) revealed that opportunity cost will
depend on (1) Type of land use for which the forest lands are
appropriate; (2) Soil and climate conditions which in turn affect
yields ; (3) Scale of operation—small, medium, large; (4) Inputs
and technology and (5) Distance from the market and quality of
transport infrastructure. Other factors affecting the opportunity
cost are the assumption of labour cost, agricultural commodities
price and discount rate and time horizon used in the estimation.
Huettner et al. (2011) emphasized that the opportunity costs
might change over time. It might rise because of agricultural
land scarcity due to the implementation of REDD+ in combina-
OPEN ACCESS 85
S. SUYANTO ET AL.
tion with future growing demand for forestry and agricultural
products (Sohngen & Beach, 2006). In this way, incentive
payments need to be at a very high level to be effective against
deforestation (Kindermann, 2006).
Method
The method used in this study followed the manual for esti-
mating the opportunity cost of REDD+ published by the World
Bank Institute and the REDD-Abacus software developed by
the World Agroforestry Centre (Harja et al., 2011). There were
four steps in the analysis (1) Clarification and description of
major land uses; (2) Calculation of time-averaged carbon stock
for the major land uses; (3) Calculation of the private profit-
ability of the land uses in terms of discounted net present value;
and (4) Developing the opportunity cost curve using the
REDD-Abacus software. The opportunity cost curve shows the
comparison of the opportunity costs of many different types of
land-use change in USD per ton CO2e and shows the quantity of
potential emissions reduction per type of land-use change. The
opportunity cost curve does not specify who will have to be
paid how much to avoid (abate) emissions, but does provide
estimates of the average and marginal opportunity costs of
emission reduction (Swallow et al., 2007).
The formula to calculate the opportunity cost in USD/ton
CO2e was:
Time2 Time1
Time1 Time2
NPV NPV
3.67 CstockCstock
×−
where NPVTime2 is net present value in at time 2 measurement,
NPVTime1 net present value in at time 1 measurement, Cstock-
Time1 is carbon stock at time 1 measurement, and CstockTime2
is carbon stock at time 2 measurement.
Assumptions and Limitation
This study employs private net present value (NPV) as the
measure of return to land. Gittinger (1992) defined the NPV,
the present worth of benefit less the present worth of the cost of
tradable inputs and domestics factors of productions.
The study assumed that conversion cost benefit to be similar
for each land-use transition type. The profitability of logging is
assumed as a benefit of forest degradation (conversion from
undisturbed forest to logged-over forest). This study also
counted aboveground emissions while belowground/peat emis-
sions not yet included. Forward-looking analysis used in this
study is based on stationary transition probability matrix, no
REDD+/policy scenario included yet. Carbon price for emis-
sion reduction was USD 5/tCO2e.
Study Site
This study was conducted in Tanjung Jabut Barat (Tanjabar)
district, Jambi province of Indonesia (Figure 1). The district
has an area of 5010 km2 (BPS, 2011), where about 48% is for-
ested lands. The district has unique historical land use as well
as the existence of wide peat land area has attracted researchers
to study.
Result and Discussion
Trade-Off Curves of Different Land-Use Systems
Figure 2 shows a trade-off between carbon stock and profit-
ability of land uses on mineral soil and peatland. There are four
clusters (listed below) and a couple of land uses outside the
clusters which have low NPV and medium profitability: (1)
High carbon-stock and low profitability; (2) Medium carbon
Figure 1.
Location of Tanjung Jabung Barat district, Jambi province, Sumatra, Indonesia
OPEN ACCESS
86
S. SUYANTO ET AL.
stock and medium profitability; (3) Low carbon-stock and high
profitability; and (4) Low carbon-stock and low profitability.
The land uses belonging to the high carbon-stock and low
profitability cluster were forest and logged over forest both on
mineral and peat. Agroforestry systems such as coconut-betel-
nut agroforests on mineral soil and coffee agroforests on peat
most likely belonged to low to medium carbon stock and me-
dium profitability. Large-scale and smallholder oil palm on
both mineral and peat were categorised as low carbon-stock and
high profitability.
Figures 3 and 4 show the changes of land-use configuration
in Tanjabar in terms of carbon stock and economic profitability.
Both on mineral and peat, a sharp decline of land-use systems
with high carbon-stock and low profitability was obvious. On
mineral soil, low carbon-stock and high profitability (mostly oil
palm) has increased rapidly, especially in the period 2000-2009.
It has become the dominant land-use system. The low-to-me-
dium carbon stock and medium profitability land-use category
increased from 1990 to 2005 but declined from 2005 to 2009.
The low carbon-stock, low profitability category was constant
and the proportion of the area was below 15%. Table 1 shows
Figure 2.
Clusters of land-use systems based on carbon stock and net present
value.
Figure 3.
Changes of land-use configuration in Tanjabar in terms of carbon
stock and economic profitability.
Table 1.
Carbon stock and net present value of land use systems in Tanjabar.
No Land-use system
Carbon stock1
(ton/ha ) Private NPV2
(USD/ha)
Mineral Peat Mineral Peat
1 Undisturbed forest 262 - - -
2 Logged over forest:
high density 193 - - -
3 Logged over forest:
low density 130 - - -
4
Undisturbed swamp
forest 193 193 - -
5 Logged over swamp
forest 141 141 - -
6 Undisturbed
mangrove 143 - - -
7 Logged over
mangrove 58 - - -
8 Rubber agroforest 58 58 1580 1481
9 Coffee based
agroforest 28 26 5722 5722
11 Acacia plantation 58 52 1040 1040
12 Rubber monoculture
41 41 2417 1747
13 Oil palm 40 39 7615 5866
14 Coconut betel nut
agro forest 32 32 2002 2002
15 Shrub 43 43 - -
16 Grass 3 3 - -
17 Other crops 10 10 595 595
18 Rice field 1 1 404 404
19 Cleared land 3 3 - -
20 Settlement 4 4 5787 5787
Note: 1Rahayu et al. (2011); 2Sofiyuddin et al. (2012).
the carbon stock and NVP that use for opportunity cost analysis.
On peat, low-to-medium carbon stock and medium profit-
ability land use increased sharply in the period 2000-2009. This
category was mostly agroforests and was the dominant land use
on peat soil. The low carbon-stock, high profitability category
also increased but the proportion of the area was still lower than
the low-to-m edium carbon stock, medium profitability category.
Retrospective Analysi s of O pp ortunity Cos ts for
Emission Reduction
Opportunity cost curves for Tanjabar in the periods 1990-
2000-2005-2009 are shown in Figures 5-7.
By examining the threshold of US dollars as the potential
price of 1 ton CO2 we can see how much emissions could have
been compensated or abated. During 1990-2000, emissions
below the threshold of USD5 were 4.49 ton CO2e/ha/year and
increased to 10.28 ton CO2e/ha/year for 2000-2005 (Figures 5
and 6). The increase of eligible emissions demonstrates the
higher emissions from conversion to lower NPV land uses.
OPEN ACCESS 87
S. SUYANTO ET AL.
Figure 4.
Land-use system changes in Tanjabar.
Figure 5.
Opportunity cost curve for T anjabar, 1990-2000.
During 2005-2009, the amount of emissions below the USD5
threshold decreased slightly to 9.53 ton CO2e/ha/year (Figure 7).
From the total annual emissions, the proportion of emissions
that could have been avoided in Tanjabar increased over the
period of analysis. For 1990-2000, the proportion was 42%, for
2000-2005 it was 58% and for 2005-2009 the proportion was
64%. These increasing figures demonstrate that emissions re-
duction efforts could have been successful. A higher proportion
of emissions could have been avoided with a similar price of
carbon. This also shows potential for future emissions reduction
in Tanjabar through REDD+ and Reducing Emmission from
All Land Used (REALU) approaches.
OPEN ACCESS
88
S. SUYANTO ET AL.
Figure 6.
Opportunity cost curve for Tanjabar, 2000-2005.
Figure 7.
Opportunity cost curve for T anjabar, 2005-2009.
Figure 8 showed potential emission reduction of Tanjabar in
2020, assuming that all emission with opportunity cost below
$5 can be avoided.
Cumulative emission of Tanjabar in 2020 is estimated at
61.91 Mg CO2-eq/Ha.Year, while the reduced emission by ex-
cluding all land use conversion below $5 threshold is esti-
mated at 51.71 Mg CO2-eq/Ha.Year. This means that there is a
potential for 16% emission reduction using $5/ton CO2-eq in-
centive. The $5 threshold is quite significant in the case of
Tanjabar. Even by increasing the threshold to $10, the amount
of reduced emission does not change much. This can be used as
a basis for determining the right amount of incentive for trade-
off between economic profitability and climate change mitiga-
tion effort in Tanjabar using REDD+/REALU scheme.
OPEN ACCESS 89
S. SUYANTO ET AL.
Figure 8.
Potential Emission reduction at $5 and $10 thre s hold.
Conclusion
The ex-ante analysis in predicting the potential for future
emission reduction through REDD+/REALU approaches shows
that t he cumulative emission of Tanjabar in 2020 is estimated at
61.91 Mg CO2-eq/Ha.Year. Based on retrospective analysis,
there is a potential for 16% emission reduction using $5/ton
CO2-eq incentive. However, if the the threshold is increased to
$10, the amount of reduced emission does not change much.
Large proportion of emission in Tanjabar cannot be com-
pensated through incentive mechanism since it will result in
large opportunity cost. This is a good example of many areas in
Indonesia where development activity, although it produces
large amount of emission, also has significant amount of prof-
itability that is important for local development. Insignificant
amount of potentially avoided future emission through incen-
tive mechanism indicates opportunities to derive policy inter-
vention toward low emission development strategy by con-
serving high carbon stock areas and focused development on
land with high carbon-high profitability through participative
approach such as land use planning.
Acknowledgemen ts
This publication is supported by the NORAD-funded project,
“Reducing Emissions from All Land Uses (REALU) and
CGIAR Research Progra m on Forests, Trees and Agrofore stry
Landscape Management (CRP-6.3). The authors would like to
thank the communities of Tanjung Jabung Barat district for
their generous hospitality and their patient participation in the
surveys and authors thank Robert Finlayson, ICRAF Regional
Communications Specialist for English editing.
REFERENCES
Böttcher, H., Eisbrenner, K., Fritz, S., Kindermann, G., Kraxner, F.,
McCallum, I., & Obersteiner, M. (2009). An assessment of monitor-
ing requirements and costs of Reduced Emissions from Deforesta-
tion and Degradation”. Carbon Balance and Management, 4, 7.
http://www.cbmjournal.com/content/4/1/7/
BPS (2011). Tanjung Jabung Barat Dalam Angka 2010. Jambi: Badan
Pusat Statistik Kabupaten Tanjung Jabung Barat.
Gittinger, J. P. (1982). Economic analysis of agricultural project (2nd
ed.). Baltimore: John Hopkins University Press.
Grieg-Gran, M. (2008). The cost of avoiding deforestation. London:
International Institute for Environment and Development (IIED).
http://pubs.iied.org/pdfs/G02290.pdf
Huettner, M. (2011). Risks and opportunities of REDD+ implementa-
tion for environmental integrity and socio-economic compatibility.
Environmental Science, 15, 4-12.
http://www.sciencedirect.com/science/article/pii/S146290111100152
3
Harja, D., Dewi, S., Van Noordwijk, M., Ekadinata, A., & Rahmanulloh,
A. (2011). REDD Abacus SP. User Manual and Software.
http://www.worldagroforestry.org/sea/projects/allreddi/softwares
Kindermann, G., Obersteiner, M., Sohngen, B., Sathaye, J., Andrasko,
K., Rametsteiner, E., Schlamadinger, B., Wunder, S., & Beach, R.
(2008). Global cost estimates of reducing carbon emissions through
avoided deforestation. Proceedings of the National Academy of
Sciences of the United States of America, 105, 10302-10307.
http://dx.doi.org/10.1073/pnas.0710616105
Kindermann, G., Obersteiner, M., Rametsteiner, E., & McCallum, I.
(2006). Predicting the deforestation-trend under different carbon-
prices. Carbon Balance and Management, 17.
Mollicone, D., Freibauer, A., Schulze, E. D., Braatz, S., Grassi, G., &
Federici, S. (2006). Elements for the expected mechanisms on re-
duced emissions from deforestation and degradation (REDD)” under
UNFCCC. Environmental Research Letters, 2, 7.
Pagiola, S., & Bosquet, B. (2009). Estimating the costs of REDD+ at
country level. Version 2.2, Washington, DC: Forest Carbon Partner-
ship Facility, World Bank.
Peters-Stanley, M., & Hamilton, K. (2012). Developing Dimension:
State of the voluntary carbon market 2012. Washington, DC: The
Ecosystem Marketplace and Bloomberg New Energy Finance.
Sofiyuddin, M., Rahmanulloh, A., & Suyanto, S. (2012). Assessment of
profitability of land use systems in Tanjung Jabung Barat District,
Jambi Provi nce, Indonesia. O pen Journal of Forest r y, 2, 252-256.
http://dx.doi.org/10.4236/ojf.2012.24031
Sohngen, B., & Beach, R.H. (2006). Avoided deforestation as a green-
house gas mitigation tool: Economic issues for consideration (p. 40).
Columbus: The Ohio State University.
Rahayu, S., Khasanah, N., & Asmawan, T. (2011). Above and
belowground carbon stock. In A. Widayati, S. Suyanto, & M. van
Noordwijk (Eds.), Towards reduced emissions in a high-stake dis-
trict REALU project design for Tanjung Jabung Barat (Tanjabar),
Jambi, Indonesia (pp. 59-73). Project Report, Bogor: World Agrofor-
estry Centre—ICRAF Southeast Asia.
Swallow, B., Van Noordwijk, M., Dewi, S., Murdiyarso, D., White, D.,
Gockowski, J., Hyman, G., Budidarsono, S., Robiglio, V., Meadu, V.,
Ekadinata, A., Agus, F., Hairiah, K., Mbile, P. N., Sonwa, D. J., &
Weise, S. (2007). Opportunities for avoided deforestation with sus-
tainable benefits. An interim report by the ASB partnership for the
tropical forest margins. Nairobi: ASB Partnership for the Tropical
Forest Margins.
White, D., & Minang, P. (2011). Estimating the opportunity costs of
REDD+. A traini ng manual. Washington, DC: World Bank Institute.
World Bank (2012). State and trends of carbon market report 2012.
http://web.worldbank.org/WBSITE/EXTERNAL/TOPICS/ENVIRO
NMENT/EXTCARBONFINANCE/0,,contentMDK:23206428~men
uPK:5575595~pagePK:64168445~piPK:64168309~theSitePK:41258
53~isCURL:Y,00.html
OPEN ACCESS
90