Paper Menu >>
Journal Menu >>
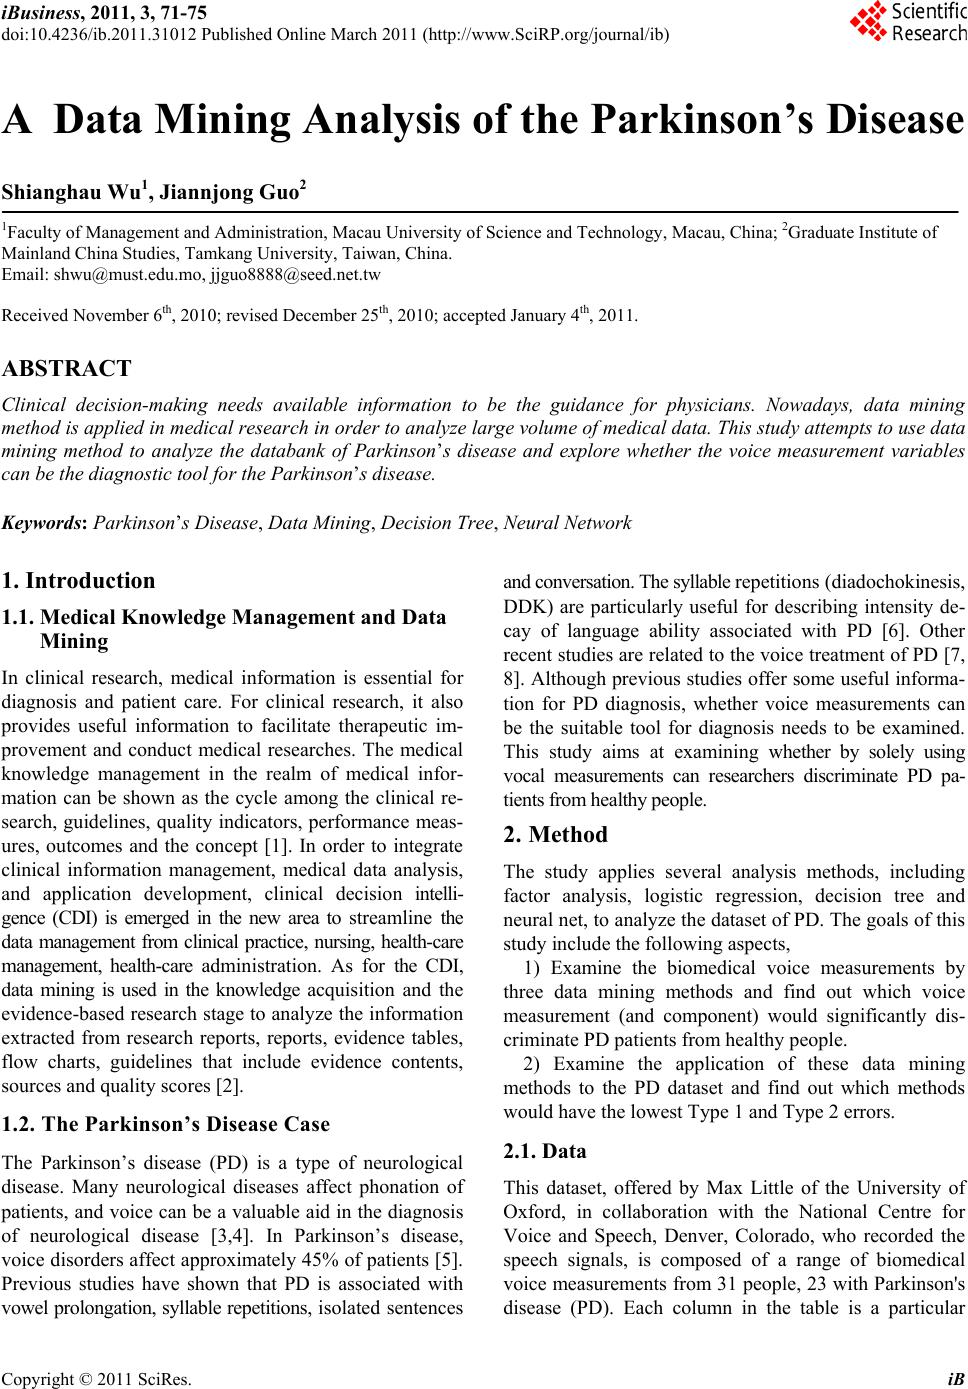 iBusiness, 2011, 3, 71-75 doi:10.4236/ib.2011.31012 Published Online March 2011 (http://www.SciRP.org/journal/ib) Copyright © 2011 SciRes. iB A Data Mining Analysis of the Parkinson’s Disease Shianghau Wu1, Jiannjong Guo2 1Faculty of Management and Administration, Macau University of Science and Technology, Macau, China; 2Graduate Institute of Mainland China Studies, Tamkang University, Taiwan, China. Email: shwu@must.edu.mo, jjguo8888@seed.net.tw Received November 6th, 2010; revised December 25th, 2010; accepted January 4th, 2011. ABSTRACT Clinical decision-making needs available information to be the guidance for physicians. Nowadays, data mining method is applied in medical research in order to analyze large volume of medical data. This study attempts to use data mining method to analyze the databank of Parkinson’s disease and explore whether the voice measurement variables can be the diagnostic tool for the Parkinson’s disease. Keywords: Parkinson’s Disease, Data Mining, Decision Tree, Neural Network 1. Introduction 1.1. Medical Knowledge Management and Data Mining In clinical research, medical information is essential for diagnosis and patient care. For clinical research, it also provides useful information to facilitate therapeutic im- provement and conduct medical researches. The medical knowledge management in the realm of medical infor- mation can be shown as the cycle among the clinical re- search, guidelines, quality indicators, performance meas- ures, outcomes and the concept [1]. In order to integrate clinical information management, medical data analysis, and application development, clinical decision intelli- gence (CDI) is emerged in the new area to streamline the data management from clinical practice, nursing, health-care management, health-care administration. As for the CDI, data mining is used in the knowledge acquisition and the evidence-based research stage to analyze the information extracted from research reports, reports, evidence tables, flow charts, guidelines that include evidence contents, sources and quality scores [2]. 1.2. The Pa rk inso n’s D ise as e Ca se The Parkinson’s disease (PD) is a type of neurological disease. Many neurological diseases affect phonation of patients, and voice can be a valuable aid in the diagnosis of neurological disease [3,4]. In Parkinson’s disease, voice disorders affect approximately 45% of patients [5]. Previous studies have shown that PD is associated with vowel prolongation, syllable repetitions, isolated sentences and conversation. The syllable repetitions (diadochokinesis, DDK) are particularly useful for describing intensity de- cay of language ability associated with PD [6]. Other recent studies are related to the voice treatment of PD [7, 8]. Although previous studies offer some useful informa- tion for PD diagnosis, whether voice measurements can be the suitable tool for diagnosis needs to be examined. This study aims at examining whether by solely using vocal measurements can researchers discriminate PD pa- tients from healthy people. 2. Method The study applies several analysis methods, including factor analysis, logistic regression, decision tree and neural net, to analyze the dataset of PD. The goals of this study include the following aspects, 1) Examine the biomedical voice measurements by three data mining methods and find out which voice measurement (and component) would significantly dis- criminate PD patients from healthy people. 2) Examine the application of these data mining methods to the PD dataset and find out which methods would have the lowest Type 1 and Type 2 errors. 2.1. Data This dataset, offered by Max Little of the University of Oxford, in collaboration with the National Centre for Voice and Speech, Denver, Colorado, who recorded the speech signals, is composed of a range of biomedical voice measurements from 31 people, 23 with Parkinson's disease (PD). Each column in the table is a particular  A Data Mining Analysis of the Parkinson’s Disease 72 voice measure, and each row corresponds one of 195 voice recording from these individuals (“name” column). The main aim of the data is to discriminate healthy peo- ple from those with PD, according to “status” column which is set to 0 for healthy and 1 for PD. The original study published the feature extraction methods for gen- eral voice disorders [9]. 2.2. Factor Analysis The goal of factor analysis is to find out the characteristics of the variables in the databank. Factor analysis in multi- variate techniques is used commonly. Factor analysis is a mathematical tool which can be used to examine large data set and utilize the entire correlation among variables to find the communalities [10]. 2.2.1. Factor Analysis Res ults The study uses SPSS 10.0 software to analyze 22 voice measurement variables (except status variable), and gets the following results: 1) KMO Bartlett Test: KMO = 0.886 > 0.80. It means there are communalities among variables, and it is suit- able to conduct the factor analysis. 2) Communalities: The result of communalities is listed below in Table 1. 3) The result of principal component analysis: In the principal component analysis, the common method is the eigen-value-greater-than-one rule and the scree plot. Ac- cording to the result of principal component analysis and the following scree plot, four components are retained. The four components can explain 83.868% of the Table 1. Communalities of voice measurement variables. Variable Initial Extraction V1 1.000 0.849 V2 1.000 0.499 V3 1.000 0.596 V4 1.000 0.984 V5 1.000 0.964 V6 1.000 0.984 V7 1.000 0.950 V8 1.000 0.984 V9 1.000 0.969 V10 1.000 0.967 V11 1.000 0.927 V12 1.000 0.968 V13 1.000 0.920 V14 1.000 0.927 NHR 1.000 0.895 HNR 1.000 0.814 RPDE 1.000 0.632 DFA 1.000 0.717 SPREAD1 1.000 0.839 SPREAD2 1.000 0.598 D2 1.000 0.649 PPE 1.000 0.821 Scree Plot Component N umber 21191715131197531 Eigenv a lue 14 12 10 8 6 4 2 0 Figure 1. Scree plot of voice measurement variables. the following scree plot, four components are retained. The four components can explain 83.868% of the total variance. As for the principal component analysis, the orthogonal rotation and varimax methods are widely used. The ob- jective of rotation is to achieve a simpler factor structure that can be meaningfully interpreted by the researcher. An orthogonal rotation can be performed to achieve this objective. In the orthogonal rotation, varimax and quarti- max are most popular types, which the rotated factors are orthogonal to each other [11]. The results of orthogonal rotation and varimax methods are presented in Table 2, the component 1 includes V9, V10, V11, V12, V13, V14, HNR, D2. Because the component 1 is mainly composed of variables about variation in amplitude, the component 1 can be renamed as the variation in amplitude. The com- ponent 2 includes V4, V5, V6, V7, V8, NHR. Because the component 2 is mainly composed of variables about several measures of variation in fundamental frequency, the component 2 can be renamed as the variation in fun- damental frequency. The component 3 includes SPREAD1, SPREAD2, V1, V3, RPDE, PPE. Because the component 3 is mainly composed of three nonlinear measures of fundamental frequency variation, and V1, V3 are the average and the minimum vocal fundamental frequency, the component 3 can be renamed as the nonlinear meas- ures of fundamental frequency variation. The component 4 includes DFA, V2. Because two variables have larger difference, the component 4 can be renamed as the other measure of voices. 2.2.2 Logistic Regression Results The study attempts to examine whether physicians can finely diagnose PD solely by means of the voice measure- ments. Therefore, the study uses the logistic regression to examine the odds of correct diagnosis of PD. The study uses status variable as the dependent variable and the component 1 to the component 4 as the covariates to con- Copyright © 2011 SciRes. iB  A Data Mining Analysis of the Parkinson’s Disease73 Table 2. The factor loadings after varimax rotating. Component 1 2 3 4 V12 0.883 0.407 0.109 −0.103 V9 0.853 0.466 0.141 –6.741E–02 V13 0.837 0.435 0.168 –3.746E–02 V11 0.832 0.464 0.113 –7.707E–02 V14 0.832 0.464 0.113 –7.708E–02 V10 0.831 0.512 0.114 –4.642E–02 HNR –0.712 –0.437 –0.313 –0.131 D2 0.584 0.113 0.291 0.459 V8 0.397 0.900 0.112 6.270E–02 V6 0.398 0.900 0.112 6.270E–02 V4 0.409 0.887 0.167 4.099E–02 V5 0.279 0.873 0.327 –0.128 V7 0.483 0.835 0.134 –3.464E–02 NHR 0.386 0.822 0.125 0.233 V3 8.462E–02 –8.000E–02–0.753 0.122 RPDE 0.311 0.145 0.714 6.761E–02 SPREAD1 0.442 0.452 0.657 –8.951E–02 V1 0.158 –0.140 –0.642 0.626 SPREAD2 0.466 5.177E–02.613 4.635E–02 PPE 0.494 0.474 .578 –0.135 DFA 0.154 5.435E–02–1.714E–02 –0.831 V2 –3.008E–02 0.141 –0.126 0.680 struct the logistic regression model. The results are listed below: 1) Cox & Snell R-square and Nagelkerke R-square: In the logistic regression model, the Cox & Snell R-square is 0.350 and the Nagelkerke R-square is 0.521. It means these four components of voice measurement variables have strong relationship with the health status variables. 2) Hosmer-Lemeshow test: The study uses the Hosmer -Lemeshow test in order to examine whether the logistic model is well fitted [12]. If the p-value of Hosmer-Leme– show test is larger than 0.05, it means the model is well fitted. In this logistic model, Chi-square value is 6.605, p-value is 0.580 > 0.05. So the logistic regression model is well fitted. 3) Classification: the logistic regression model offers the prediction of classification. The classification result is shown in Table 3. In Table 3, 162 (= 26 + 136) cases are correctly clas- sified into healthy groups and PD patients group, while healthy cases are falsely classified into PD patients group, and 11 PD cases are falsely classified into the healthy group. The correct percentage of classification is 83.1%. 4) The result of the logistic regression: the coefficients evaluation is presented in Table 4. In Table 4, the significance ratio of the Wald Test in Table 3. Classification result. Predicted Status Percentage Correct 0 1 Status 026 22 54.2 111 136 92.5 Overall Percentage 83.1 Table 4. The logistic regression result. B S.E.Wald df Sig. Exp(B) component1 1.8170.47214.823 1 0.000 6.152 component2 0.4240.4360.942 1 0.3321.527 component 31.4790.26531.099 1 0.000 4.389 component4 –0.5150.2285.114 1 0.024 0.597 Constant 2.1170.36533.557 1 0.000 8.308 component 2 (Variation in Fundamental Frequency) is larger than 0.05. Other components, including component 1, component 3, component 4, are significant (p < 0.05). So component 1 (variation in amplitude), component 3 (nonlinear measures of fundamental frequency variation), and component 4 (other measure of voices) are important variables to predict and explain the healthy status. According to the results of the logistic regression, the odd ratio can be calculated from Table 4. The odd ratio of component 1 is 6.152. It means when the component 1 increases 0.01 units, the probability of the odd between PD cases and healthy cases increases 0.01 × (6.152 – 1) = 5.152%. In the same way, when the component 3 in- creases 0.01 units, the probability of the odd between PD cases and healthy cases increases 0.01 × (4.389 – 1) = 3.389%. Besides, when the component 4 increases 0.01 units, the probability of the odd between PD cases and healthy cases increases 0.01 × (0.597 – 1) = –0.00403%. 2.3. Decision Tree Analysis Decision tree analysis is useful for logical induction in the data mining process. Decision tree induction is the learning of decision trees from class-labeled training tu- ples. A decision tree is a flowchart-like tree structure, where each internal node represents a test on an attribute, each branch represents an outcome of the test, and each leaf node (terminal node) holds a class label. The top- most node is the root node [13]. Rattle 2.4.78 software is applied to the decision tree analysis in this study. The healthy status variable is the response variable, and the 22 voice measurement variables are the input variables in the decision tree model. In the decision tree analysis, 70% of samples (136 cases) are applied. The decision tree is shown in the Figure 2. In Figure 2, the first node follows two decisions. When the variable SPREAD 1 is less than or equal to Copyright © 2011 SciRes. iB 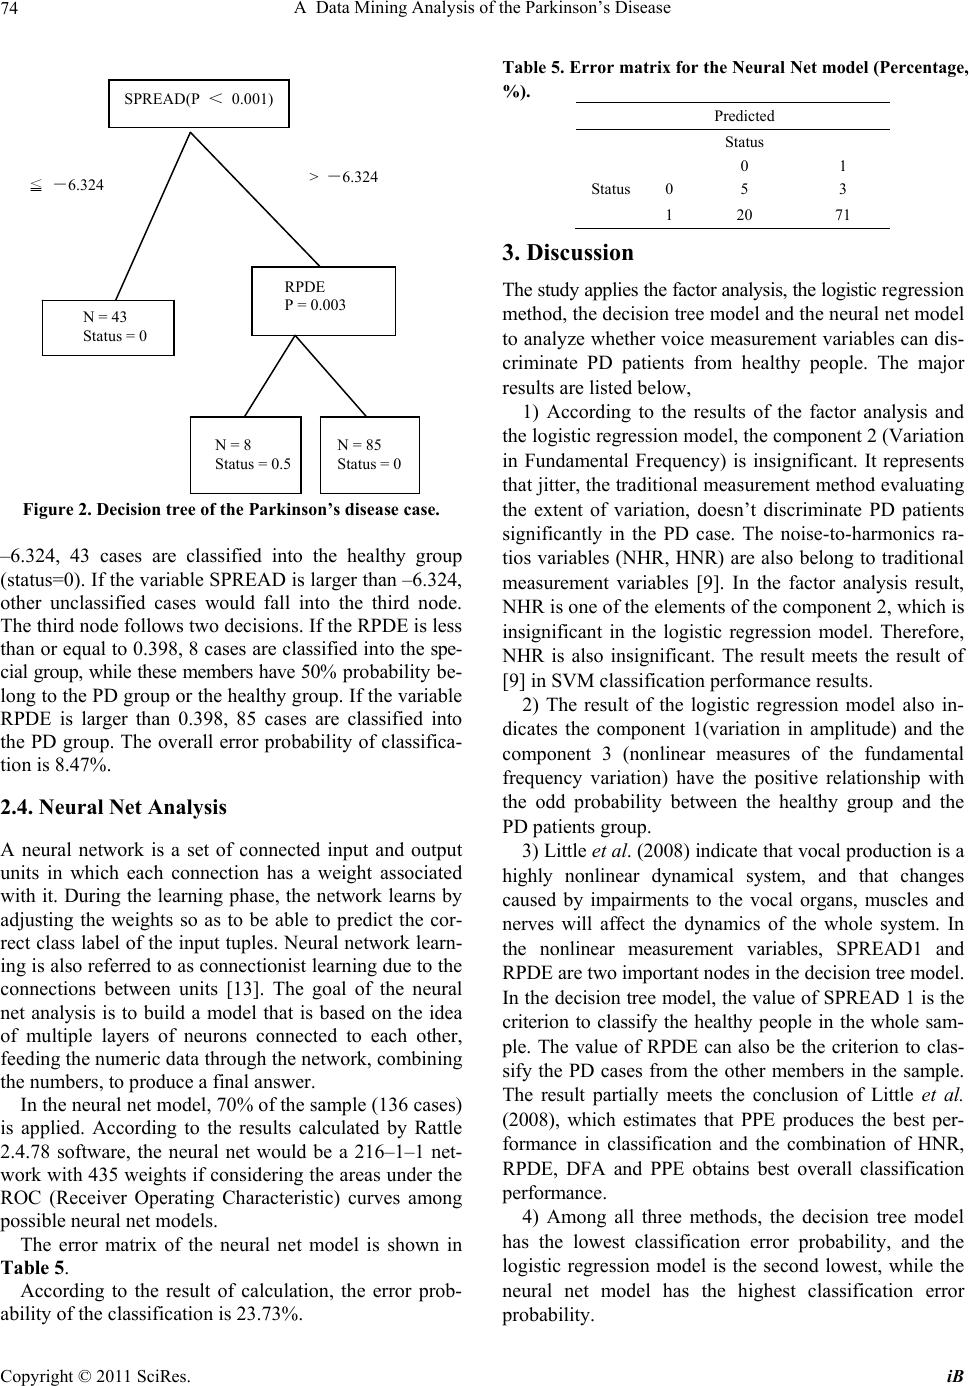 A Data Mining Analysis of the Parkinson’s Disease 74 Figure 2. Decision tree of the Parkinson’s disease case. –6.324, 43 cases are classified into the healthy group (status=0). If the variable SPREAD is larger than –6.324, other unclassified cases would fall into the third node. The third node follows two decisions. If the RPDE is less than or equal to 0.398, 8 cases are classified into the spe- cial group, while these members have 50% probability be- long to the PD group or the healthy group. If the variable RPDE is larger than 0.398, 85 cases are classified into the PD group. The overall error probability of classifica- tion is 8.47%. 2.4. Neural Net Analysis A neural network is a set of connected input and output units in which each connection has a weight associated with it. During the learning phase, the network learns by adjusting the weights so as to be able to predict the cor- rect class label of the input tuples. Neural network learn- ing is also referred to as connectionist learning due to the connections between units [13]. The goal of the neural net analysis is to build a model that is based on the idea of multiple layers of neurons connected to each other, feeding the numeric data through the network, combining the numbers, to produce a final answer. In the neural net model, 70% of the sample (136 cases) is applied. According to the results calculated by Rattle 2.4.78 software, the neural net would be a 216–1–1 net- work with 435 weights if considering the areas under the ROC (Receiver Operating Characteristic) curves among possible neural net models. The error matrix of the neural net model is shown in Table 5. According to the result of calculation, the error prob- ability of the classification is 23.73%. Table 5. Error matrix for the Neural Net model (Percentage, %). SPREAD(P < 0.001) Predicted Status 0 1 Status0 5 3 1 20 71 > -6.324 ≦ -6.324 3. Discussion RPDE P = 0.003 The study applies the factor analysis, the logistic regression method, the decision tree model and the neural net model to analyze whether voice measurement variables can dis- criminate PD patients from healthy people. The major results are listed below, N = 43 Status = 0 1) According to the results of the factor analysis and the logistic regression model, the component 2 (Variation in Fundamental Frequency) is insignificant. It represents that jitter, the traditional measurement method evaluating the extent of variation, doesn’t discriminate PD patients significantly in the PD case. The noise-to-harmonics ra- tios variables (NHR, HNR) are also belong to traditional measurement variables [9]. In the factor analysis result, NHR is one of the elements of the component 2, which is insignificant in the logistic regression model. Therefore, NHR is also insignificant. The result meets the result of [9] in SVM classification performance results. N = 8 Status = 0.5 N = 85 Status = 0 2) The result of the logistic regression model also in- dicates the component 1(variation in amplitude) and the component 3 (nonlinear measures of the fundamental frequency variation) have the positive relationship with the odd probability between the healthy group and the PD patients group. 3) Little et al. (2008) indicate that vocal production is a highly nonlinear dynamical system, and that changes caused by impairments to the vocal organs, muscles and nerves will affect the dynamics of the whole system. In the nonlinear measurement variables, SPREAD1 and RPDE are two important nodes in the decision tree model. In the decision tree model, the value of SPREAD 1 is the criterion to classify the healthy people in the whole sam- ple. The value of RPDE can also be the criterion to clas- sify the PD cases from the other members in the sample. The result partially meets the conclusion of Little et al. (2008), which estimates that PPE produces the best per- formance in classification and the combination of HNR, RPDE, DFA and PPE obtains best overall classification performance. 4) Among all three methods, the decision tree model has the lowest classification error probability, and the logistic regression model is the second lowest, while the neural net model has the highest classification error probability. Copyright © 2011 SciRes. iB  A Data Mining Analysis of the Parkinson’s Disease Copyright © 2011 SciRes. iB 75 4. Conclusions The study uses the data mining analysis to explore the Parkinson’s Disease data. Data mining is widely used in the realm of the preventive medicine. By means of the study of the PD data, medical researchers can create the evaluation table according to the results of data mining in order to make physicians and ordinary people aware the early symptoms of PD and make earlier treatments. REFERENCES [1] B. McCourt, R. A. Harrington, K. Fox, C. D. Hamilton, K. Booher, W. E. Hammond, A. Walden and M. Nahm, “Data Standards: At the Intersection of Sites, Clinical Research Networks, and Standards Development Initia- tives,” Drug Information Journal, Vol. 41, No. 3, 2007, pp. 393-404. [2] X. S. Wang, L. Nayda and R. Dettinger, “Infrastructure for a Clinical Decision–Intelligence System,” IBM Sys- tems Journal, Vol. 46, No. 1, 2007, pp. 151-169. doi:10.1147/sj.461.0151 [3] K. Michelsson, J. Raes, C. Thoden and O. Wasz–Hockert, “Sound Spectrographic Cry Analysis in Neonatal Di- agonostics: An Evaluative Study,” Journal of Phonet, Vol. 10, 1982, pp. 79-88. [4] L. Ramig, R. Sherer, I. Titze and S. Ringel, “Acoustic Analysis of Voices of Patients with Neurologic Disease: Rationale and Preliminary Data,” The Annals of Otology, Rhinology, and laryngology, No. 97, 1988, pp. 164-172. [5] J. Logemann, H. Fisher, B. Boshes and R. E. Blonsky, “Frequency and Concurrence of Vocal Tract Dysfunc- tions in the Speech of a Large Sample of Parkinson Pa- tients,” Journal of Speech Hear Disord, Vol. 43, 1978, pp. 47-57. [6] K. M. Rosen, R. D.Kent and J. R. Duffy, “Task–Based Profile of Vocal Intensity Decline in Parkinson’s Dis- ease,” Folia Phoniatrica et Logopaedica, Vol. 57, 2005, pp. 28-37. doi:10.1159/000081959 [7] J. Spielman, L. O. Ramig, L. Maeler, A. Halpern and J. William, “Effects of an Extended Version of the Lee Silverman Voice Treatment on Voice and Speech in Parkinson’s Disease,” Language Pathology, Vol. 16, No. 2, 2007, pp. 95-107. doi:10.1044/1058–0360(2007/014) [8] E. Baudelle, J. Vassiere, J. L. Renard, B. Roubeau and C. Chevrie–Mueller, “Carateristiques Vocaliques Intrinse- ques et Co–intinseques dans les dysarthries cerebelleuses et parkinsonienne,” Folia Phoniatrica et Logopaedica, No. 55, 2003, pp .137-146. doi:10.1159/000070725 [9] M. A. Little, P. E. McSharry, E. J. Hunter and L. O. Ramig, “Suitability of Dysphonia Measurements for Telemonitoring of Parkinson’s Disease,” IEEE Transac- tions on Biomedical Engineering, 2008 (to appear). [10] S. Sharma, “Applied Multivariate Techniques,” John Wiley & Sons, Inc., New York, 1996. [11] I. T. Jollife, Principal Component Analysis, 2nd Edition, Springer-Verlag, 2002, pp. 487. [12] D. W. Hosmer and S. Lemeshow, “Applied Logistic Re- gression,” 2nd Edition, John Wiley & Sons, Inc., 2000. doi:10.1002/0471722146 [13] J. Han and M. Kamber, Data Mining Concepts and Tech- niques, Elsevier, Australia, 2006. |