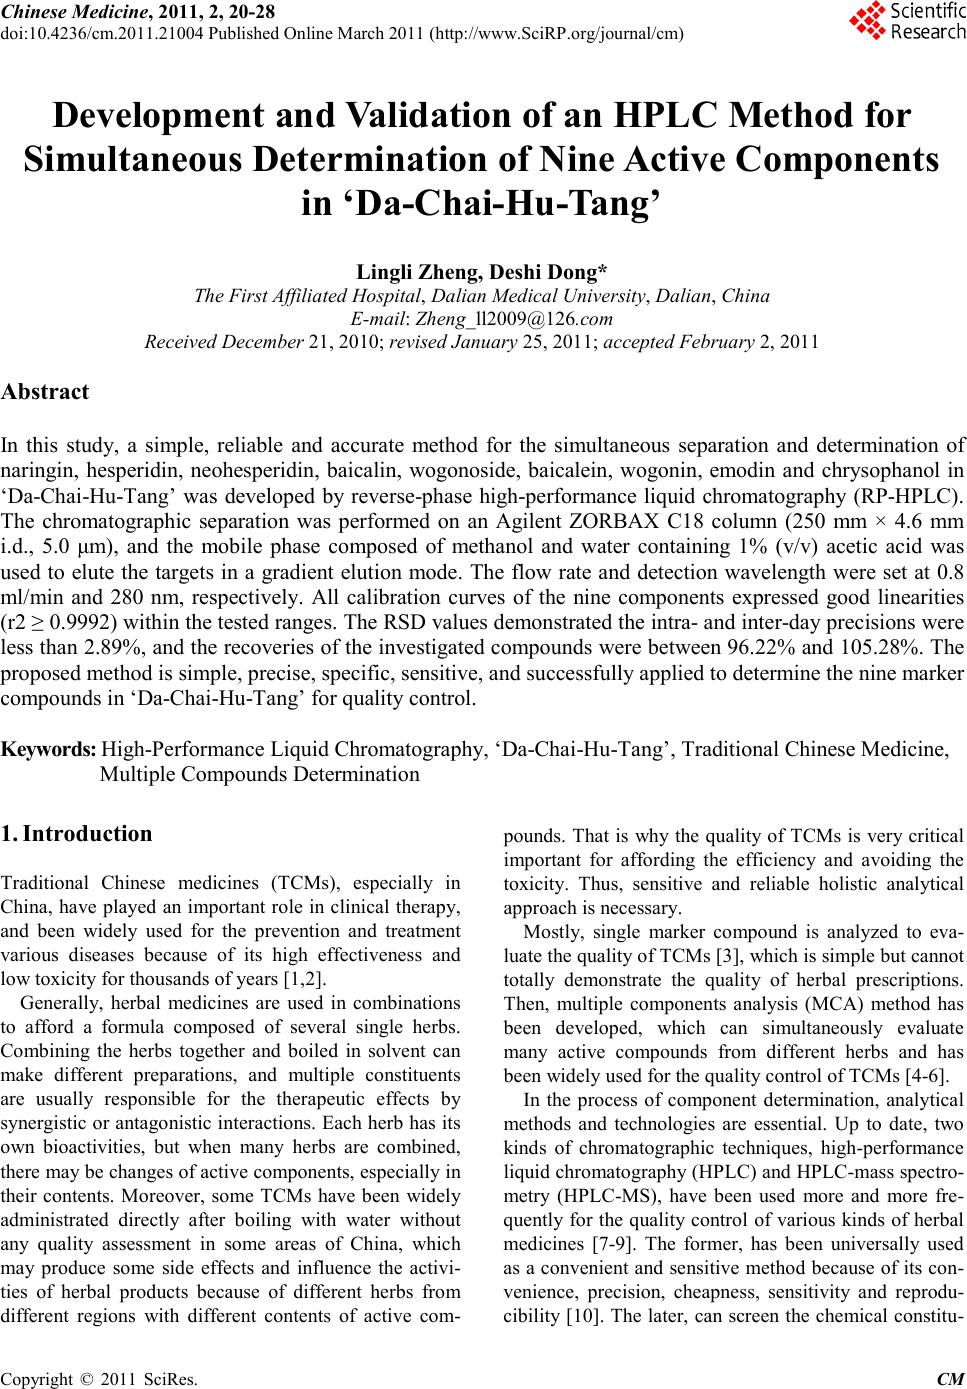
 Chinese Medicine, 2011, 2, 20-28 doi:10.4236/cm.2011.21004 Published Online March 2011 (http://www.SciRP.org/journal/cm) Copyright © 2011 SciRes . CM Development and Validation of an HPLC Method for Simultaneous Determination of Nine Active Components in ‘Da-Chai-Hu-Tang’ Lingli Zheng, Deshi Dong* The First Affiliated Hospital, Dalian Medical University, Dalian, China E-mail: Zheng_ll2009@126.com Received December 21, 201 0; revised January 25, 2011; accepted February 2, 2011 Abstract In this study, a simple, reliable and accurate method for the simultaneous separation and determination of naringin, hesperidin, neohesperidin, baicalin, wogonoside, baicalein, wogonin, emodin and chrysophanol in ‘Da-Chai-Hu-Tang’ was developed by reverse-phase high-performance liquid chromatography (RP-HPLC). The chromatographic separation was performed on an Agilent ZORBAX C18 column (250 mm × 4.6 mm i.d., 5.0 μm), and the mobile phase composed of methanol and water containing 1% (v/v) acetic acid was used to elute the targets in a gradient elution mode. The flow rate and detection wavelength were set at 0.8 ml/min and 280 nm, respectively. All calibration curves of the nine components expressed good linearities (r2 ≥ 0.9992) within the tested ranges. The RSD values demonstrated the intra- and inter-day precisions were less than 2.89%, and the recoveries of the investigated compounds were between 96.22% and 105.28%. The proposed method is simple, precise, specific, sensitive, and successfully applied to determine the nine marker compounds in ‘Da-Chai-Hu-Tang’ for quality control. Keywords: High-Performance Liquid Chromatography, ‘Da-Chai-Hu-Tang’, Tradi tional Ch ine se Med icin e, Multiple Compounds Determination 1. Introduction Traditional Chinese medicines (TCMs), especially in China, have played an important role in clinical therapy, and been widely used for the prevention and treatment various diseases because of its high effectiveness and low toxicit y for thousands of years [1,2]. Generally, herbal medicines are used in combinations to afford a formula composed of several single herbs. Combining the herbs together and boiled in solvent can make different preparations, and multiple constituents are usually responsible for the therapeutic effects by synergistic or antagonistic interactions. Each herb has its own bioactivities, but when many herbs are combined, there may be changes of active components, especially in their contents. Moreover, some TCMs have been widely administrated directly after boiling with water without any quality assessment in some areas of China, which may produce some side effects and influence the activi- ties of herbal products because of different herbs from different regions with different contents of active com- pounds. That is why the quality of TCMs is very critical important for affording the efficiency and avoiding the toxicity. Thus, sensitive and reliable holistic analytical approach is necessary. Mostly, single marker compound is analyzed to eva- luate the quality of T CMs [3] , which is simple but cannot totally demonstrate the quality of herbal prescriptions. Then, multiple components analysis (MCA) method has been developed, which can simultaneously evaluate many active compounds from different herbs and has been widely used for the quality control of TCMs [4-6]. In the process of component determination, analytical methods and technologies are essential. Up to date, two kinds of chromatographic techniques, high-performance liquid chro matography (HPLC) and HPLC-mass spectro- metry (HPLC-MS), have been used more and more fre- quentl y for the quality control of various kinds of herbal medicines [7-9]. The former, has been universally used as a convenient and sensitive method because of its con- venience, precision, cheapness, sensitivity and reprodu- cibility [10]. The later, can screen the chemical constitu- 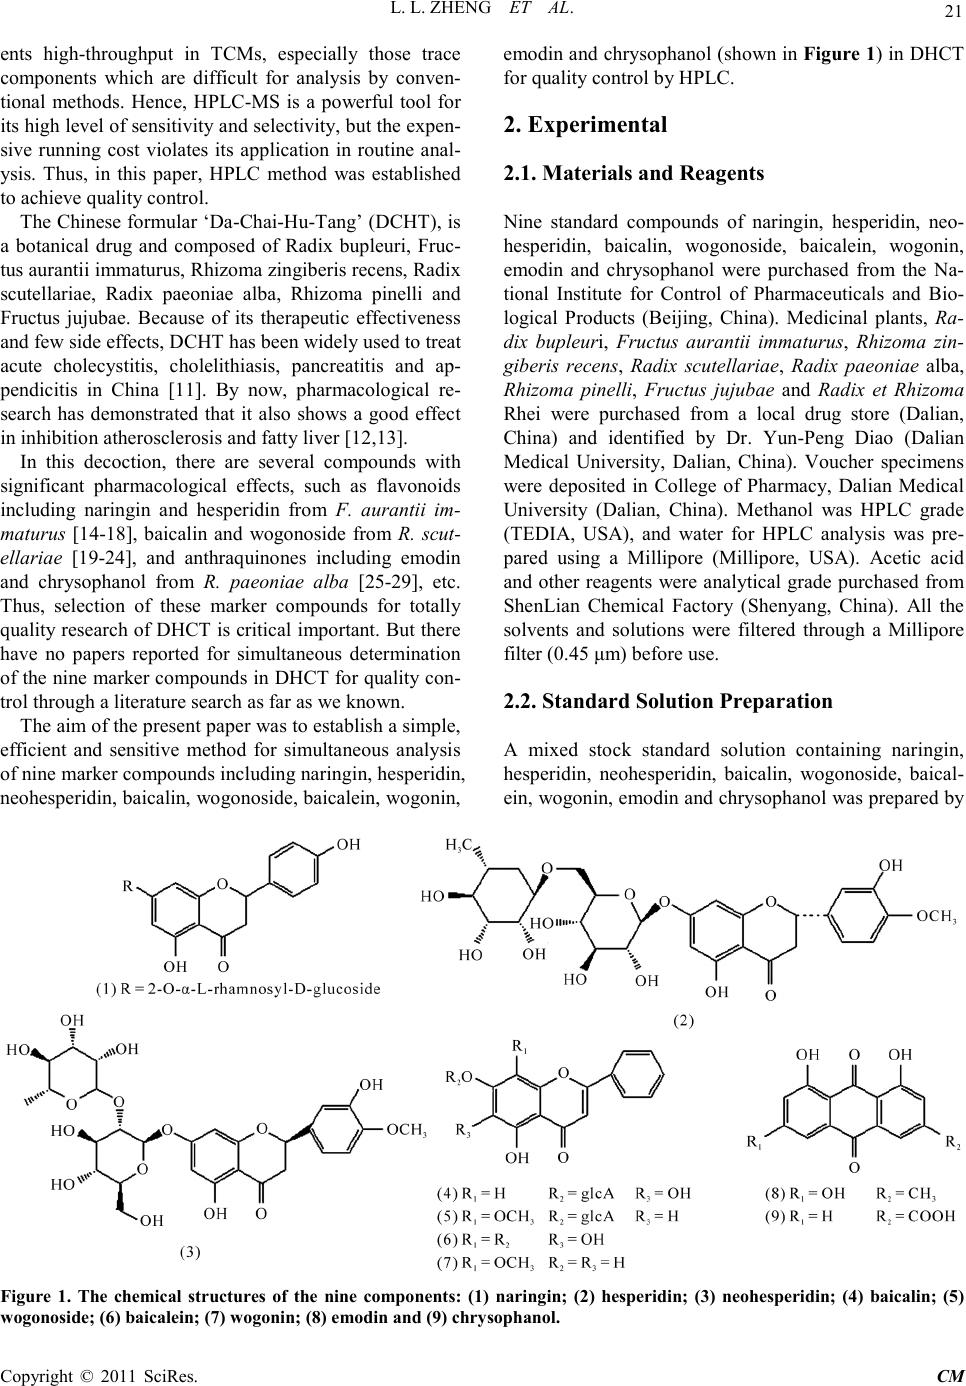 L. L. ZHENG ET AL. Copyright © 2011 SciRes . CM ents high-throughput in TCMs, especially those trace components which are difficult for analysis by conven- tional methods. Hence, HPLC-MS is a powerful tool for its high level of sensiti vity a nd selectiv it y, but t he exp en- sive running cost violates its application in routine anal- ysis. Thus, in this paper, HPLC method was established to achieve quality control. The Chinese for mular ‘Da-Chai-Hu-Tang’ ( DCHT), is a botanical drug and composed of Radix bupleuri, Fruc- tus aurantii immatur us, Rhizo ma zingiber is rece ns, Radi x scutellariae, Radix paeoniae alba, Rhizoma pinelli and Fructus jujubae. Because of its therapeutic effectiveness and few side effects, DCHT has been widely used to treat acute cholecystitis, cholelithiasis, pancreatitis and ap- pendicitis in China [11]. By now, pharmacological re- search has demonstrated that it also shows a good effect in inhibition atherosclerosi s and fatty liver [12,13]. In this decoction, there are several compounds with significant pharmacological effects, such as flavonoids including naringin and hesperidin from F. aurantii im- maturus [14-18], baicalin and wogonoside from R. scut- ellariae [19-24], and anthraquinones including emodin and chrysophanol from R. paeoniae alba [25-29], etc. Thus, selection of these marker compounds for totally quality research of DH CT is critical important. But there have no papers reported for simultaneous determination of the nine marker compounds i n DHCT for q ualit y con- trol through a literature search as far as we known. The aim of the present paper was to establish a simple, efficient and sensitive method for simultaneous analysis of nine marker compounds i ncluding naringin, hesperi din, neohesperidin, b aicalin, wogono side, b aicale in, wogon in, emodin and chrysophanol (shown in Figure 1) in DHCT for quality co ntrol by HPLC. 2. Experimental 2.1. Materials and Reagents Nine standard compounds of naringin, hesperidin, neo- hesperidin, baicalin, wogonoside, baicalein, wogonin, emodin and chrysophanol were purchased from the Na- tional Institute for Control of Pharmaceuticals and Bio- logical Products (Beijing, China). Medicinal plants, Ra- dix bupleuri, Fructus aurantii immaturus, Rhizoma zin- giberis recens, Radix scutellariae, Radix paeoniae alba, Rhizoma pinelli, Fructus jujubae and Radix et Rhizoma Rhei were purchased from a local drug store (Dalian, China) and identified by Dr. Yun-Peng Diao (Dalian Medical University, Dalian, China). Voucher specimens were deposited in College of Pharmacy, Dalian Medical University (Dalian, China). Methanol was HPLC grade (TEDIA, USA), and water for HPLC analysis was pre- pared using a Millipore (Millipore, USA). Acetic acid and other reagents were analytical grade purchased fro m ShenLian Chemical Factory (Shenyang, China). All the solvents and solutions were filtered through a Millipore filter (0.45 μm) before use. 2.2. Standard Solution Preparation A mixed stock standard solution containing naringin, hesperidin, neohesperidin, baicalin, wogonoside, baical- ein, wogonin, emodin and chrysophanol was prepared by Figure 1. The chemical structures of the nine components: (1) naringin; (2) hesperidin; (3) neohesperidin; (4) baicalin; (5) wogonoside; (6) baicalein; (7) wogoni n; (8) emodin and (9 ) chrysophano l.  L. L. ZHENG ET AL. Copyright © 2011 SciRes . CM accurately weighing appropriate amounts of the nine reference compounds and dissolving in methanol. All the standard stock and working solutions were prepared in dark brown calibrated flasks and stored at 4˚C. 2.3. Preparation of Sample Solutions and Negative Control Solutions Ten medical plants were triturated into powders in the particle size of 40-60 mesh, and then weighed according to DCHT formula and blended. The mixed powder (0.70 g) was extracted by 20 ml methanol for 20 min in an ultrasonic bath. In order to keep the repeatability of the extraction procedure, lost volume of methanol was com- pensated after extraction. After filtration, 2 ml filtrate was transferred into a 10 ml volumetric flask with MeOH and 10 μl of the resultant solution was injected into the LC system for analysis after through a 0.45 μm Millipore filter. According to the prescription and preparation protocol of DCHT formula, three kinds of negative control sam- ples in which the formula without F. aurantii Imma t- urus, R. scutella riae, or R. et Rhizoma Rhei, respectively, were prepared to validate the specificity of the method. The negative samples were prepared according to the method mentioned above. 2.4. Apparatus and Chromatographic Conditi ons Chromatography was performed with an Agilent Tech- nologies 1200 series HPLC system consisting of a qua- ternary delivery system, an auto-sampler and a DAD detector. All the separations were carried out on a ZORBAX SB C18 column (250 mm × 4.6 mm I.D., 5 μm). The mobile phase consisted of methanol (A) and water containing 1% acetic acid (B) at a flow rate of 0.8 ml/min with a gradient elution mode was carried out as follows: 0-20 min, linear gradient from 15% A to 35% A; 20-40 min, the mobile phase was held on 35% A; 40-60 min, linear gradient to 50% A; 60-110 min, the linear gradient to 80% A; 110-120 min, the linear gradient to 95% A. Each run was followed by equilibration time of 15 min. Ultraviolet (UV) spectra were monitored at 280 nm. All the data were collected and analyzed with Chemsta tion software. 3. Results and Discussions 3.1. Optimization of Chromatographic Conditi ons To develop an accurate, valid and optimal chromatogra m, some HPLC analytical parameters including separation column, mobile phase and its elution mode were all in- vestigated in this study. Four kinds of reversed-phase columns, Lichrosorb C18 column (150 mm × 4.6 mm I.D., 5 μm), Johnsson ODS2 C18 column (250 mm × 4.6 mm I.D., 5 μm), Agilent XDB C18 column (150 mm × 4.6 mm I.D., 5 μm) and Agilent ZORBAX C18 column (250 mm × 4.6 mm I.D., 5 μm) were tested under differ- ent elution modes of using methanol–water or acetoni- trile–water containing different concentrations of acetic acid as the mobile p hase (listed in Table 1). After a seri- al of experiments, we found that the separation was per- formed on an Agilent ZORBAX C18 column (250 mm × 4.6 mm I.D., 5 μm) using the solvent system composed of methanol (A)–water containing 1% acetic acid (B) as the mobile phase with gradient elution mode as follows: 0-20 min, linear gradient from 15% A to 35% A; 20-40 min, the mobile phase was held on 35% A; 40-60 min, linear gradien t to 50% A; 60 -11 0 min, t he l inea r gra die nt to 80% A; 110-120 min, the linear gradient to 95% A. The flow rate was 0.8 ml/min. The detection wavelength was set at 280 nm on the basis of the UV spectra with three dimension chromatograms of DAD detection, where all the compounds could be detected and had adequate adsorption. Selectivity was assessed by com- paring chromatograms obtained from the blank sample and from the corresponding spiked sample. Typical chromatograms are shown in Figure 2, in which chro- matograms of A, B and C correspond to blank mobile phase, mixed standards, DCHT, and the peaks 1, 2, 3, 4, 5, 6, 7, 8 and 9 re present na ringin, he speri din, neohespe- ridin, baicalin, wogonoside, baicalein, wogonin, emodin and c hrysophanol, r espectively. 3.2. Optimization Sample Extraction Protoco l The extra ctio n co nditi ons, for e xample ext rac tion s ol vent , method and time, can easily influence the efficiency of the extraction. As a result, it is necessary to estimate and optimize the factors affecting extraction recovery. Two methods, boiling and ultrasonic are often used to extract the ta rgets fr om matrix. T he d isadva ntages of the boiling procedure are the loss of the compounds due to ioniza- tion, hydrolysis and oxidation during extraction, the consumption of a large amount of solvent, low extraction efficiency, and time-consuming. These shortcomings have led to the consideration of ultrasound-assisted ex- traction (UAE) method, which has been widely used in quality control of TCMs. In UAE process, extraction solvent, sample-solvent ratio and extraction time are critical i mporta nt for high extraction efficie ncy. Methanol is often used as the extraction solvent be- cause of its high efficiency and directly application for  L. L. ZHENG ET AL. Copyright © 2011 SciRes . CM Table 1. The tried column a nd mobile pha se in optimization of HP LC co nditions. Colu mn Solvent system Elution mode Lichrosorb C18 (4.6 mm × 150 mm I.D., 5 μm) (Zhonghuida, Dalian, China) Acetonitrile (A) and water (B) 0~20 min , 1 5% A; 20~30 min, 15%~40 % A; 30~60 min, 40% A ODS2 C18 (4.6 mm × 250 mm I.D., 5 μm) (Johnsson, Dalian, China) Acetonitrile (A) and water (B) 0~30 min , 1 0~40% A; 30~ 60 min, 40% A ODS2 C18 (4.6 mm × 250 mm I.D., 5 μm) (Johnsson, Dalian, China) Methan ol (A) And wat er (B) 0~10 min, 10% A; 10~40 min, 10~40% A; 40~80 min, 40% A; 80~120 m in, 40~60% A XDB C18 (4.6 mm × 150 mm I.D., 5 μm) (Agilent, USA) Methanol (A) and water (B) 0~15 min, 10~30% A; 15~30 min, 30~40% A; 30~40 min , 40% A; 40~60 m in, 40~60% A; 60~80 min, 60~ 80% A ZORBAX C18 (4.6 mm × 250 mm I.D., 5μm) (Agilent, USA) Metha nol (A) and 1% acetic acid water (B) 0~15 min, 20~40% A; 15~35 min, 40% A; 35~40 min, 40~45% A; 40~60 min, 45~ 60% A; 60~100 min, 60~ 95% A ZORBAX C18 (4.6 mm × 250 mm I.D., 5 μm) (Agilent, USA) Methanol (A) and 1% acetic acid water (B) 0~10 min, 22~35% A; 10~30 min, 35~38% A; 30~40 min, 38~45% A ; 40~6 0 m in , 45~ 6 0% A; 60~100 min, 60~95% A ZORBAX C18 (4.6 mm × 250 mm I.D., 5 μm) (Agilent, USA) Methanol (A) and 1% acetic acid water (B) 0~20 min, 15~35% A; 20~40 min, 35% A; 40~60 min, 35~50% A; 60~110 min, 50~ 80% A; 110~12 0 m in, 80~95% A (a) (b) (c) Figure 2 . Represent ative HPLC chromatograms of: (a) mo- bile phas e; (b) mixed standard so lutions; (c) DCHT sample . HPLC analysis without any more preparation. In the present paper, pure and aqueous methanol (20%, 40%, 60% and 80%) were tried and examined as theextraction solvent for DCHT by UAE for 30 min. The results sho wn in Figure 3(a ) showed that the extraction rates of all targets were gradually increased along with the in- crease of methanol concentrations, and pure methanol was selected as the extraction solvent. Second, three le- vels of the use of methanol (10, 20 and 30 ml) were in- vestigated, and the results are shown in Figure 3(b). It was evident that 20 ml methanol was the best for the extraction. Furthermore, the extract time, including 10, 20, 30 and 45 min were also optimized and the result shown in Figure 3(c) indicated that the extraction time contr olle d at 20 min was e nough. In the end, the sui tabl e extraction conditions were as follows: the samples were extracted by UAE using 20 ml methanol as the extraction solvent, and the pro cess was lasted for 20 min. 3.3. Specificity of the Method In order to investigate the specificity of the method, dif- ferent negative control samples of DHCT were prepared and analyzed by HPLC, and the chromatograms are shown in Figure 4. It was obvious that there were no interferences for determination of the nine compounds by comparing the retention times with the standards. Fur- thermore, the purities of the investigated peaks were all confirmed to be pure through DAD purity studies . 3.4. Calibration Curves, the Limit of Detection (LOD) and Quantification (LOQ) The external standard method was used to obtain regression 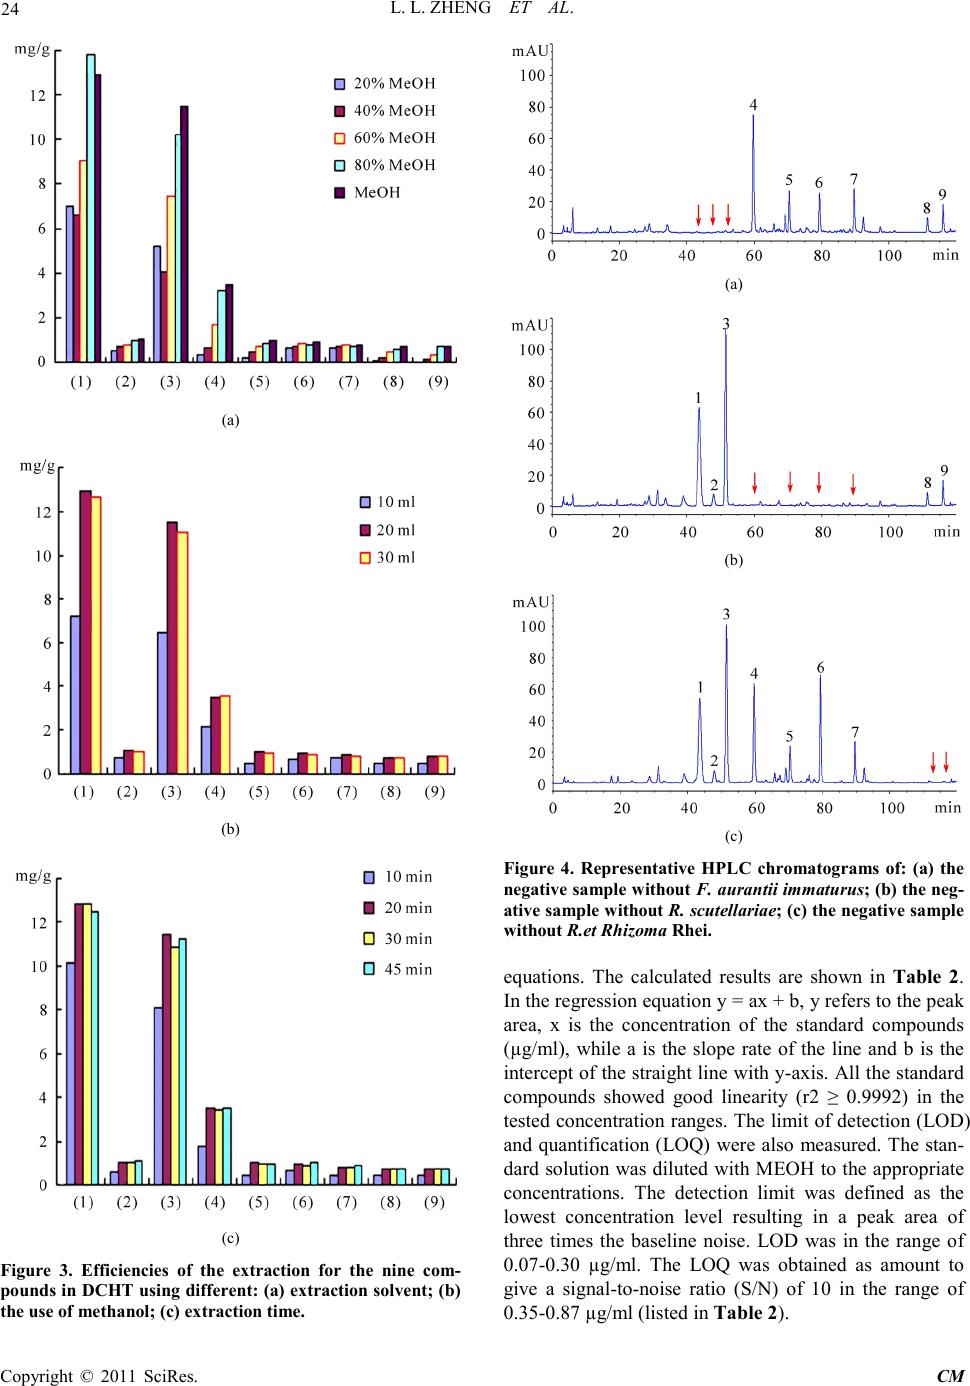 L. L. ZHENG ET AL. Copyright © 2011 SciRes . CM (a) (b) (c) Figure 3. Efficiencies of the extraction for the nine com- pou nds in DCHT us ing diff erent: (a) e xtr action solve nt; ( b) the use of methanol; (c) extraction time. (a) (b) (c) Figure 4. Representative HPLC chromatograms of: (a) the negat ive s ample w ithout F. a uran tii im maturu s; ( b) the neg- ative s ampl e w ithout R. scutellariae; (c) the neg ative sa mple without R.et Rhi zoma Rhei. equations. The calculated results are shown in Table 2. In the r e gr e ss io n eq ua t io n y = ax + b, y refers to the peak area, x is the concentration of the standard compounds (µg/ml), while a is the slope rate of the line and b is the intercept of the straight line with y-axis. All the standard compounds showed good linearity (r2 ≥ 0.9992) in the tested concentratio n ranges. The limit of detec tion (LOD) and quantification (LOQ) were also measured. The stan- dard so lution was d iluted with MEOH to the appropriate concentrations. The detection limit was defined as the lowest concentration level resulting in a peak area of three times the baseline noise. LOD was in the range of 0.07-0.30 µg/ml. The LOQ was obtained as amount to give a signal-to-noise ratio (S/N) of 10 in the range of 0.35-0.87 µg/ml (listed in Table 2). 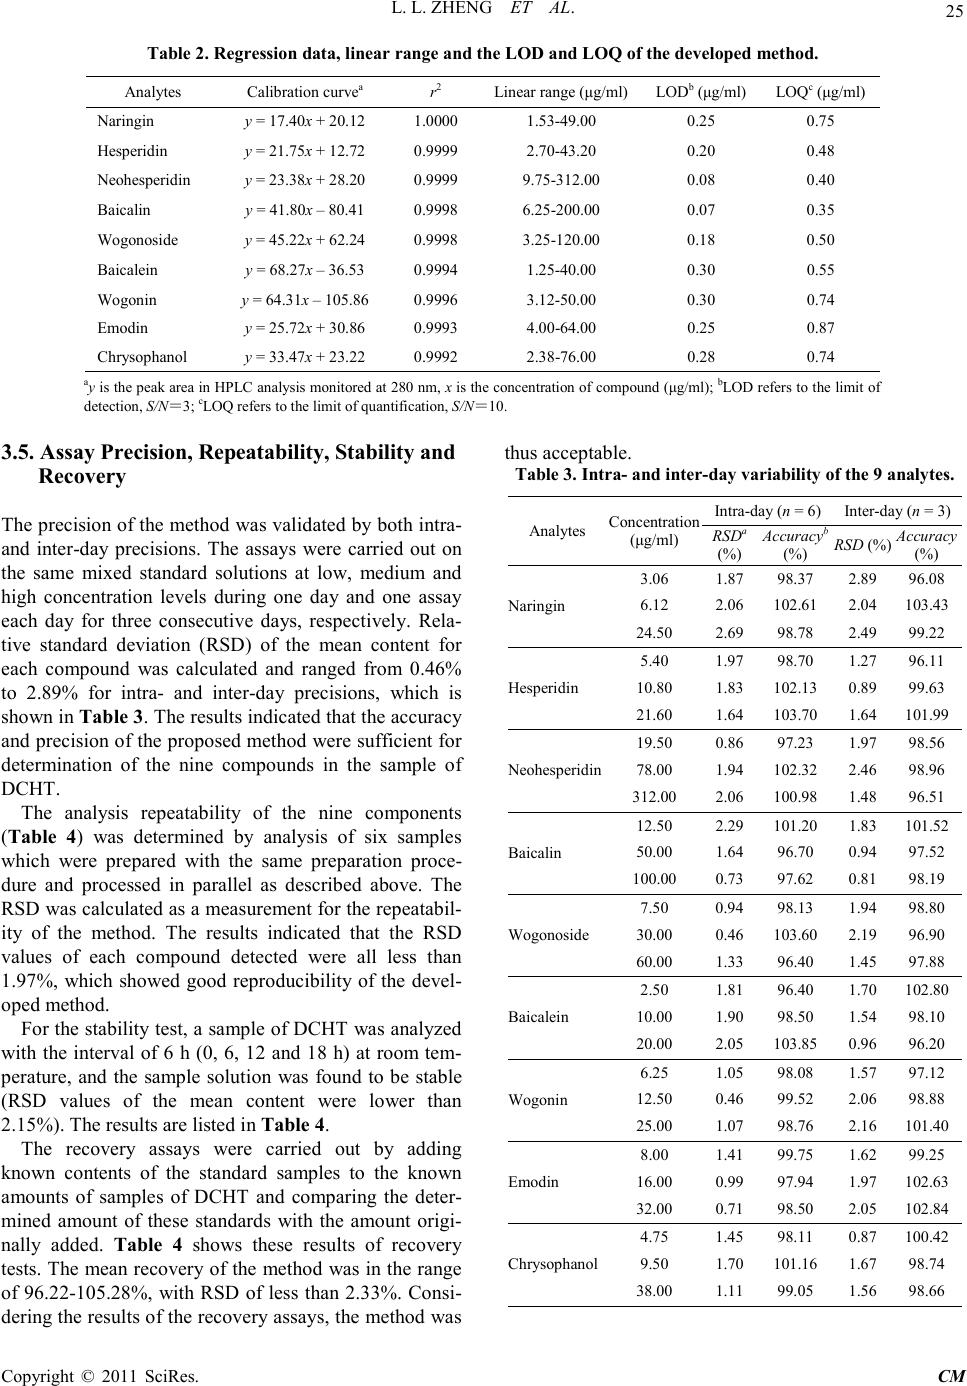 L. L. ZHENG ET AL. Copyright © 2011 SciRes . CM Table 2. Regres sion data, linear range and the LOD a nd LOQ of the develope d method. Analytes Calibration curvea r2 Linear r ange (μg/ml) LODb (μg/ml) LOQc (μg/ml) Nari ngin y = 17.40x + 20.12 1.0000 1.53-49.00 0.25 0.75 Hesperidin y = 21.75x + 12.72 0.9999 2.70-43.20 0.20 0.48 Neohesperidin y = 23.38x + 28.20 0.9999 9.75-312.00 0.08 0.40 Baicalin y = 41.80x – 80.41 0.9998 6.25-200.00 0.07 0.35 Wogonoside y = 45.22x + 62.24 0.9998 3.25-120.00 0.18 0.50 Baicalein y = 68.27x – 36.53 0.9994 1.25-40.00 0.30 0.55 Wogonin y = 64.31x – 105.86 0.9996 3.12-50.00 0.30 0.74 Emod in y = 25.72x + 30.86 0.9993 4.00-64.00 0.25 0.87 Chrysophanol y = 33.47x + 23.22 0.9992 2.38-76.00 0.28 0.74 ay is the pea k area in HPLC analysis m onitored at 280 nm, x is the concentration of compound (μg/ml); bLOD refers to the limi t of detection, S/N=3; cLOQ refers to the limit of quantification, S/N=10. 3.5. Assay Precision, Repeatability, Stability and Recovery The precision of the method was validated by both intra- and inter-day precisions. The assays were carried out on the same mixed standard solutions at low, medium and high concentration levels during one day and one assay each day for three consecutive days, respectively. Rela- tive standard deviation (RSD) of the mean content for each compound was calculated and ranged from 0.46% to 2.89% for intra- and inter-day precisions, which is sho wn in Ta b le 3. T he results indicated that the accuracy and precision of the proposed method were sufficient for determinatio n of the nine compounds in the sample of DCHT. The analysis repeatability of the nine components (Table 4) was determined by analysis of six samples which were prepared with the same preparation proce- dure and processed in parallel as described above. The RSD wa s ca lculated as a measurement for the repeatabil- ity of the method. The results indicated that the RSD values of each compound detected were all less than 1.97%, which showed good reproducibility of the devel- oped method. For the stab ility test, a sample of DCHT was analyzed with the interval of 6 h (0, 6, 12 and 18 h) at room tem- perature, and the sample solution was found to be stable (RSD values of the mean content were lower than 2.15%). The results are listed in Table 4. The recovery assays were carried out by adding known contents of the standard samples to the known amounts of samples of DCHT and comparing the deter- mined amount of these standards with the amount origi- nally added. Table 4 shows these results of recovery tests. The mean recovery of the met hod was in the range of 96.22-105.28%, with RSD of less than 2.33%. Consi- dering the results of the recovery assays, the method was thus acceptable. Table 3. Intra- and inter-day variability of the 9 analytes. Analytes Concentration (μg/ml) Int r a -day (n = 6) Int e r-day (n = 3) RSD (%) Accuracy (%) RSD (%) Accuracy (%) Nari ngin 3.06 1.87 98.37 2.89 96.08 6.12 2.06 102.61 2.04 103.43 24.50 2.69 98.78 2.49 99.22 Hesperidin 5.40 1.97 98.70 1.27 96.11 10.80 1.83 102.13 0.89 99.63 21.60 1.64 103.70 1.64 101.99 Neohesperidin 19.50 0.86 97.23 1.97 98.56 78.00 1.94 102.32 2.46 98.96 312.00 2.06 100.98 1.48 96.51 Baicalin 12.50 2.29 101.20 1.83 101.52 50.00 1.64 96.70 0.94 97.52 100.00 0.73 97.62 0.81 98.19 Wogonoside 7.50 0.94 98.13 1.94 98.80 30.00 0.46 103.60 2.19 96.90 60.00 1.33 96.40 1.45 97.88 Baicalein 2.50 1.81 96.40 1.70 102.80 10.00 1.90 98.50 1.54 98.10 20.00 2.05 103.85 0.96 96.20 Wogonin 6.25 1.05 98.08 1.57 97.12 12.50 0.46 99.52 2.06 98.88 25.00 1.07 98.76 2.16 101.40 Emod in 8.00 1.41 99.75 1.62 99.25 16.00 0.99 97.94 1.97 102.63 32.00 0.71 98.50 2.05 102.84 Chrysophanol 4.75 1.45 98.11 0.87 100.42 9.50 1.70 101.16 1.67 98.74 38.00 1.11 99.05 1.56 98.66  L. L. ZHENG ET AL. Copyright © 2011 SciRes . CM aRSD(%) = (SD/mean) × 100; baccuracy(%) = (mean of measured concen- tration/spiked concentration) × 100. Table 4. Rep eatbility, stability and recove ry results for the assay of the 9 analytes. Analyte Repeatabi l ity (n = 6) Stability (18 h, n = 3) Recoverya (n = 3) Mea n (mg/g) RSD (%) Mean (mg/g) RSD (%) Reco very (% ) RSD (%) Nari ngin 13.92 0.94 13.87 1.68 98.65 1.40 Hesperidin 1.06 1.37 1.02 0.67 99.03 2.33 Neohesperidin 11.51 0.48 11.46 1.27 96.22 1.00 Baicalin 3.49 1.32 3.52 0.80 101.04 0.81 Wogonoside 0.98 0.87 0.94 0.94 98.33 0.48 Baicalein 0.92 0.94 0.95 0.73 105.28 0.92 Wogonin 0.84 1.38 0.86 2.15 97.17 1.05 Emod in 0.70 1.97 0.73 1.67 98.73 1.23 Chrysophanol 0.78 0.86 0.77 1.38 97.54 1.44 aRecovery(%) = (detected amount − original a mount)/spiked amount × 100. 4. Conclusions An HPLC method for simultaneous determination of nine active compounds including rhaponticin, naringin, hesperidin, neohesperidin, baicalin, wogonoside, bai- calein, wogoni n, emod in and chryso phano l in DHC T has not been reported. The presented method in addition to its novelty for determination of nine ingre dients wa s suf- ficiently rapid, simple and sensitive as well as precise and accurate, and it was not interfered with other chemi- cal constituents in DCHT. The linearity, accuracy, preci- sion, LOD and LOQ, specificity-selectivity of the method and sample stability were all established. Although nine compounds were quantitated, there are many other com- ponents in DCHT. More researches can be practiced for further investigation. But the method has several advan- tages, including rapid analysis, simple mobile phase, and simple sample preparation. It was success- fully used for the analysis of compatibility study of a formulation pre- pared in our laboratory and suitable for routine analysis in quality-control la boratories. 5. Acknowledgemen ts This research was partially supported by the excellent young scientists funds (No.2006 J23JH024) of the Science and Technology Foundation of Dalian, China. 6. Referen ces [1] W. Y. Jiang, “Therapeutic Wisdom in Traditional Chi- nese Medicine: A Perspective from Modern Scien ce,” Trends in Pharmacological Sciences, Vol. 26, No. 11, 2005, pp. 558-563. doi:10.1016/j.tips.2005.09.006 [2] B. T. J. Van, “Chemical Analysis of Ginkgo Biloba Leaves and Extracts,” Journal of Chromatography A, Vol. 967, No. 1, 2002, pp. 21-55. doi:10.1016/S0021-9673(02)00172-3 [3] R. L. J. Gra h am, C . Gr a ha m, S . M. Clean, T. B. Chen, M. O’Rourke, D. Hirst, D. Theakston and C. Shaw, “Identi- fication and Functional Analysis of a Novel Bradykinin Inhibitory Peptide in the Venoms of New World Crotali- nae Pit Vipers,” Biochemical and Biophysical Research Communications, Vol. 338, No. 3, 2005, pp . 1587-1592. [4] T. Wu, R. Abdulla, Y. X. Zhao, Y. Yang, J. Chen and H. A. Aisa, “Simultaneous Quantification of Seven Flavo- noids in Flos Gossypii by LC,” Chromatographia, Vol. 68, No. 5, 2008, pp. 467-470. doi:10.1016/j.bbrc.2005.10.130 doi:10.1365/s10337-008-0723-2 [5] X. C. Ma, X. L. Xin , K. X. Liu, B. J. Zhang, F. Y. Li an d D. A. Guo, “Simultaneous Determination of Nine Major Flavonoids in Sophora flavescens by RP-LC,” Chroma- tographia, Vol. 68, No. 5-6, 2008, pp. 471-474. doi:10.1365/s10337-008-0719-y [6] X. W. Shi, J. L. Qi , Y. B. Wu , Y. F u, Y. Z. Wang and D. Q. Zhang, “Simultaneous Quantification of Six Sesqui- terpene Lactones in Inula Britannica L. by RP-LC,” Chromatographia, Vol. 68, No. 3, 2 008, pp . 281-285. doi:10.1365/s10337-008-0698-z [7] J. Kang, L. Zhou, J.B. Sun, J. Han and D. A. Guo, “Chromatographic Fingerprint Analysis and Characteri- zation of Furocoumarins in the Roots of Angelica Dahu- rica by HPLC/DAD/ESI-MSN Technique,” Journal of Pharmaceutical and Biomedical Analysis, Vol. 47, No. 4-5, 2008, pp. 778-785. doi:10.1016/j.jpba.2008.03.010 [8] J. Su, P. Fu, Y. H. Shen, C. Zhang, M. J. Lian g, R . H. Li u , H. L. Li and W. D. Zhang, “Simultaneous Analysis of Flavonoids from Hypericum Japonicum Thunb.ex Mur- ray (Hypericaceae) by HPLC-DAD -ESI/MS,” Journal of Pharmaceutical and Biomedi ca l Analysis, Vol. 46, No. 2, 2008, pp . 342-348. doi:10.1016/j.jpba.2007.10.032 [9] W. Li, Y. L. Deng, R. J. Dai, Y. H. Yu, M. K. Saeed, L.  L. L. ZHENG ET AL. Copyright © 2011 SciRes . CM Li, W. W. Meng and X. S. Zhang, “Chromatographic Fingerprint Analysis of Cephalotaxus Sinensis from Var- ious Sources by High-Performance Liquid Chroma- to- graphy-Diodearray Detection-Electrospray Ionization- Tandem Mass Spectrometry,” Journal of Pharmaceutical and Biomedical Analysis, Vol. 45, No. 1, 2007, pp. 38-46. doi:10.1016/j.jpba.2007.05.027 [10] W. Jin, R. L. Ge, Q. J. Wei, T. Y. Bao, H. M. Shi and P. F. Tu, “Development of High-Performance Liquid Chromatographic Fingerprint for the Quality Control of Rheum Tanguticum Maxim.ex Balf.,” Journal of Chromatography A, Vol. 1132, No. 1-2, 2006, pp. 320- 324. doi:10.1016/j.chroma.2006.08.022 [11] S. H. Zhou, “Thirty Cases of Chronic Cholecystitis Treated by Acupuncture and Oral Adiministration of Da Chai Hu Tang,” Journal of Traditional Chinese Medicine, Vol. 28, No. 2, 2008, pp. 173-174. [12] Y. Fumihiko, I. Akira, K. Yasuhiro, M. Akiyo, I. Hiro- shige and K. Kazuo, “Effects of Dai-saiko-to (Da-Chai- Hu-Tang) on Plasma Lipids and Atherosclerotic Lesions in Female Heterozygous Heritable Kurosawa and Kusa- nagi Hyp e r Cholesterolemic (KHC) Rabbits,” Pharma- cological Research, Vol. 50, No. 1-2, 2004, pp. 223- 230. doi:10.1016/S0254-6272(08)60039-4 [13] I. Akira, T. I. Osamu, Y. Fumihiko, M. Bunsho, A. Sakae, K. Yasuhiro, K. Kazuo, M. Akiyo and I. Hiroshige, “In- hibitory Effects of Dai-saiko-to (Da-Chai-Hu-Tang) on the Progression of Atherosclerotic Lesions in Kurosawa and Kusanagi Hype r -Cholesterolemic Rabb its,” Journal of Ethnopharmacology, Vol. 63, No. 3, 1998, pp. 209-218. doi:10.1016/j.phrs.2004.02.003 [14] Y. Masaki, S. Atsushi, J. Hi roko, Y. Naoki and H. Tada- shi, “Glucosyl Hesperidin Prevents Endothelial Dysfunc- tion and Oxidative Stress in Spontaneously Hypertensive rats,” Nutrition, Vol. 24, No. 5, 2008, pp. 470-476. doi:10.1016/S0378-8741(98)00083-X [15] P. Kannampalli, H. P. Sang, C. K. Kyong, “Hesperidin a Flavanoglycone Protects against γ-irradiation Induced Hepatocellular Damage and Oxidative Stress in Spra- gue–Dawley Rats,” European Journal of Pharmacology, Vol. 587, No. 1, 2008, pp. 273-280. doi:10.1016/j.nut.2008.01.010 [16] G. H. Xu, D. H. Liu, J. C. Chen, X. Q. Ye, Y. Q. Ma and J. Shi, “Juice Components and Antioxidant Capacity of Citrus Varieties Cultivated in China,” Food Chemistry, Vol. 106, No. 2, 2008, pp. 545-551. doi:10.1016/j.ejphar.2008.03.052 [17] P. F. Sebastian, W. Cri stina, C. P. Alejandro and M. M a- riel, “Synergistic Interaction between Hesperidin, a Nat- ural Flavonoid, and Diazepam,” European Journal of Pharmacology, Vol. 512, No. 2-3, 2005, pp . 189-198. doi:10.1016/j.foodchem.2007.06.046 [18] K. Gaganjit, T. Naveen and C. Kanwaljit, “Beneficial Effect of Hesperidin on Lipopolysaccharide-induced He- patotoxicity,” Toxicology, Vol. 226, No. 2-3, 2006, pp. 152-160. doi:10.1016/j.ejphar.2005.02.039 [19] L. L. Liu , L. K. Gong, H. Wang, Y. Xiao, X. F. Wu, Y. H. doi:10.1016/j.tox.2006.06.018 Zhang, X. Xue, X. M. Qi and J. Ren, “Baicalin Inhibits Macrophage Activation by Lipopolysaccharide and Pro- tects Mice from Endotoxin Shock,” Biochemical Phar- macology, Vol. 75, No. 4, 2008, pp. 914-922. [20] H. Y. Lin, S. C. Shen, C. W. Lin, L. Y. Yang and Y. C. Chen, “Baicalein Inhibition of Hydrogen Perox- ide-induced Apoptosis via ROS-dependent Heme Oxy- genase 1 Gene Expressio n,” Biochimica et Biophysica Acta, Vol. 1773, No. 7, 2007, pp. 1073-1086. doi:10.1016/j.bcp.2007.10.009 [21] K. J. Woo , J. H. Lim, S. Suh, Y. K. Kwon, S. W. Shin, S. C. Kim, Y. H. Choi, J. W. P ark and T. K. Kwon, “Diffe- rential Inhibitory Effects of Baicalein and Baicalin on LPS-induced Cyclooxygenase-2 Expression through In- hibition of C/EBPβ DNA-binding Activity,” Immunobi- ology, Vol. 211, No. 5, 2006, pp. 359-368. doi:10.1016/j.bbamcr.2007.04.008 [22] H. Mika, O. Takashi, F. Harumi, T. Miho, Y. Shin-ichi, U. Sadaharu, N. Koji, Y. Hisako, T. Kachio and M. Akio, “Difference of Gro wth -inhibitory Effect of Scutellaria Baicalensis-producing Flavonoid Wogonin among Hu- man Cancer Cells,” Cancer Letter s, Vol. 245, No. 1-2, 2007, pp . 269-274. doi:10.1016/j.imbio.2006.02.002 [23] C. S. Chen, N. J. Chen, L. W. Lin, C. C. Hsieh, G. W. Chen and M. T. Hsieh, “Effects of Scutellariae Radix on Gene Expression in HEK 293 Cells Using cDNA Micro- array,” Journal of Ethnopharmacology, Vol. 105, No. 3, 2006, pp. 346-351. doi:10.1016/j.canlet.2006.01.011 [24] Y. Hu, Y. Yang, Q. D. You, W. Liu, H. Y. Gu, L. Zhao, K. Zhang, W. Wang, X. T. Wan g and Q. L. Guo, “Orox- ylin A Induced Apoptosis of Human Hepatocellular Car- cinoma Cell Line HepG2 was Involved in Its Antitumor Activity,” Biochemical and Biophysical Research Com- munications, Vol. 351, No. 2, 2006, pp. 521-527. doi:10.1016/j.jep.2005.11.012 doi:10.1016/j.bbrc.2006.10.064 [25] Y. Ding, L. Zhao, H. Mei, S. L. Zhang, Z. H. Huang, Y. Y. Duan and P. Ye, “Exploration of Emodin to Treat Al- pha-naphthylisothiocyanate-induced Cholestatic Hepatitis via Anti-inflammatory Pathway,” European Journal of Pharmacology, Vol. 590, No. 1-3, 2008, pp . 377-386. doi:10.1016/j.ejphar.2008.06.044 [26] J. M. Cherng, W. Chiang, J. H. Wang, C. M. Lin, C. Y. Lee, C. M. Shih and L. C. Chiang, “Anthraquinones of Edible Wild Vegetable Cassia Tora Stimulate Prolifera- tion of Human CD4+ T Lymphocytes and Secretion of Interferon-gamma or Interleukin 10,” Food Chemistry, Vol. 107, No. 4, 2008, pp. 1576-1580. [27] X. Zhou, B. A. Song, L. H. Jin, D. Y. Hu, C. L. Diao, G. F. Xu, Z. H. Zou and S. Yang, “Isolation and Inhibitory Activity against ERK Phosphorylation of Hydroxyanth- raquinones from Rhubarb,” Bioorganic & Medicinal Chemistry Letters, Vol. 16, No. 3, 2006, pp . 563-568. doi:10.1016/j.foodchem.2007.10.005 [28] I. Akira, T. I. Osamu, K. Kazuo, I. Hiroshige, Y. Fumi- hiko, M. Hiroko, K. Masayoshi, H. Masami, T. Hiroshi and M. Teruhiko, “Evaluation of Rhubarb Using Anti- oxidative Activity as an Index of Pharmacological Use- doi:10.1016/j.bmcl.2005.10.047  L. L. ZHENG ET AL. Copyright © 2011 SciRes . CM fulness,” Journal of Ethnopharmacology, Vol. 91, No. 1, 2004, pp. 89-94. [29] Y. C. Chen, S. C. Shen, W. R. Lee, F. L. Hsu, H. Y. Lin, C. H. Ko and S. W. Tseng, “Emodin Induces Apoptosis doi:10.1016/j.jep.2003.11.021 in Human Promyeloleukemic HL-60 Cells Accompanied by Activation of Caspase 3 Cascade but Independent of Reactive Oxygen Species Production,” Biochemical Pharmacology, Vol. 64, No. 12, 2002, pp. 1713-1724.
|