Paper Menu >>
Journal Menu >>
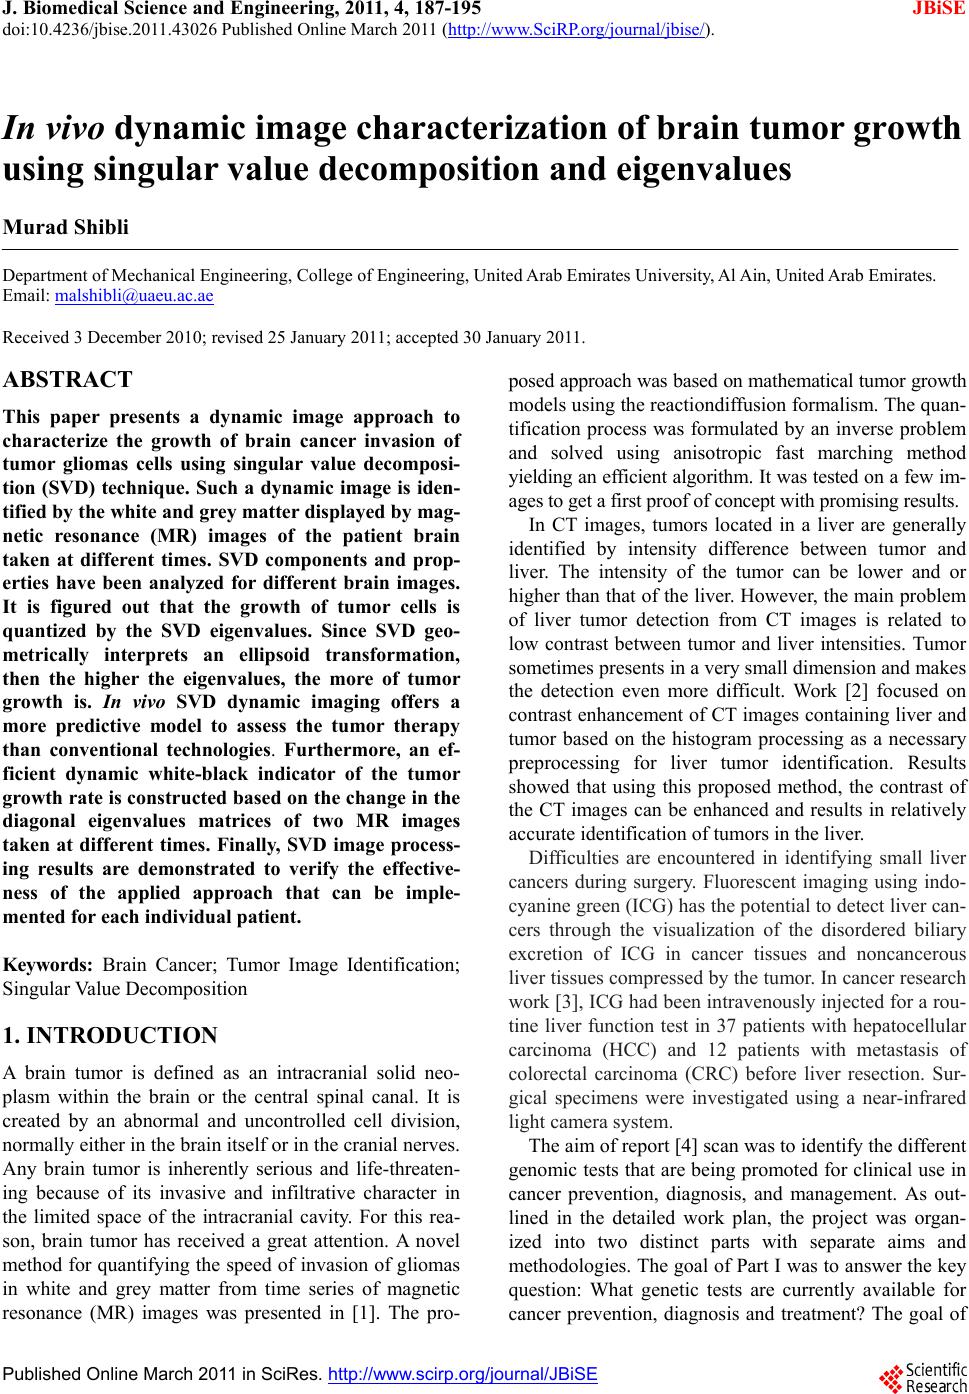 J. Biomedical Science and Engineering, 2011, 4, 187-195 JBiSE doi:10.4236/jbise.2011.43026 Published Online March 2011 (http://www.SciRP.org/journal/jbise/). Published Online March 2011 in SciRes. http://www.scirp.org/jour nal/JBiSE In vivo dynamic image characterization of brain tumor growth using singular value decomposition and eigenvalues Murad Shibli Department of Mechanical Engineering, College of Engineering, United Arab Emirates University, Al Ain, United Arab Emirates. Email: malshibli@uaeu.ac.ae Received 3 December 2010; revised 25 January 2011; accepted 30 January 2011. ABSTRACT This paper presents a dynamic image approach to characterize the growth of brain cancer invasion of tumor gliomas cells using singular value decomposi- tion (SVD) technique. Such a dynamic image is iden- tified by the white and grey matter displayed by mag- netic resonance (MR) images of the patient brain taken at different times. SVD components and prop- erties have been analyzed for different brain images. It is figured out that the growth of tumor cells is quantized by the SVD eigenvalues. Since SVD geo- metrically interprets an ellipsoid transformation, then the higher the eigenvalues, the more of tumor growth is. In vivo SVD dynamic imaging offers a more predictive model to assess the tumor therapy than conventional technologies. Furthermore, an ef- ficient dynamic white-black indicator of the tumor growth rate is constructed based on the change in the diagonal eigenvalues matrices of two MR images taken at different times. Finally, SVD image process- ing results are demonstrated to verify the effective- ness of the applied approach that can be imple- mented for each individual patient. Keywords: Brain Cancer; Tumor Image Identification; Singular Value Decomposition 1. INTRODUCTION A brain tumor is defined as an intracranial solid neo- plasm within the brain or the central spinal canal. It is created by an abnormal and uncontrolled cell division, normally either in the brain itself or in the cranial nerves. Any brain tumor is inherently serious and life-threaten- ing because of its invasive and infiltrative character in the limited space of the intracranial cavity. For this rea- son, brain tumor has received a great attention. A novel method for quantifying the speed of invasion of gliomas in white and grey matter from time series of magnetic resonance (MR) images was presented in [1]. The pro- posed approach was based on mathematical tumor growth models using the reactiondiffusion formalism. The quan- tification process was formulated by an inverse problem and solved using anisotropic fast marching method yielding an efficient algorithm. It was tested on a few im- ages to get a first proof of concept with promising results. In CT images, tumors located in a liver are generally identified by intensity difference between tumor and liver. The intensity of the tumor can be lower and or higher than that of the liver. However, the main problem of liver tumor detection from CT images is related to low contrast between tumor and liver intensities. Tumor sometimes presents in a very small dimension and makes the detection even more difficult. Work [2] focused on contrast enhancement of CT images containing liver and tumor based on the histogram processing as a necessary preprocessing for liver tumor identification. Results showed that using this proposed method, the contrast of the CT images can be enhanced and results in relatively accurate identification of tumors in the liver. Difficulties are encountered in identifying small liver cancers during surgery. Fluorescent imaging using indo- cyanine green (ICG) has the potential to detect liver can- cers through the visualization of the disordered biliary excretion of ICG in cancer tissues and noncancerous liver tissues compressed by the tumor. In cancer research work [3], ICG had been intravenously injected for a rou- tine liver function test in 37 patients with hepatocellular carcinoma (HCC) and 12 patients with metastasis of colorectal carcinoma (CRC) before liver resection. Sur- gical specimens were investigated using a near-infrared light camera system. The aim of report [4] scan was to identify the different genomic tests that are being promoted for clinical use in cancer prevention, diagnosis, and management. As out- lined in the detailed work plan, the project was organ- ized into two distinct parts with separate aims and methodologies. The goal of Part I was to answer the key question: What genetic tests are currently available for cancer prevention, diagnosis and treatment? The goal of 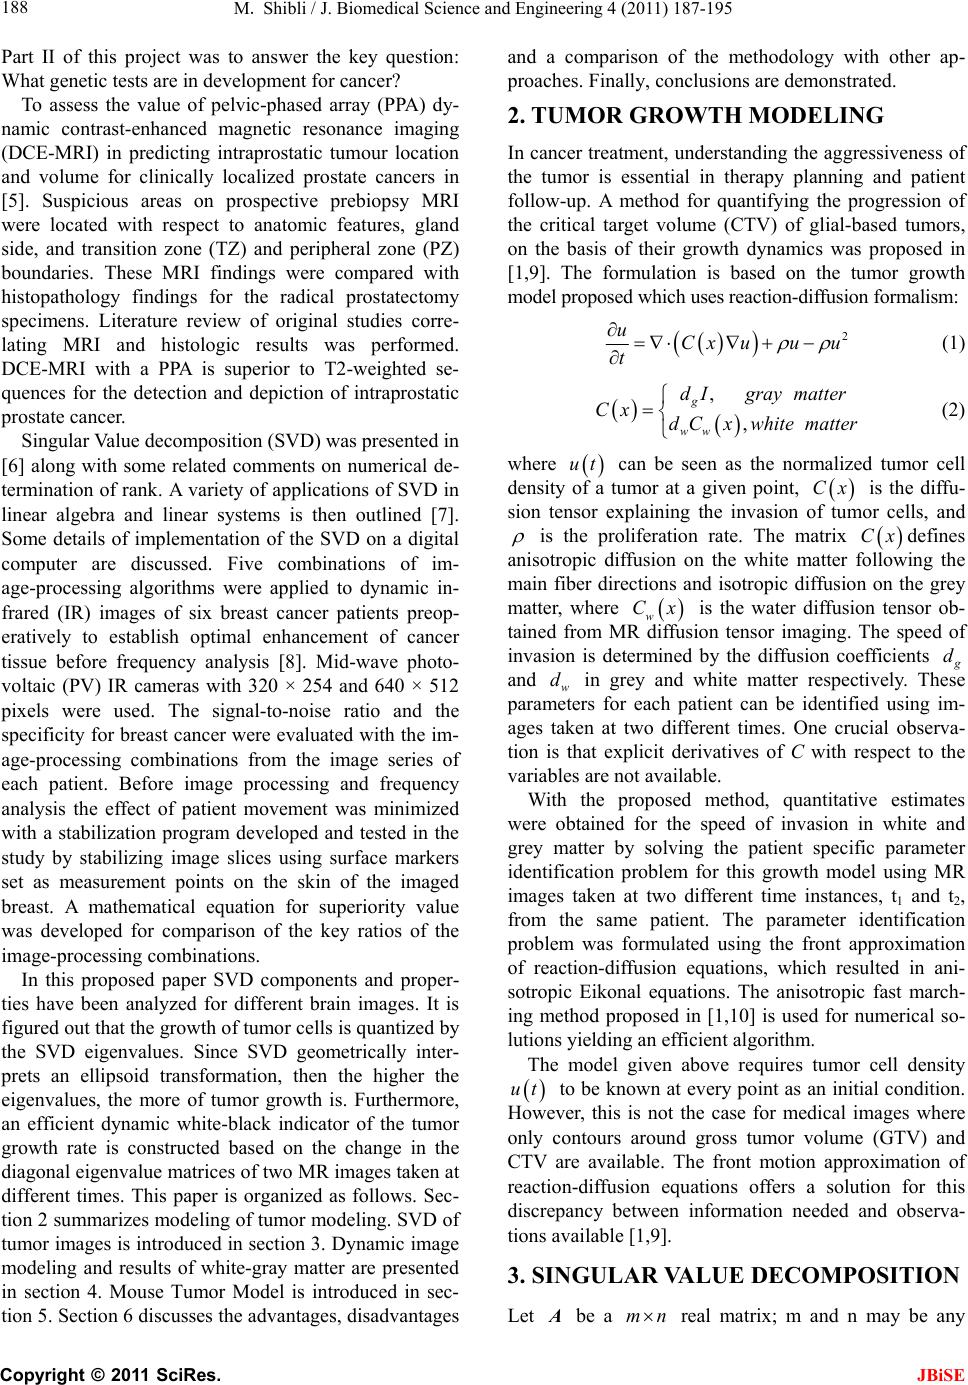 M. Shibli / J. Biomedical Science and Engineering 4 (2011) 187-195 Copyright © 2011 SciRes. JBiSE 188 Part II of this project was to answer the key question: What genetic tests are in development for cancer? To assess the value of pelvic-phased array (PPA) dy- namic contrast-enhanced magnetic resonance imaging (DCE-MRI) in predicting intraprostatic tumour location and volume for clinically localized prostate cancers in [5]. Suspicious areas on prospective prebiopsy MRI were located with respect to anatomic features, gland side, and transition zone (TZ) and peripheral zone (PZ) boundaries. These MRI findings were compared with histopathology findings for the radical prostatectomy specimens. Literature review of original studies corre- lating MRI and histologic results was performed. DCE-MRI with a PPA is superior to T2-weighted se- quences for the detection and depiction of intraprostatic prostate cancer. Singular Value decomposition (SVD) was presented in [6] along with some related comments on numerical de- termination of rank. A variety of applications of SVD in linear algebra and linear systems is then outlined [7]. Some details of implementation of the SVD on a digital computer are discussed. Five combinations of im- age-processing algorithms were applied to dynamic in- frared (IR) images of six breast cancer patients preop- eratively to establish optimal enhancement of cancer tissue before frequency analysis [8]. Mid-wave photo- voltaic (PV) IR cameras with 320 × 254 and 640 × 512 pixels were used. The signal-to-noise ratio and the specificity for breast cancer were evaluated with the im- age-processing combinations from the image series of each patient. Before image processing and frequency analysis the effect of patient movement was minimized with a stabilization program developed and tested in the study by stabilizing image slices using surface markers set as measurement points on the skin of the imaged breast. A mathematical equation for superiority value was developed for comparison of the key ratios of the image-processing combinations. In this proposed paper SVD components and proper- ties have been analyzed for different brain images. It is figured out that the growth of tumor cells is quantized by the SVD eigenvalues. Since SVD geometrically inter- prets an ellipsoid transformation, then the higher the eigenvalues, the more of tumor growth is. Furthermore, an efficient dynamic white-black indicator of the tumor growth rate is constructed based on the change in the diagonal eigenvalue matrices of two MR images taken at different times. This paper is organized as follows. Sec- tion 2 summarizes modeling of tumor modeling. SVD of tumor images is introduced in section 3. Dynamic image modeling and results of white-gray matter are presented in section 4. Mouse Tumor Model is introduced in sec- tion 5. Section 6 discusses the advantages, disadvantages and a comparison of the methodology with other ap- proaches. Finally, conclusions are demonstrated. 2. TUMOR GROWTH MODELING In cancer treatment, understanding the aggressiveness of the tumor is essential in therapy planning and patient follow-up. A method for quantifying the progression of the critical target volume (CTV) of glial-based tumors, on the basis of their growth dynamics was proposed in [1,9]. The formulation is based on the tumor growth model proposed which uses reaction-diffusion formalism: 2 uCx uuu t (1) , , g ww d Igraymatter Cx d Cxwhitematter (2) where ut can be seen as the normalized tumor cell density of a tumor at a given point, Cx is the diffu- sion tensor explaining the invasion of tumor cells, and is the proliferation rate. The matrix Cxdefines anisotropic diffusion on the white matter following the main fiber directions and isotropic diffusion on the grey matter, where w Cx is the water diffusion tensor ob- tained from MR diffusion tensor imaging. The speed of invasion is determined by the diffusion coefficients g d and w d in grey and white matter respectively. These parameters for each patient can be identified using im- ages taken at two different times. One crucial observa- tion is that explicit derivatives of C with respect to the variables are not available. With the proposed method, quantitative estimates were obtained for the speed of invasion in white and grey matter by solving the patient specific parameter identification problem for this growth model using MR images taken at two different time instances, t1 and t2, from the same patient. The parameter identification problem was formulated using the front approximation of reaction-diffusion equations, which resulted in ani- sotropic Eikonal equations. The anisotropic fast march- ing method proposed in [1,10] is used for numerical so- lutions yielding an efficient algorithm. The model given above requires tumor cell density ut to be known at every point as an initial condition. However, this is not the case for medical images where only contours around gross tumor volume (GTV) and CTV are available. The front motion approximation of reaction-diffusion equations offers a solution for this discrepancy between information needed and observa- tions available [1,9]. 3. SINGULAR VALUE DECOMPOSITION Let A be a mn real matrix; m and n may be any 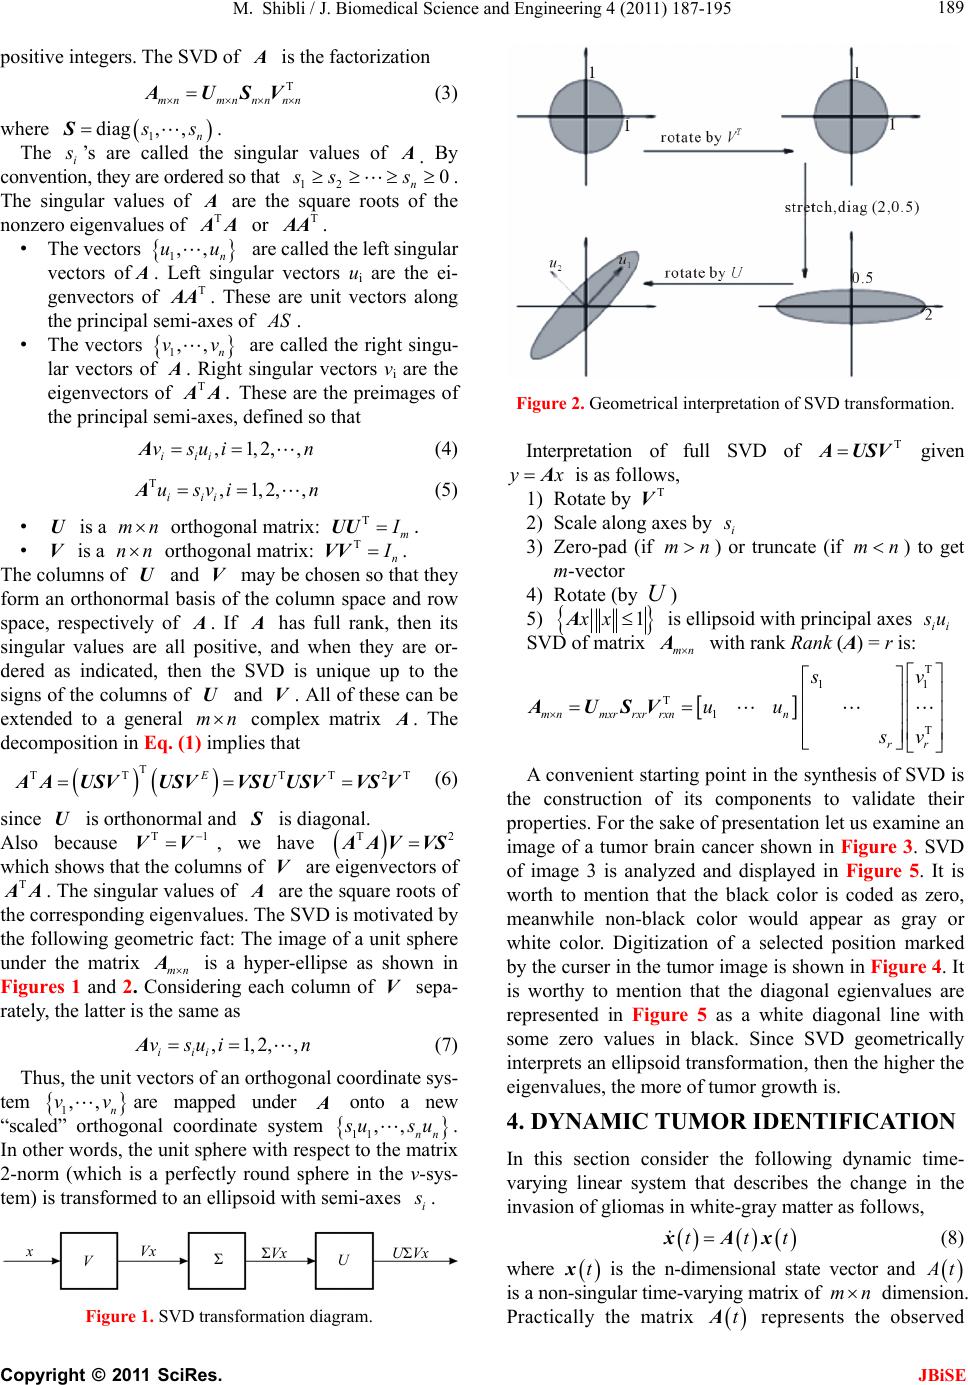 M. Shibli / J. Biomedical Science and Engineering 4 (2011) 187-195 Copyright © 2011 SciRes. JBiSE 189 positive integers. The SVD of A is the factorization T mnmnnn nn A USV (3) where 1 diag,,n s sS. The i s ’s are called the singular values of A. By convention, they are ordered so that 12 0 n ss s. The singular values of A are the square roots of the nonzero eigenvalues of T A A or T A A. • The vectors 1,, n uuare called the left singular vectors ofA. Left singular vectors ui are the ei- genvectors of T A A. These are unit vectors along the principal semi-axes of A S. • The vectors 1,, n vvare called the right singu- lar vectors of A. Right singular vectors vi are the eigenvectors of T A A.These are the preimages of the principal semi-axes, defined so that ,1,2,, iii vsui nA (4) T,1,2,, iii usvi nA (5) • U is a mn orthogonal matrix: Tm I UU . • V is a nn orthogonal matrix: Tn I VV . The columns of U and V may be chosen so that they form an orthonormal basis of the column space and row space, respectively of A. If A has full rank, then its singular values are all positive, and when they are or- dered as indicated, then the SVD is unique up to the signs of the columns of U and V. All of these can be extended to a general mn complex matrix A. The decomposition in Eq. (1) implies that T TT TT2TE A AUSVUSVVSUUSVVS V (6) since U is orthonormal and S is diagonal. Also because T1 VV, we have T2 AAV VS which shows that the columns of V are eigenvectors of T A A. The singular values of A are the square roots of the corresponding eigenvalues. The SVD is motivated by the following geometric fact: The image of a unit sphere under the matrix mn A is a hyper-ellipse as shown in Figures 1 and 2. Considering each column of V sepa- rately, the latter is the same as ,1,2,, iii vsui nA (7) Thus, the unit vectors of an orthogonal coordinate sys- tem 1,, n vvare mapped under A onto a new “scaled” orthogonal coordinate system 11 ,, nn s usu. In other words, the unit sphere with respect to the matrix 2-norm (which is a perfectly round sphere in the v-sys- tem) is transformed to an ellipsoid with semi-axes i s . x Vx V Σ U ΣVx UΣVx Figure 1. SVD transformation diagram. Figure 2. Geometrical interpretation of SVD transformation. Interpretation of full SVD of T AUSV given yx A is as follows, 1) Rotate by T V 2) Scale along axes by i s 3) Zero-pad (if mn) or truncate (if mn ) to get m-vector 4) Rotate (by U) 5) 1xx A is ellipsoid with principal axes ii s u SVD of matrix mn A with rank Rank (A) = r is: T 11 T 1 T mnmxrrxrrxnn rr s v uu s v AUSV A convenient starting point in the synthesis of SVD is the construction of its components to validate their properties. For the sake of presentation let us examine an image of a tumor brain cancer shown in Figure 3. SVD of image 3 is analyzed and displayed in Figure 5. It is worth to mention that the black color is coded as zero, meanwhile non-black color would appear as gray or white color. Digitization of a selected position marked by the curser in the tumor image is shown in Figure 4. It is worthy to mention that the diagonal egienvalues are represented in Figure 5 as a white diagonal line with some zero values in black. Since SVD geometrically interprets an ellipsoid transformation, then the higher the eigenvalues, the more of tumor growth is. 4. DYNAMIC TUMOR IDENTIFICATION In this section consider the following dynamic time- varying linear system that describes the change in the invasion of gliomas in white-gray matter as follows, ttt xAx (8) where tx is the n-dimensional state vector and A t is a non-singular time-varying matrix of mn dimension. Practically the matrix tA represents the observed 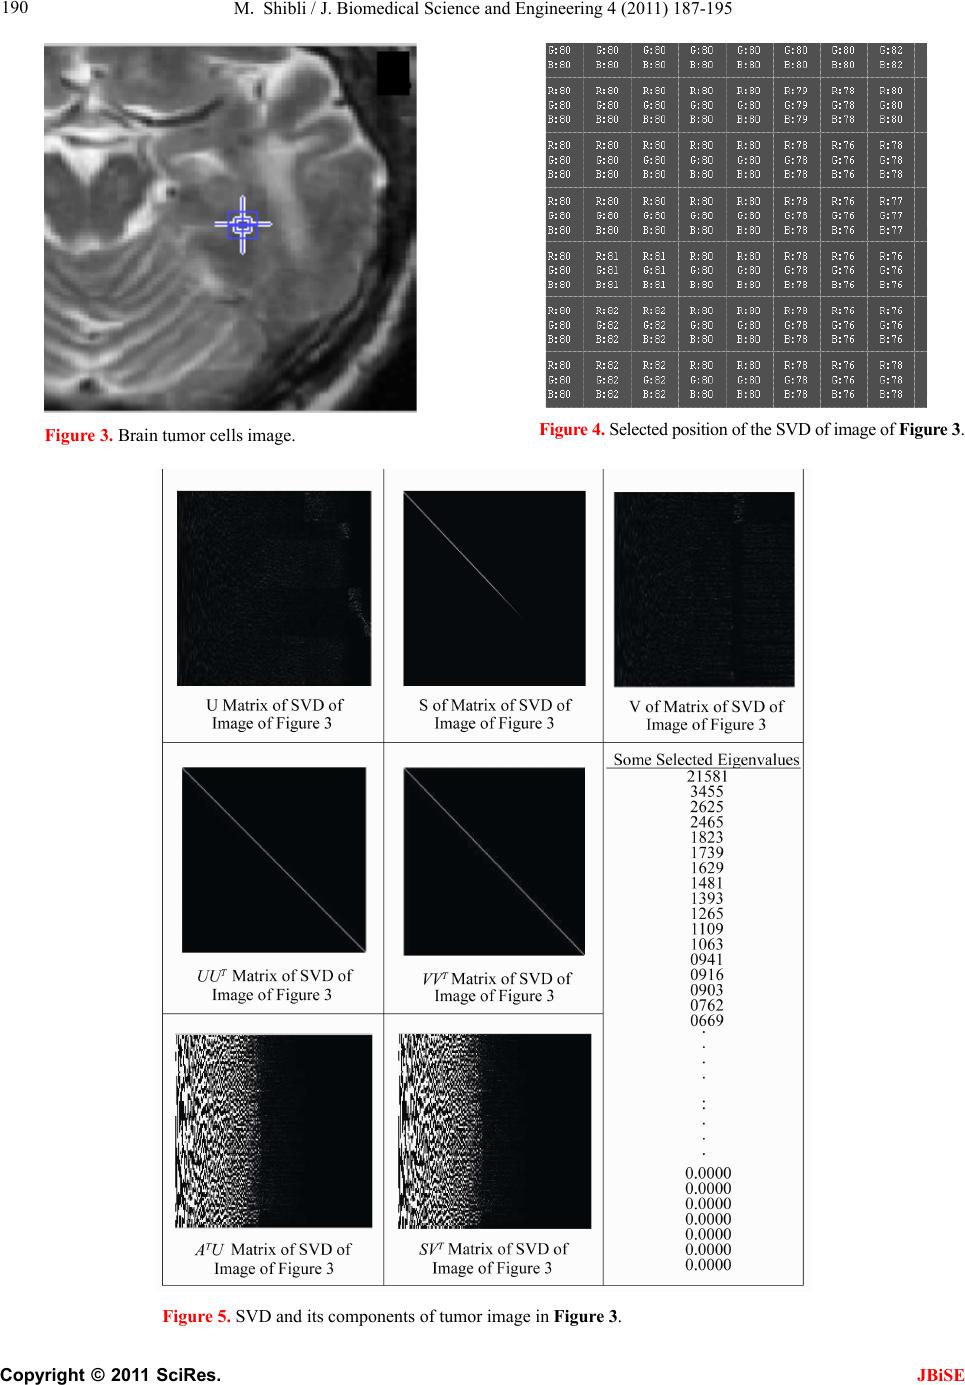 M. Shibli / J. Biomedical Science and Engineering 4 (2011) 187-195 Copyright © 2011 SciRes. JBiSE 190 Figure 3. Brain tumor cells image. Figure 4. Selected position of the SVD of image of Figur e 3 . Figure 5. SVD and its components of tumor image in Figure 3. 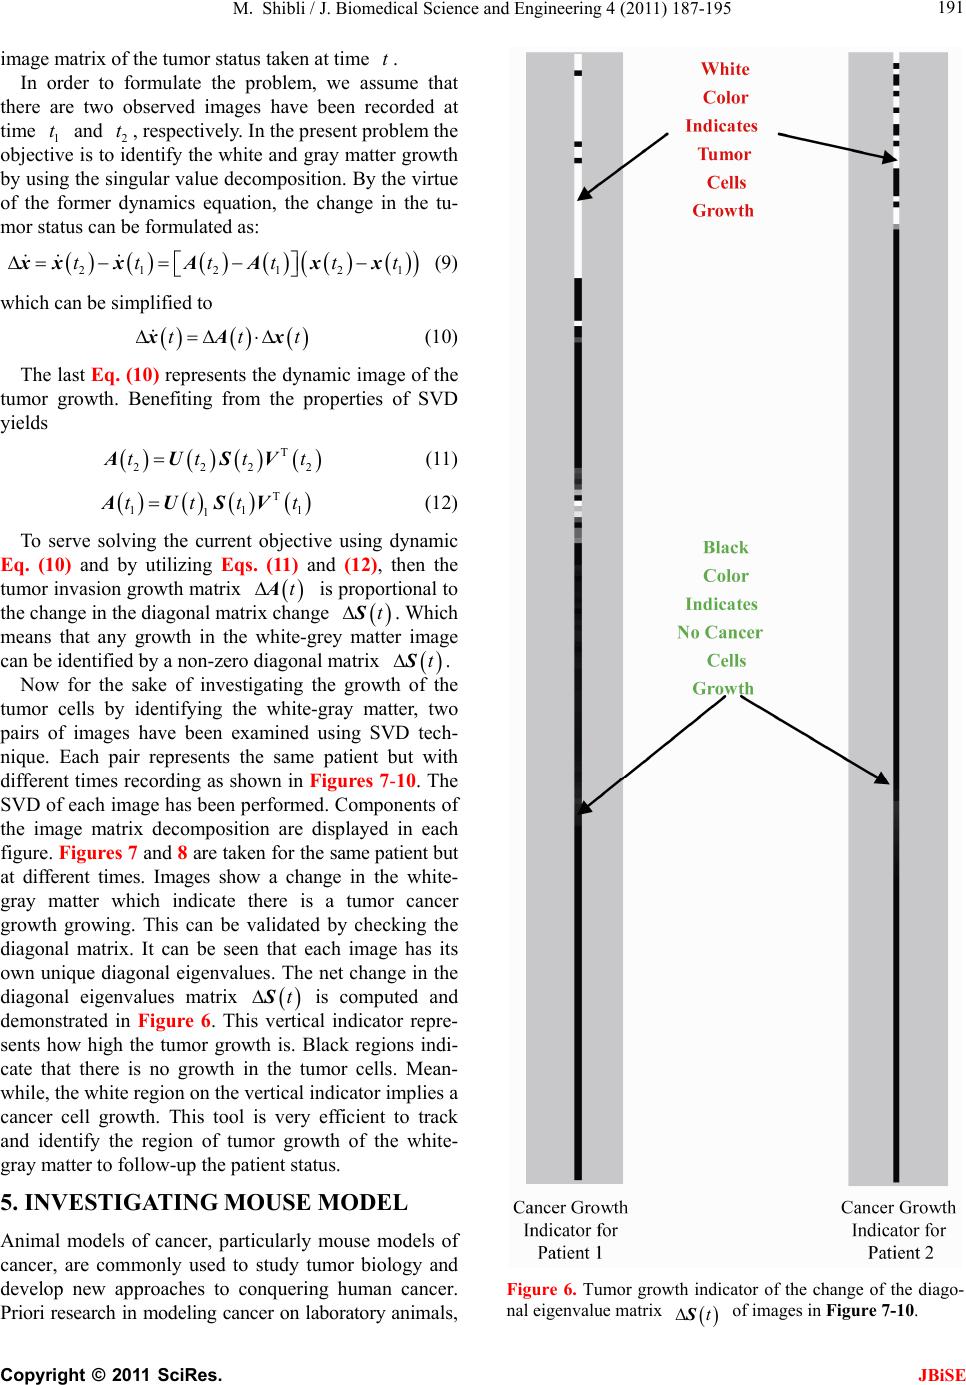 M. Shibli / J. Biomedical Science and Engineering 4 (2011) 187-195 Copyright © 2011 SciRes. JBiSE 191 image matrix of the tumor status taken at time t. In order to formulate the problem, we assume that there are two observed images have been recorded at time 1 t and 2 t, respectively. In the present problem the objective is to identify the white and gray matter growth by using the singular value decomposition. By the virtue of the former dynamics equation, the change in the tu- mor status can be formulated as: 212 1 21 tt tttt xx xAAx x (9) which can be simplified to ttt xAx (10) The last Eq. (10) represents the dynamic image of the tumor growth. Benefiting from the properties of SVD yields T 2222 ttttAUSV (11) T 111 1 ttttAUSV (12) To serve solving the current objective using dynamic Eq. (10) and by utilizing Eqs. (11) and (12), then the tumor invasion growth matrix tA is proportional to the change in the diagonal matrix change tS. Which means that any growth in the white-grey matter image can be identified by a non-zero diagonal matrix tS. Now for the sake of investigating the growth of the tumor cells by identifying the white-gray matter, two pairs of images have been examined using SVD tech- nique. Each pair represents the same patient but with different times recording as shown in Figures 7-10. The SVD of each image has been performed. Components of the image matrix decomposition are displayed in each figure. Figures 7 and 8 are taken for the same patient but at different times. Images show a change in the white- gray matter which indicate there is a tumor cancer growth growing. This can be validated by checking the diagonal matrix. It can be seen that each image has its own unique diagonal eigenvalues. The net change in the diagonal eigenvalues matrix tS is computed and demonstrated in Figure 6. This vertical indicator repre- sents how high the tumor growth is. Black regions indi- cate that there is no growth in the tumor cells. Mean- while, the white region on the vertical indicator implies a cancer cell growth. This tool is very efficient to track and identify the region of tumor growth of the white- gray matter to follow-up the patient status. 5. INVESTIGATING MOUSE MODEL Animal models of cancer, particularly mouse models of cancer, are commonly used to study tumor biology and develop new approaches to conquering human cancer. Priori research in modeling cancer on laboratory animals, Figure 6. Tumor growth indicator of the change of the diago- nal eigenvalue matrix tS of images in Figure 7-10. 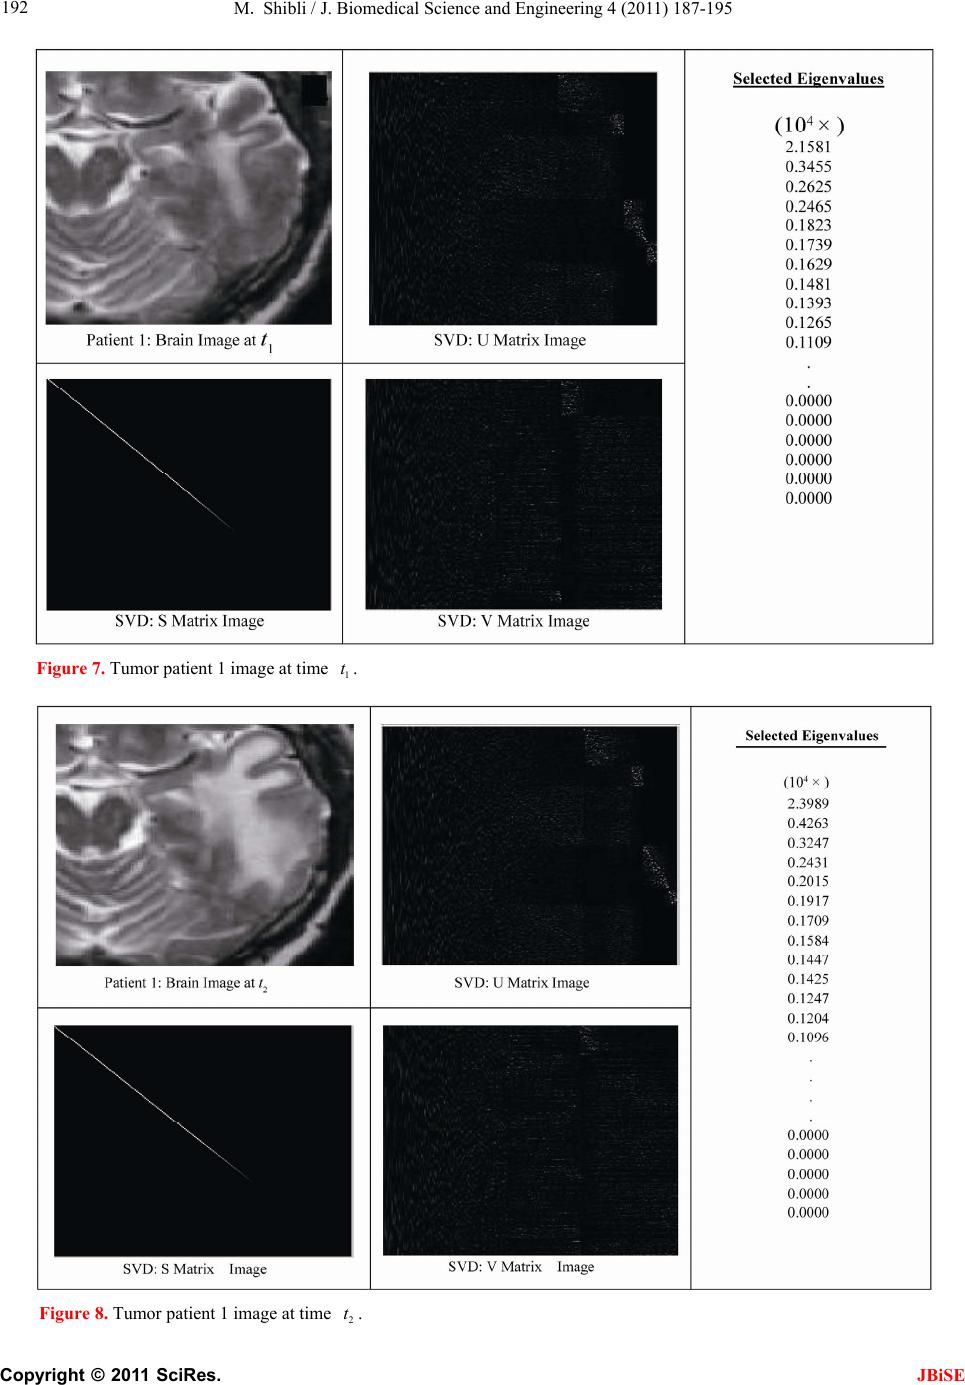 M. Shibli / J. Biomedical Science and Engineering 4 (2011) 187-195 Copyright © 2011 SciRes. JBiSE 192 Figure 7. Tumor patient 1 image at time 1 t. Figure 8. Tumor patient 1 image at time 2 t. 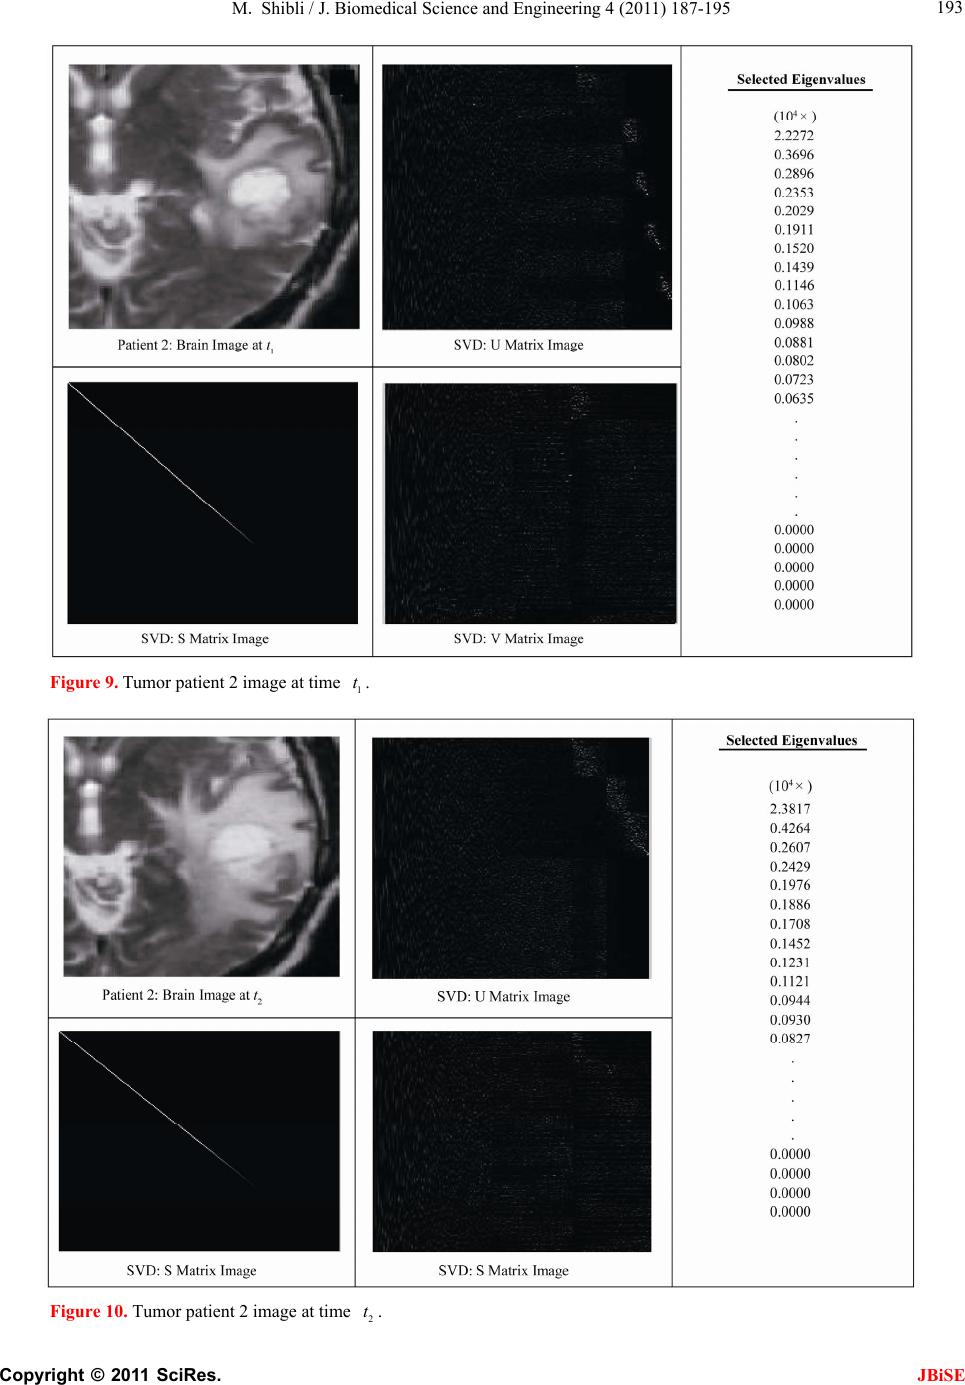 M. Shibli / J. Biomedical Science and Engineering 4 (2011) 187-195 Copyright © 2011 SciRes. JBiSE 193 Figure 9. Tumor patient 2 image at time 1 t. Figure 10. Tumor patient 2 image at time 2 t. 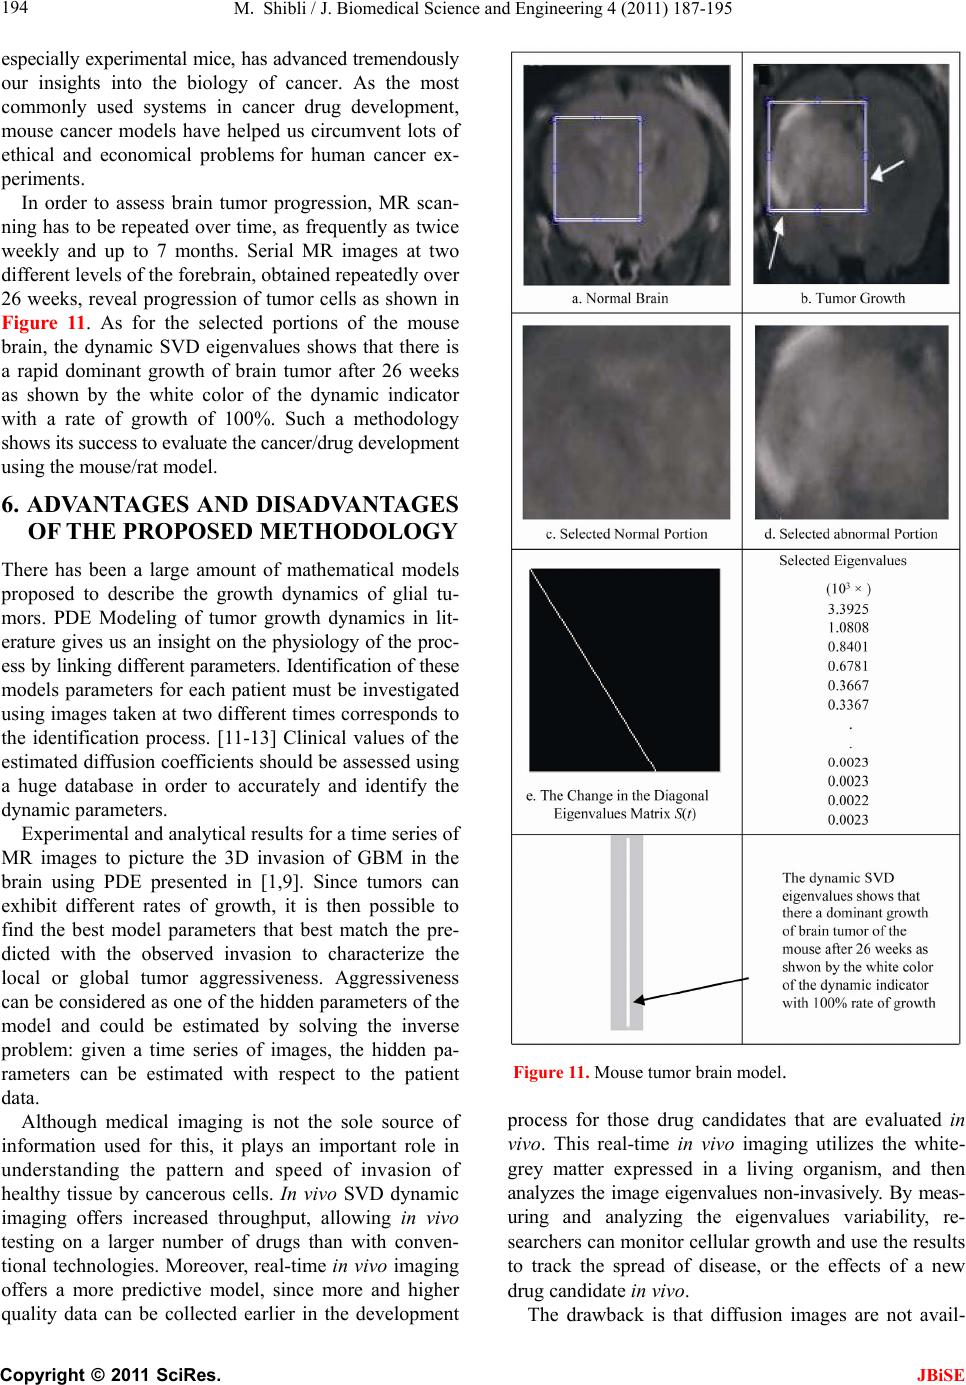 M. Shibli / J. Biomedical Science and Engineering 4 (2011) 187-195 Copyright © 2011 SciRes. JBiSE 194 especially experimental mice, has advanced tremendously our insights into the biology of cancer. As the most commonly used systems in cancer drug development, mouse cancer models have helped us circumvent lots of ethical and economical problems for human cancer ex- periments. In order to assess brain tumor progression, MR scan- ning has to be repeated over time, as frequently as twice weekly and up to 7 months. Serial MR images at two different levels of the forebrain, obtained repeatedly over 26 weeks, reveal progression of tumor cells as shown in Figure 11. As for the selected portions of the mouse brain, the dynamic SVD eigenvalues shows that there is a rapid dominant growth of brain tumor after 26 weeks as shown by the white color of the dynamic indicator with a rate of growth of 100%. Such a methodology shows its success to evaluate the cancer/drug development using the mouse/rat model. 6. ADVANTAGES AND DISADVANTAGES OF THE PROPOSED METHODOLOGY There has been a large amount of mathematical models proposed to describe the growth dynamics of glial tu- mors. PDE Modeling of tumor growth dynamics in lit- erature gives us an insight on the physiology of the proc- ess by linking different parameters. Identification of these models parameters for each patient must be investigated using images taken at two different times corresponds to the identification process. [11-13] Clinical values of the estimated diffusion coefficients should be assessed using a huge database in order to accurately and identify the dynamic parameters. Experimental and analytical results for a time series of MR images to picture the 3D invasion of GBM in the brain using PDE presented in [1,9]. Since tumors can exhibit different rates of growth, it is then possible to find the best model parameters that best match the pre- dicted with the observed invasion to characterize the local or global tumor aggressiveness. Aggressiveness can be considered as one of the hidden parameters of the model and could be estimated by solving the inverse problem: given a time series of images, the hidden pa- rameters can be estimated with respect to the patient data. Although medical imaging is not the sole source of information used for this, it plays an important role in understanding the pattern and speed of invasion of healthy tissue by cancerous cells. In vivo SVD dynamic imaging offers increased throughput, allowing in vivo testing on a larger number of drugs than with conven- tional technologies. Moreover, real-time in vivo imaging offers a more predictive model, since more and higher quality data can be collected earlier in the development Figure 11. Mouse tumor brain model. process for those drug candidates that are evaluated in vivo. This real-time in vivo imaging utilizes the white- grey matter expressed in a living organism, and then analyzes the image eigenvalues non-invasively. By meas- uring and analyzing the eigenvalues variability, re- searchers can monitor cellular growth and use the results to track the spread of disease, or the effects of a new drug candidate in vivo. The drawback is that diffusion images are not avail-  M. Shibli / J. Biomedical Science and Engineering 4 (2011) 187-195 Copyright © 2011 SciRes. JBiSE 195 able for every patient and existence of the tumor and the low quality of patient images make it hard to obtain an accurate white matter segmentation. Additionally, high resolution MR equipments are required. 7. CONCLUSIONS This paper presents a novel method to quantify the growth of tumor invasion in white and grey matter for gliomas of MR images using SVD. This methodology is found to be fruitful to detect tumor cancer and follow-up patient and gives quantitative values about its growth. Quantification process is formulated based on the image SVD eigenvalues. Since SVD is interpreted by en ellip- soid, then the higher the eigenvalues the more of tumor growth would be. Two pairs of brain images of two pa- tients have been examined. The brain of each patient has been imaged twice at different times. By then, SVD of each image has been processed. It is found that each image is characterized by unique diagonal egienvalues matrix. The tumor cancer growth is identified by these egienvalues. Considering the differ- ence of the two corresponding matrices egienvalues will identify the growth rate. Based on this analysis an effi- cient white-black indicator is constructed. Black indica- tor means that there is no cancer growth. On the contrary, white indicator shows a growth in the tumor abnormal cells. Simulation results verify the SVD image process- ing approach. The advantage of such an approach is that for each patient, a dynamic indicator can constructed to evaluate his tumor growth at any time compared to a former one and follow-up his/her treatment. This approach is advantageous compared to PDE models, since clinical values of the estimated diffusion coefficients should be assessed using a large database in order to accurately and identify the dynamics parameters. On the contrast, real-time SVD in vivo imaging offers a more predictive model, since more and higher quality data can be collected earlier in the development process for those drug candidates that are evaluated in vivo. By measuring and analyzing the eigenvalues variability, researchers can monitor cellular growth and use the re- sults to track the spread of disease, or the effects of a new drug candidate non-invasively. REFERENCES [1] Konukoglu, E., Clatz, O., Bondiau, P.Y., Sermesant, M., Delingette, H. and Ayache, N. (2007) Towards an identi- fication of tumor growth parameters from time series of images. Medical Image Computing and Computer-Assisted Intervention—MICCAI 2007 Lecture Notes in Computer Science, 4791, 549-556. doi:10.1007/978-3-540-75757-3_67 [2] Nugroho, H.A., Ihtatho, D. and Nugroho, H. (2008) Con- trast enhancement for liver tumor identification. The MIDAS Journal—Grand Challenge Liver Tumor Seg- mentation (MICCAI Workshop), Private Issue, Kitware Inc., USA. [3] Ishizawa, T., Fukushima, N., Shibahara, J., Masuda, K., Tamura, S., Aoki, T., Hasegawa, K., Beck, Y., Fukayama, M. and Kokudo, N. (2009) Real-time identification of liver cancers by using indocyanine green fluorescent im- aging. Cancer, 115, 2491-2504. doi:10.1002/cncr.24291 [4] Chin, K.M., Wessler, B., Chew, P. and Lau, J. (2006) Genetic tests for cancer. Agency for Healthcare Research and Quality (AHRQ). Technology Assessment. http://www.ahrq.gov/clinic/ta/gentests/gentests.pdf [5] Villers, A., Puech, P., Leroy, X., Biserte, J., Fantoni, J.C. and Lemaitre, L. (2007) Dynamic contrast-enhanced MRI for preoperative identification of localised prostate can- cer. European Urology Supplements, 6, 525-532. doi:10.1016/j.eursup.2007.01.024 [6] Klema, V.C. and Laub, A.J. (1980) The singular value decomposition: its computation and some applications,” IEEE Transactions on Automatic Control, 25, 164-176. doi:10.1109/TAC.1980.1102314 [7] Ashino, R., Morimoto, A., Nagase, M. and Vaillancourt, R. (2003) Comparing multiresolution SVD with other methods for image compression. Proceedings of the 4th International ISAAC Congress, York University, Toronto, 11-16 August 2003, 457-470. [8] Joro, R., Lääperi, A.L., Soimakallio, S., Järvenpää, R., Kuukasjärvi, T., Toivonen, T., Saaristo, R. and Dastidar, P. (2008) Dynamic infrared imaging in identification of breast cancer tissue with combined image processing and frequency analysis. Journal of Medical Engineering & Technology, 32, 325-335. doi:10.1080/03091900701541240 [9] Clatz, O., Sermesant, M., Bondiau, P., Delingette, H., Warfield, S., Malandain, G. and Ayache, N. (2005) Re- alistic simulation of the 3D growth of brain tumors in MR images coupling diffusion with biomechanical de- formation. IEEE Transactions on Medical Imaging, 24, 1334-1346. doi:10.1109/TMI.2005.857217 [10] Konukoglu, E., Sermesant, M., Clatz, O., Peyrat, J.M., Delingette, H. and Ayache, N. (2007) A recursive ani- sotropic fast marching approach to reaction diffusion equation: Application to tumor growth modeling. Infor- mation Processing in Medical Imaging, 20, 687-699. doi:10.1007/978-3-540-73273-0_57 [11] Kirschner, D. (2009) On the global dynamics of a model for tumor immunotherapy. Mathematical Biosciences and Engineering, 6, 573-583. doi:10.3934/mbe.2009.6.573 [12] Ledzewicz, U. (2005) Optimal control for a system mo- delling tumor anti-angiogenesis. ACSE 05 Conference, CICC, Cairo, 19-21 December 2005, 147-152. [13] Ghaffari, A. and Nasserifar, N. (2009) Mathematical modeling and lyapunov-based drug administration in cancer chemotherapy. Journal of Electrical & Electronic Engineering, 5, 151-158. |