Paper Menu >>
Journal Menu >>
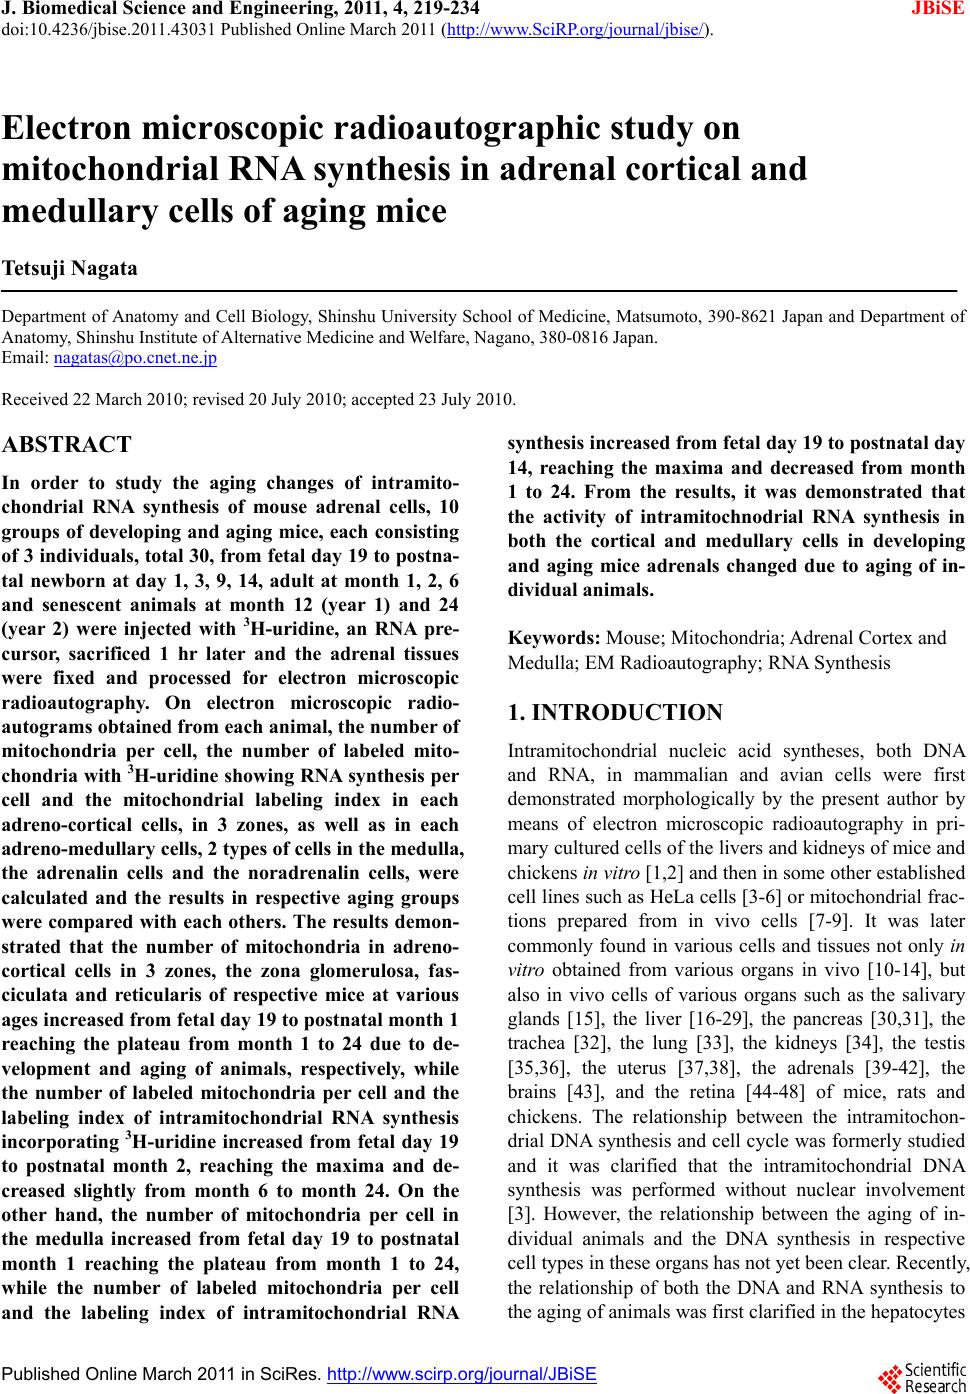 J. Biomedical Science and Engineering, 2011, 4, 219-234 JBiSE doi:10.4236/jbise.2011.43031 Published Online March 2011 (http://www.SciRP.org/journal/jbise/). Published Online March 2011 in SciRes. http://www.scirp.org/journal/JBiSE Electron microscopic radioautographic study on mitochondrial RNA synthesis in adrenal cortical and medullary cells of aging mice Tetsuji Nagata Department of Anatomy and Cell Biology, Shinshu University School of Medicine, Matsumoto, 390-8621 Japan and Department of Anatomy, Shinshu Institute of Alternative Medicine and Welfare, Nagano, 380-0816 Japan. Email: nagatas@po.cnet.ne.jp Received 22 March 2010; revised 20 July 2010; accepted 23 July 2010. ABSTRACT In order to study the aging changes of intramito- chondrial RNA synthesis of mouse adrenal cells, 10 groups of developing and aging mice, each consisting of 3 individuals, total 30, from fetal day 19 to postna- tal newborn at day 1, 3, 9, 14, adult at month 1, 2, 6 and senescent animals at month 12 (year 1) and 24 (year 2) were injected with 3H-uridine, an RNA pre- cursor, sacrificed 1 hr later and the adrenal tissues were fixed and processed for electron microscopic radioautography. On electron microscopic radio- autograms obtained from each animal, the number of mitochondria per cell, the number of labeled mito- chondria with 3H-uridine showing RNA synthesis per cell and the mitochondrial labeling index in each adreno-cortical cells, in 3 zones, as well as in each adreno-medullary cells, 2 types of cells in the medulla, the adrenalin cells and the noradrenalin cells, were calculated and the results in respective aging groups were compared with each others. The results demon- strated that the number of mitochondria in adreno- cortical cells in 3 zones, the zona glomerulosa, fas- ciculata and reticularis of respective mice at various ages increased from fetal day 19 to postnatal month 1 reaching the plateau from month 1 to 24 due to de- velopment and aging of animals, respectively, while the number of labeled mitochondria per cell and the labeling index of intramitochondrial RNA synthesis incorporating 3H-uridine increased from fetal day 19 to postnatal month 2, reaching the maxima and de- creased slightly from month 6 to month 24. On the other hand, the number of mitochondria per cell in the medulla increased from fetal day 19 to postnatal month 1 reaching the plateau from month 1 to 24, while the number of labeled mitochondria per cell and the labeling index of intramitochondrial RNA synthesis increased from fetal day 19 to postnatal day 14, reaching the maxima and decreased from month 1 to 24. From the results, it was demonstrated that the activity of intramitochnodrial RNA synthesis in both the cortical and medullary cells in developing and aging mice adrenals changed due to aging of in- dividual animals. Keywords: Mouse; Mitochondria; Adrena l Cortex and Medulla; EM Radioautography; RNA Synthesis 1. INTRODUCTION Intramitochondrial nucleic acid syntheses, both DNA and RNA, in mammalian and avian cells were first demonstrated morphologically by the present author by means of electron microscopic radioautography in pri- mary cultured cells of the livers and kidn eys of mice and chickens in vitro [1,2] and then in some other established cell lines such as HeLa cells [3-6] or mitochondrial frac- tions prepared from in vivo cells [7-9]. It was later commonly found in various cells and tissues not only in vitro obtained from various organs in vivo [10-14], but also in vivo cells of various organs such as the salivary glands [15], the liver [16-29], the pancreas [30,31], the trachea [32], the lung [33], the kidneys [34], the testis [35,36], the uterus [37,38], the adrenals [39-42], the brains [43], and the retina [44-48] of mice, rats and chickens. The relationship between the intramitochon- drial DNA synthesis and cell cycle was formerly studied and it was clarified that the intramitochondrial DNA synthesis was performed without nuclear involvement [3]. However, the relationship between the aging of in- dividual animals and the DNA synthesis in respective cell types in these organs has not yet been clear. Recently, the relationship of both the DNA and RNA synthesis to the aging of animals was first clarified in the hepatocytes 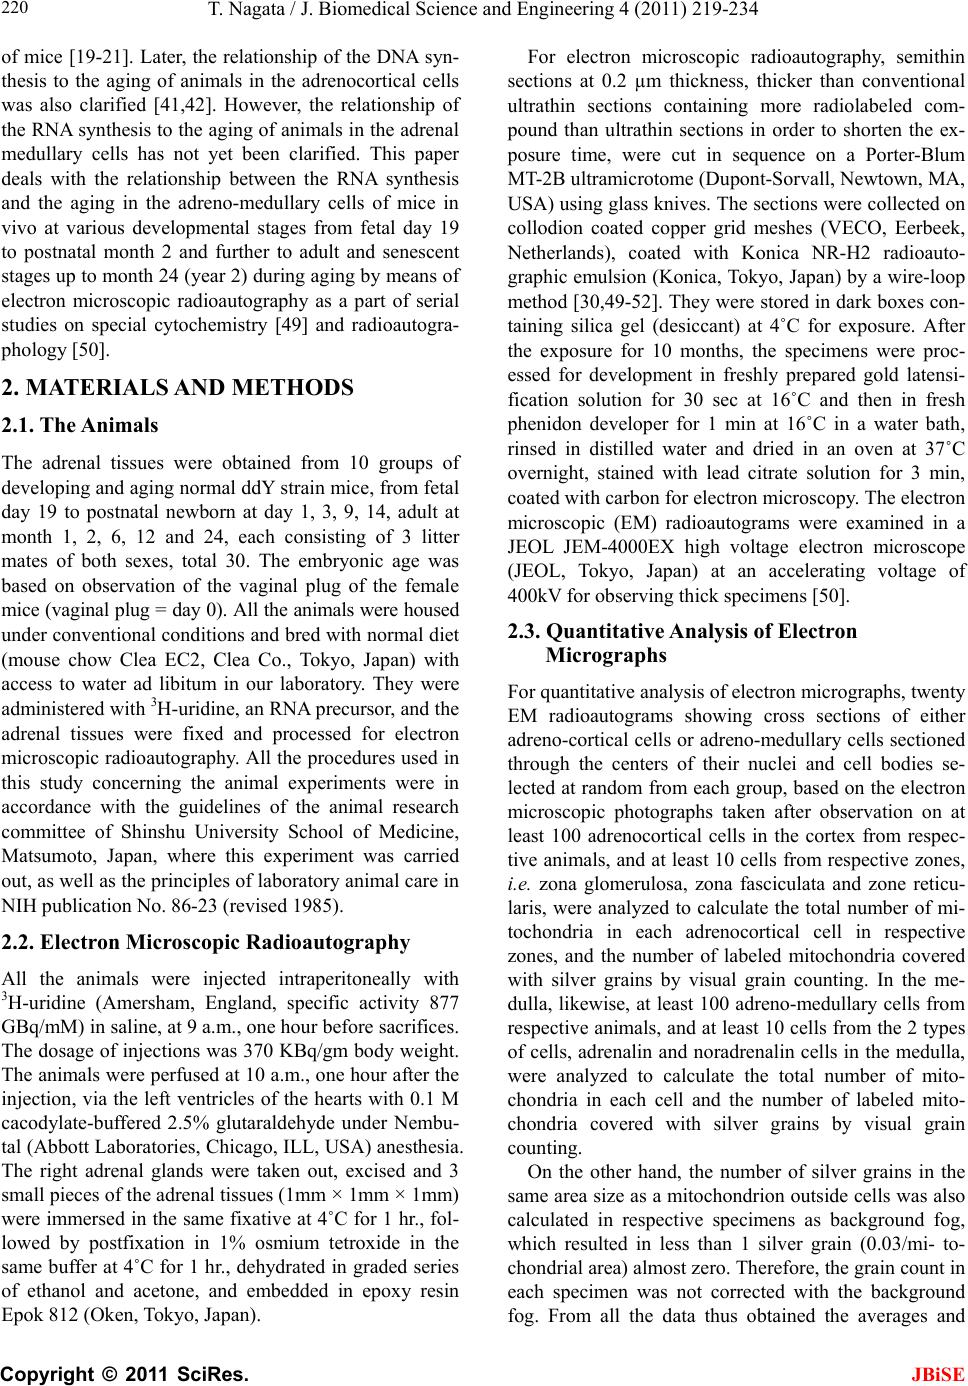 T. Nagata / J. Biomedical Science an d Engineering 4 (2011) 219-234 Copyright © 2011 SciRes. JBiSE 220 of mice [19-21]. Later, the relationship of the DNA syn- thesis to the aging of animals in the adrenocortical cells was also clarified [41,42]. However, the relationship of the RNA synthesis to the aging of animals in the adrenal medullary cells has not yet been clarified. This paper deals with the relationship between the RNA synthesis and the aging in the adreno-medullary cells of mice in vivo at various developmental stages from fetal day 19 to postnatal month 2 and further to adult and senescent stages up to month 24 (year 2) during aging by means of electron microscopic radioautography as a part of serial studies on special cytochemistry [49] and radioautogra- phology [5 0]. 2. MATERIALS AND METHODS 2.1. The Animals The adrenal tissues were obtained from 10 groups of developing and aging normal ddY strain mice, from fetal day 19 to postnatal newborn at day 1, 3, 9, 14, adult at month 1, 2, 6, 12 and 24, each consisting of 3 litter mates of both sexes, total 30. The embryonic age was based on observation of the vaginal plug of the female mice (vaginal plug = day 0). All the animals were housed under convention al conditions and bred with normal diet (mouse chow Clea EC2, Clea Co., Tokyo, Japan) with access to water ad libitum in our laboratory. They were administered with 3H-uridine, an RNA precursor, and the adrenal tissues were fixed and processed for electron microscopic radioautography. All the procedures used in this study concerning the animal experiments were in accordance with the guidelines of the animal research committee of Shinshu University School of Medicine, Matsumoto, Japan, where this experiment was carried out, as well as the principles of laboratory animal care in NIH publication No. 86-23 (revised 1985). 2.2. Electron Microscopic Radioautography All the animals were injected intraperitoneally with 3H-uridine (Amersham, England, specific activity 877 GBq/mM) in saline, at 9 a.m., one hour before sacrifices. The dosage of injections was 370 KBq/gm body weight. The animals were perfused at 10 a.m., one hour after the injection, via the left ventricles of the hearts with 0.1 M cacodylate-buffered 2.5% glutaraldehyde under Nembu- tal (Abbott Laboratories, Chicago, ILL, USA) anesthesia. The right adrenal glands were taken out, excised and 3 small pieces of the adrenal tissues (1mm × 1mm × 1mm) were immersed in the same fixative at 4˚C for 1 hr., fol- lowed by postfixation in 1% osmium tetroxide in the same buffer at 4˚C for 1 hr., dehydrated in graded series of ethanol and acetone, and embedded in epoxy resin Epok 812 (Oken, Tokyo, Japan). For electron microscopic radioautography, semithin sections at 0.2 µm thickness, thicker than conventional ultrathin sections containing more radiolabeled com- pound than ultrathin sections in order to shorten the ex- posure time, were cut in sequence on a Porter-Blum MT-2B ultramicrotome (Dupont-Sorvall, Newtown, MA, USA) using glass knives. The sections were collected on collodion coated copper grid meshes (VECO, Eerbeek, Netherlands), coated with Konica NR-H2 radioauto- graphic emulsion (Konica, Tokyo, Japan) by a wire-loop method [30,49-52]. They were stored in dark boxes con- taining silica gel (desiccant) at 4˚C for exposure. After the exposure for 10 months, the specimens were proc- essed for development in freshly prepared gold latensi- fication solution for 30 sec at 16˚C and then in fresh phenidon developer for 1 min at 16˚C in a water bath, rinsed in distilled water and dried in an oven at 37˚C overnight, stained with lead citrate solution for 3 min, coated with carbon for electron microscopy. The electron microscopic (EM) radioautograms were examined in a JEOL JEM-4000EX high voltage electron microscope (JEOL, Tokyo, Japan) at an accelerating voltage of 400kV for observing thick specimens [50]. 2.3. Quantitative Analysis of Electron Micrographs For quantitative analysis of electron micrographs, twenty EM radioautograms showing cross sections of either adreno-cortical cells or adreno-medullary cells sectioned through the centers of their nuclei and cell bodies se- lected at random from each group, based on the electron microscopic photographs taken after observation on at least 100 adrenocortical cells in the cortex from respec- tive animals, and at least 10 cells from respective zones, i.e. zona glomerulosa, zona fasciculata and zone reticu- laris, were analyzed to calculate the total number of mi- tochondria in each adrenocortical cell in respective zones, and the number of labeled mitochondria covered with silver grains by visual grain counting. In the me- dulla, likewise, at least 100 adreno-medullary cells fro m respective animals, and at least 10 cells from the 2 types of cells, adrenalin and noradrenalin cells in the medulla, were analyzed to calculate the total number of mito- chondria in each cell and the number of labeled mito- chondria covered with silver grains by visual grain counting. On the other hand, the number of silver grains in the same area size as a mitochondrion outside cells was also calculated in respective specimens as background fog, which resulted in less than 1 silver grain (0.03/mi- to- chondrial area) almost zero. Therefore, the grain count in each specimen was not corrected with the background fog. From all the data thus obtained the averages and 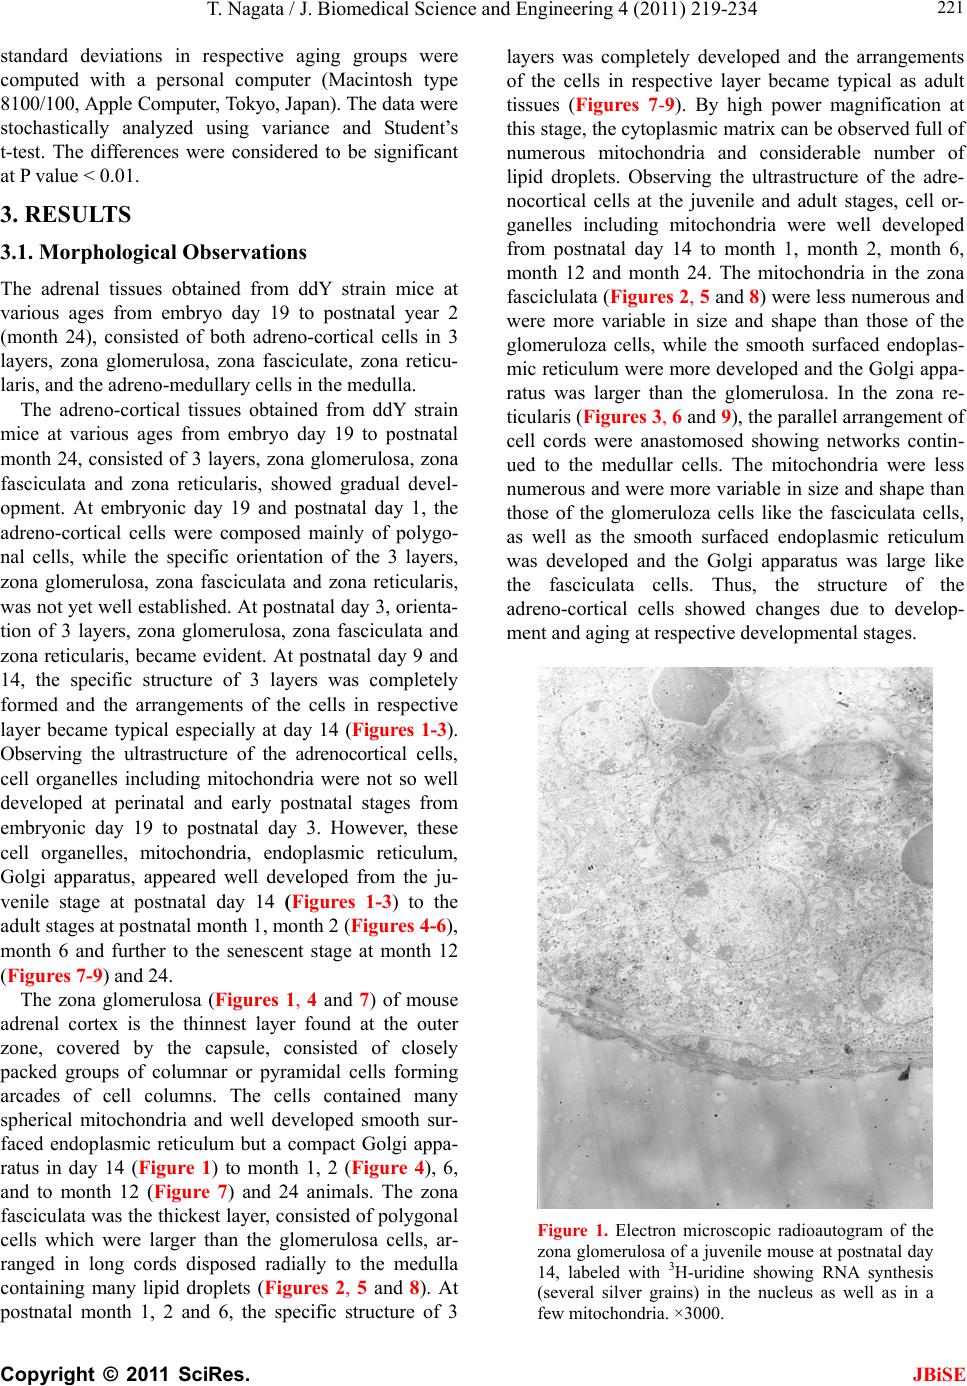 T. Nagata / J. Biomedical Science and Engineering 4 (2011) 219-234 Copyright © 2011 SciRes. JBiSE 221 standard deviations in respective aging groups were computed with a personal computer (Macintosh type 8100/100, Apple Computer, Tokyo, Japan). The data were stochastically analyzed using variance and Student’s t-test. The differences were considered to be significant at P value < 0.01. 3. RESULTS 3.1. Morphological Observations The adrenal tissues obtained from ddY strain mice at various ages from embryo day 19 to postnatal year 2 (month 24), consisted of both adreno-cortical cells in 3 layers, zona glomerulosa, zona fasciculate, zona reticu- laris, and the adreno-medullary cells in the medulla. The adreno-cortical tissues obtained from ddY strain mice at various ages from embryo day 19 to postnatal month 24, consisted of 3 layers, zona glomerulosa, zona fasciculata and zona reticularis, showed gradual devel- opment. At embryonic day 19 and postnatal day 1, the adreno-cortical cells were composed mainly of polygo- nal cells, while the specific orientation of the 3 layers, zona glomerulosa, zona fasciculata and zona reticularis, was not yet well established. At postnatal day 3, orienta- tion of 3 layers, zona glomerulosa, zona fasciculata and zona reticularis, became evident. At postnatal day 9 and 14, the specific structure of 3 layers was completely formed and the arrangements of the cells in respective layer became typical especially at day 14 (Figures 1-3). Observing the ultrastructure of the adrenocortical cells, cell organelles including mitochondria were not so well developed at perinatal and early postnatal stages from embryonic day 19 to postnatal day 3. However, these cell organelles, mitochondria, endoplasmic reticulum, Golgi apparatus, appeared well developed from the ju- venile stage at postnatal day 14 (Figures 1-3) to the adult stages at postnatal month 1, month 2 (Figures 4-6), month 6 and further to the senescent stage at month 12 (Figures 7-9) and 24. The zona glomerulosa (Figures 1, 4 and 7) of mouse adrenal cortex is the thinnest layer found at the outer zone, covered by the capsule, consisted of closely packed groups of columnar or pyramidal cells forming arcades of cell columns. The cells contained many spherical mitochondria and well developed smooth sur- faced endoplasmic reticulum but a compact Golgi appa- ratus in day 14 (Figure 1) to month 1, 2 (Figure 4), 6, and to month 12 (Figure 7) and 24 animals. The zona fasciculata was the thickest layer, consisted of polygonal cells which were larger than the glomerulosa cells, ar- ranged in long cords disposed radially to the medulla containing many lipid droplets (Figures 2, 5 and 8). At postnatal month 1, 2 and 6, the specific structure of 3 layers was completely developed and the arrangements of the cells in respective layer became typical as adult tissues (Figures 7-9). By high power magnification at this stage, the cytoplasmic matrix can be observed full of numerous mitochondria and considerable number of lipid droplets. Observing the ultrastructure of the adre- nocortical cells at the juvenile and adult stages, cell or- ganelles including mitochondria were well developed from postnatal day 14 to month 1, month 2, month 6, month 12 and month 24. The mitochondria in the zona fasciclulata (Figures 2, 5 and 8) were less numerous and were more variable in size and shape than those of the glomeruloza cells, while the smooth surfaced endoplas- mic reticulum were more developed and the Golgi appa- ratus was larger than the glomerulosa. In the zona re- ticularis (Figures 3, 6 and 9), the parallel arrangement of cell cords were anastomosed showing networks contin- ued to the medullar cells. The mitochondria were less numerous and were more variable in size and shape than those of the glomeruloza cells like the fasciculata cells, as well as the smooth surfaced endoplasmic reticulum was developed and the Golgi apparatus was large like the fasciculata cells. Thus, the structure of the adreno-cortical cells showed changes due to develop- ment and aging at respective developmental stages. Figure 1. Electron microscopic radioautogram of the zona glomerulosa of a juvenile mouse at postnatal day 14, labeled with 3H-uridine showing RNA synthesis (several silver grains) in the nucleus as well as in a few mitochondria. ×3000. 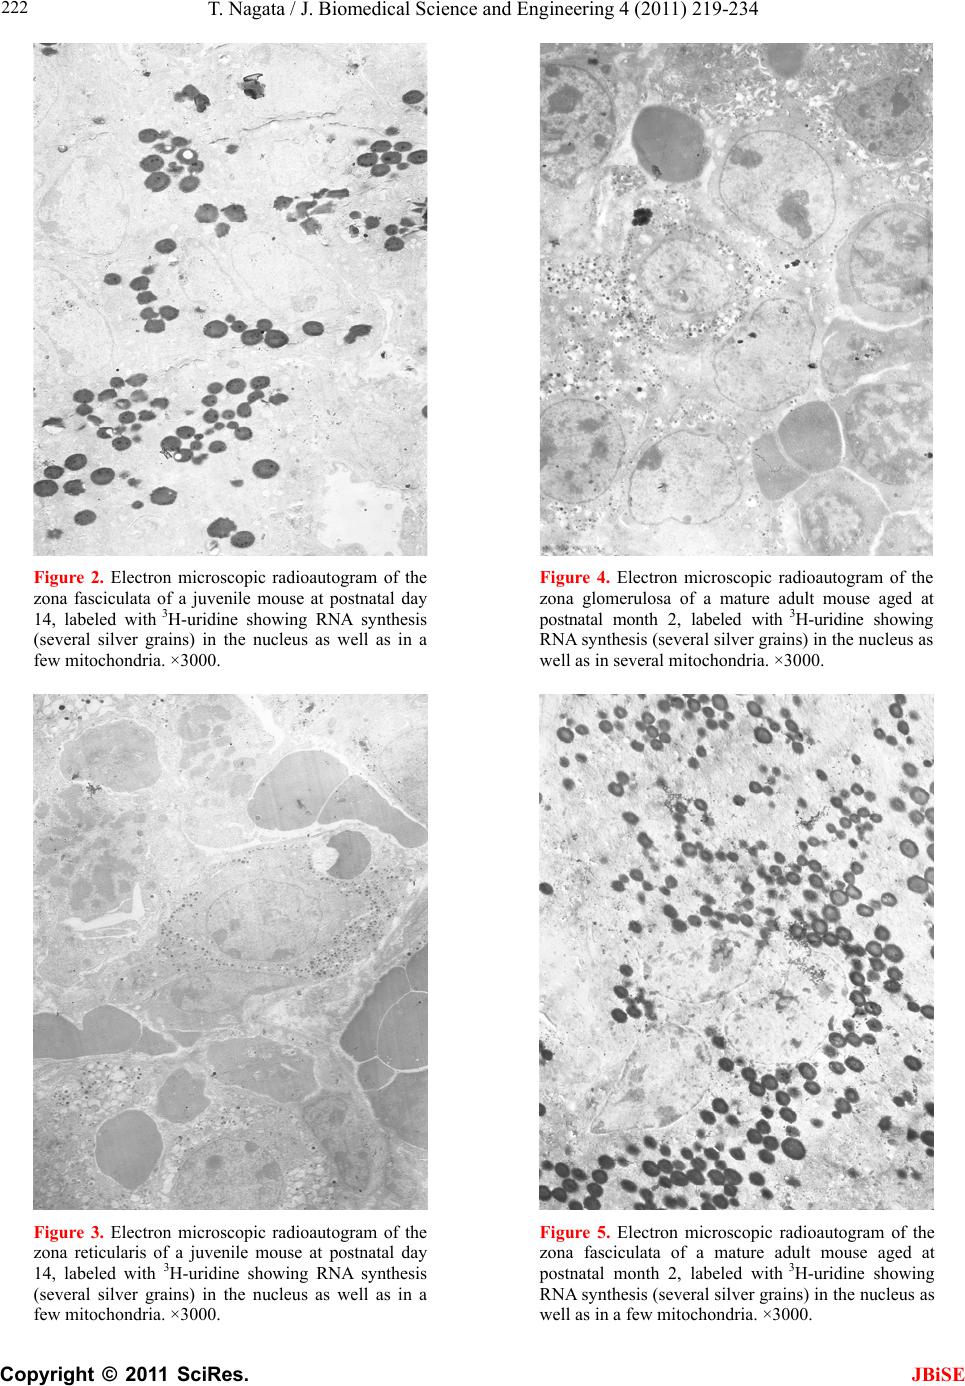 T. Nagata / J. Biomedical Science an d Engineering 4 (2011) 219-234 Copyright © 2011 SciRes. JBiSE 222 Figure 2. Electron microscopic radioautogram of the zona fasciculata of a juvenile mouse at postnatal day 14, labeled with 3 H-uridine showing RNA synthesis (several silver grains) in the nucleus as well as in a few mitochondria. ×3000. Figure 3. Electron microscopic radioautogram of the zona reticularis of a juvenile mouse at postnatal day 14, labeled with 3H-uridine showing RNA synthesis (several silver grains) in the nucleus as well as in a few mitochondria. ×3000. Figure 4. Electron microscopic radioautogram of the zona glomerulosa of a mature adult mouse aged at postnatal month 2, labeled with 3 H-uridine showing RNA synthesis (several silver grains) in the nucleus as well as in several mitochondria. ×3000. Figure 5. Electron microscopic radioautogram of the zona fasciculata of a mature adult mouse aged at postnatal month 2, labeled with 3 H-uridine showing RNA synthesis (several silver grains) in the nucleus as well as in a few mitochondria. ×3000. 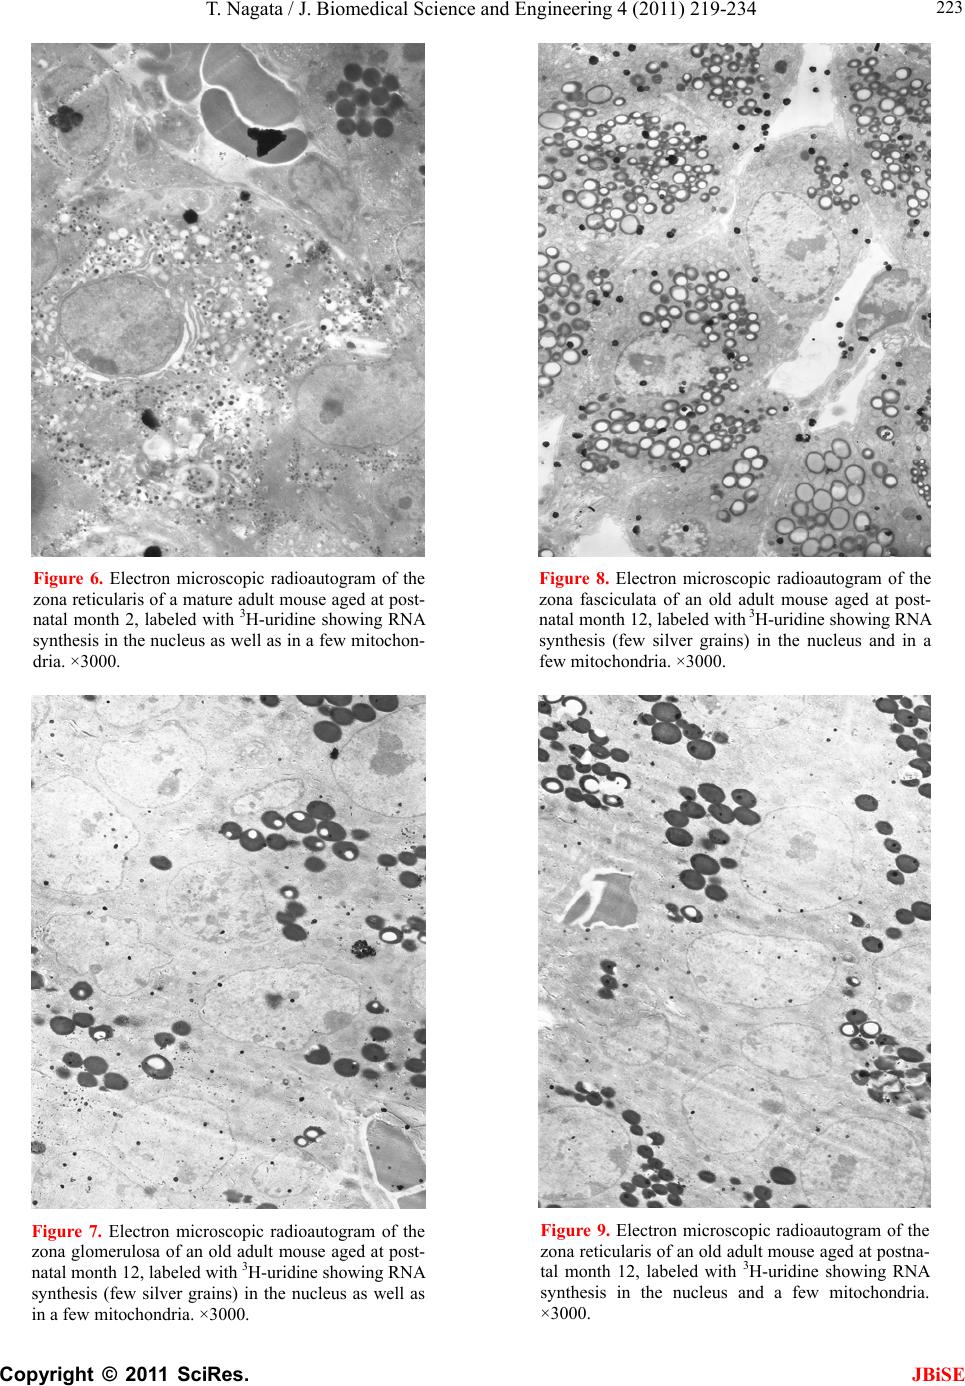 T. Nagata / J. Biomedical Science and Engineering 4 (2011) 219-234 Copyright © 2011 SciRes. JBiSE 223 Figure 6. Electron microscopic radioautogram of the zona reticularis of a mature adult mouse aged at post- natal month 2, labeled with 3H-uridine showing RNA synthesis in the nucleus as well as in a few mitochon- dria. ×3000. Figure 7. Electron microscopic radioautogram of the zona glomerulosa of an old adult mouse aged at post- natal month 12, labeled with 3H-uridine showing RNA synthesis (few silver grains) in the nucleus as well as in a few mitochondria. ×3000. Figure 8. Electron microscopic radioautogram of the zona fasciculata of an old adult mouse aged at post- natal month 12, labeled with 3H-uridine showing RNA synthesis (few silver grains) in the nucleus and in a few mitochondria. ×3000. Figure 9. Electron microscopic radioautogram of the zona reticularis of an old adult mouse aged at postna- tal month 12, labeled with 3H-uridine showing RNA synthesis in the nucleus and a few mitochondria. ×3000. 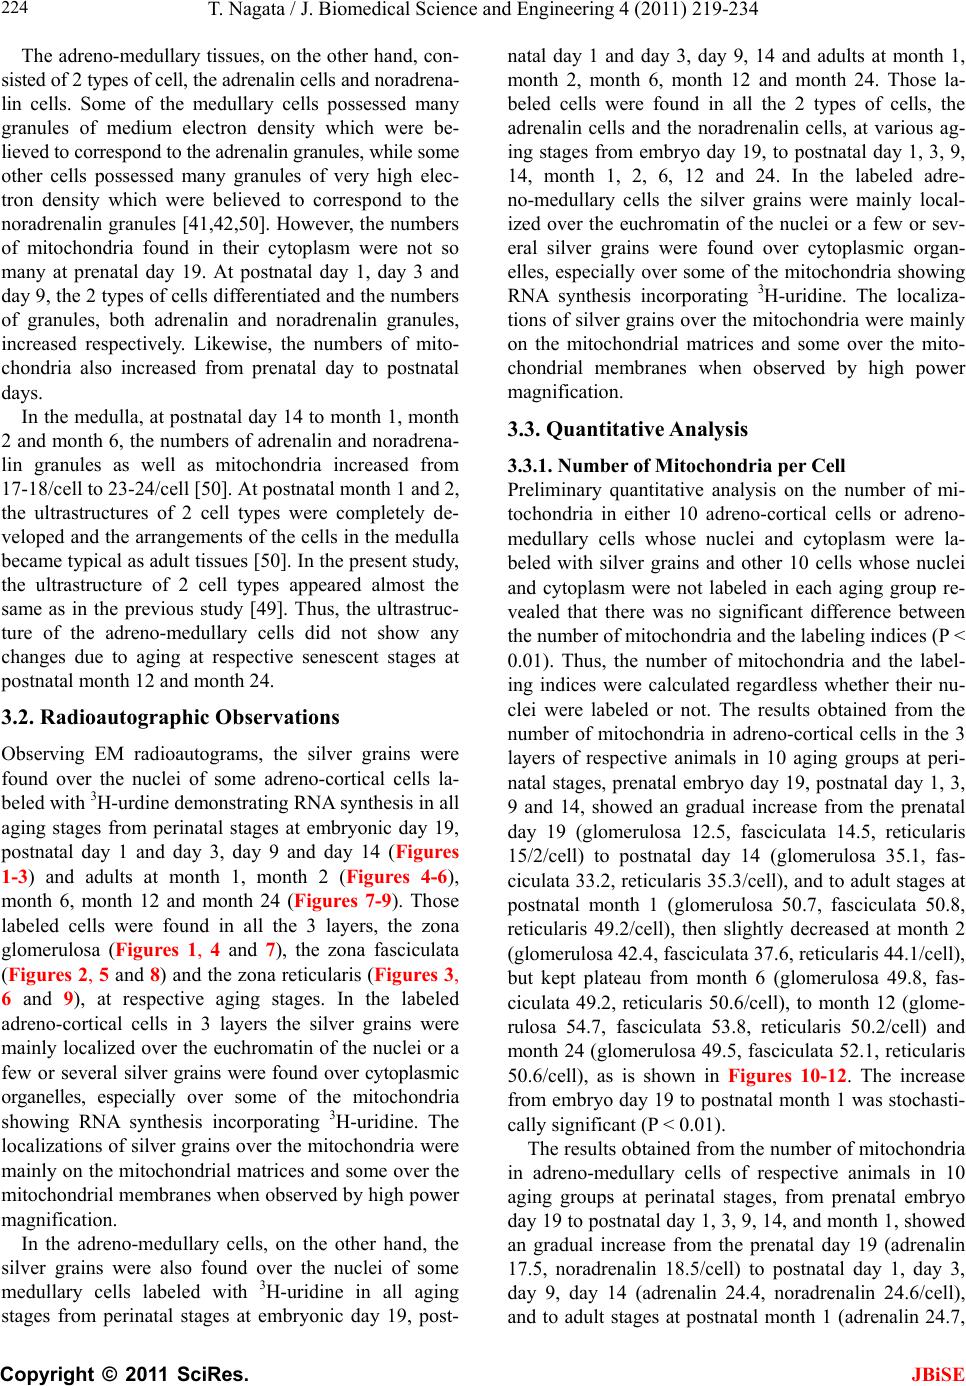 T. Nagata / J. Biomedical Science an d Engineering 4 (2011) 219-234 Copyright © 2011 SciRes. JBiSE 224 The adreno-medullary tissues, on the other hand, con- sisted of 2 types of cell, the adrenalin cells and noradrena- lin cells. Some of the medullary cells possessed many granules of medium electron density which were be- lieved to correspond to the adrenalin granules, while some other cells possessed many granules of very high elec- tron density which were believed to correspond to the noradrenalin granules [41,42,50]. However, the numbers of mitochondria found in their cytoplasm were not so many at prenatal day 19. At postnatal day 1, day 3 and day 9, the 2 types of cells differentiated and the nu mbers of granules, both adrenalin and noradrenalin granules, increased respectively. Likewise, the numbers of mito- chondria also increased from prenatal day to postnatal days. In the medulla, at postnatal day 14 to month 1, month 2 and month 6, the numbers of adrenalin and noradrena- lin granules as well as mitochondria increased from 17-18/cell to 23-24/cell [50]. At postnatal month 1 and 2, the ultrastructures of 2 cell types were completely de- veloped and the arrangements of the cells in the medulla became typical as adult tissues [50]. In the present study, the ultrastructure of 2 cell types appeared almost the same as in the previous study [49]. Thus, the ultrastruc- ture of the adreno-medullary cells did not show any changes due to aging at respective senescent stages at postnatal month 12 and month 24. 3.2. Radioautographic Observations Observing EM radioautograms, the silver grains were found over the nuclei of some adreno-cortical cells la- beled with 3H-urdine demonstrating RNA synthesis in all aging stages from perinatal stages at embryonic day 19, postnatal day 1 and day 3, day 9 and day 14 (Figures 1-3) and adults at month 1, month 2 (Figures 4-6), month 6, month 12 and month 24 (Figures 7-9). Those labeled cells were found in all the 3 layers, the zona glomerulosa (Figures 1, 4 and 7), the zona fasciculata (Figures 2, 5 an d 8) and the zona reticularis (Figures 3, 6 and 9), at respective aging stages. In the labeled adreno-cortical cells in 3 layers the silver grains were mainly localized over the euchromatin of the nuclei or a few or several silver grains were found over cytoplasmic organelles, especially over some of the mitochondria showing RNA synthesis incorporating 3H-uridine. The localizations of silver grains over the mitochond ria were mainly on the mitoch ondrial matrices and some over the mitochondrial me mbranes when observ ed by high power magnification. In the adreno-medullary cells, on the other hand, the silver grains were also found over the nuclei of some medullary cells labeled with 3H-uridine in all aging stages from perinatal stages at embryonic day 19, post- natal day 1 and day 3, day 9, 14 and adults at month 1, month 2, month 6, month 12 and month 24. Those la- beled cells were found in all the 2 types of cells, the adrenalin cells and the noradrenalin cells, at various ag- ing stages from embryo day 19, to postnatal day 1, 3, 9, 14, month 1, 2, 6, 12 and 24. In the labeled adre- no-medullary cells the silver grains were mainly local- ized over the euchromatin of the nuclei or a few or sev- eral silver grains were found over cytoplasmic organ- elles, especially over some of the mitochondria showing RNA synthesis incorporating 3H-uridine. The localiza- tions of silver grains ov er the mitochondria were mainly on the mitochondrial matrices and some over the mito- chondrial membranes when observed by high power magnification. 3.3. Quantitative Analysis 3.3.1. Number of Mitochondria per Cell Preliminary quantitative analysis on the number of mi- tochondria in either 10 adreno-cortical cells or adreno- medullary cells whose nuclei and cytoplasm were la- beled with silver grains and other 10 cells whose nuclei and cytoplasm were not labeled in each aging group re- vealed that there was no significant difference between the number of mitochondria and the lab eling ind ices (P < 0.01). Thus, the number of mitochondria and the label- ing indices were calculated regardless whether their nu- clei were labeled or not. The results obtained from the number of mitochondria in adreno-cortical cells in the 3 layers of respective animals in 10 aging groups at peri- natal stages, prenatal embryo day 19, postnatal day 1, 3, 9 and 14, showed an gradual increase from the prenatal day 19 (glomerulosa 12.5, fasciculata 14.5, reticularis 15/2/cell) to postnatal day 14 (glomerulosa 35.1, fas- ciculata 33.2, reticularis 35.3/cell), and to adu lt stages at postnatal month 1 (glomerulosa 50.7, fasciculata 50.8, reticularis 49.2/cell), then slightly decreased at month 2 (glomerulosa 42.4, fasciculata 37.6, reticularis 44.1/cell), but kept plateau from month 6 (glomerulosa 49.8, fas- ciculata 49.2, reticularis 50.6/cell), to month 12 (glome- rulosa 54.7, fasciculata 53.8, reticularis 50.2/cell) and month 24 (glomerulosa 49.5, fasciculata 52.1, reticularis 50.6/cell), as is shown in Figures 10-12. The increase from embryo day 19 to postnatal month 1 was stochasti- cally significant (P < 0.01). The results ob tained from the n umber of mitochondr ia in adreno-medullary cells of respective animals in 10 aging groups at perinatal stages, from prenatal embryo day 19 to postnatal d ay 1, 3, 9, 14, and month 1, showed an gradual increase from the prenatal day 19 (adrenalin 17.5, noradrenalin 18.5/cell) to postnatal day 1, day 3, day 9, day 14 (adrenalin 24.4, noradrenalin 24.6/cell), and to adult stages at postnatal month 1 (adrenalin 24.7, 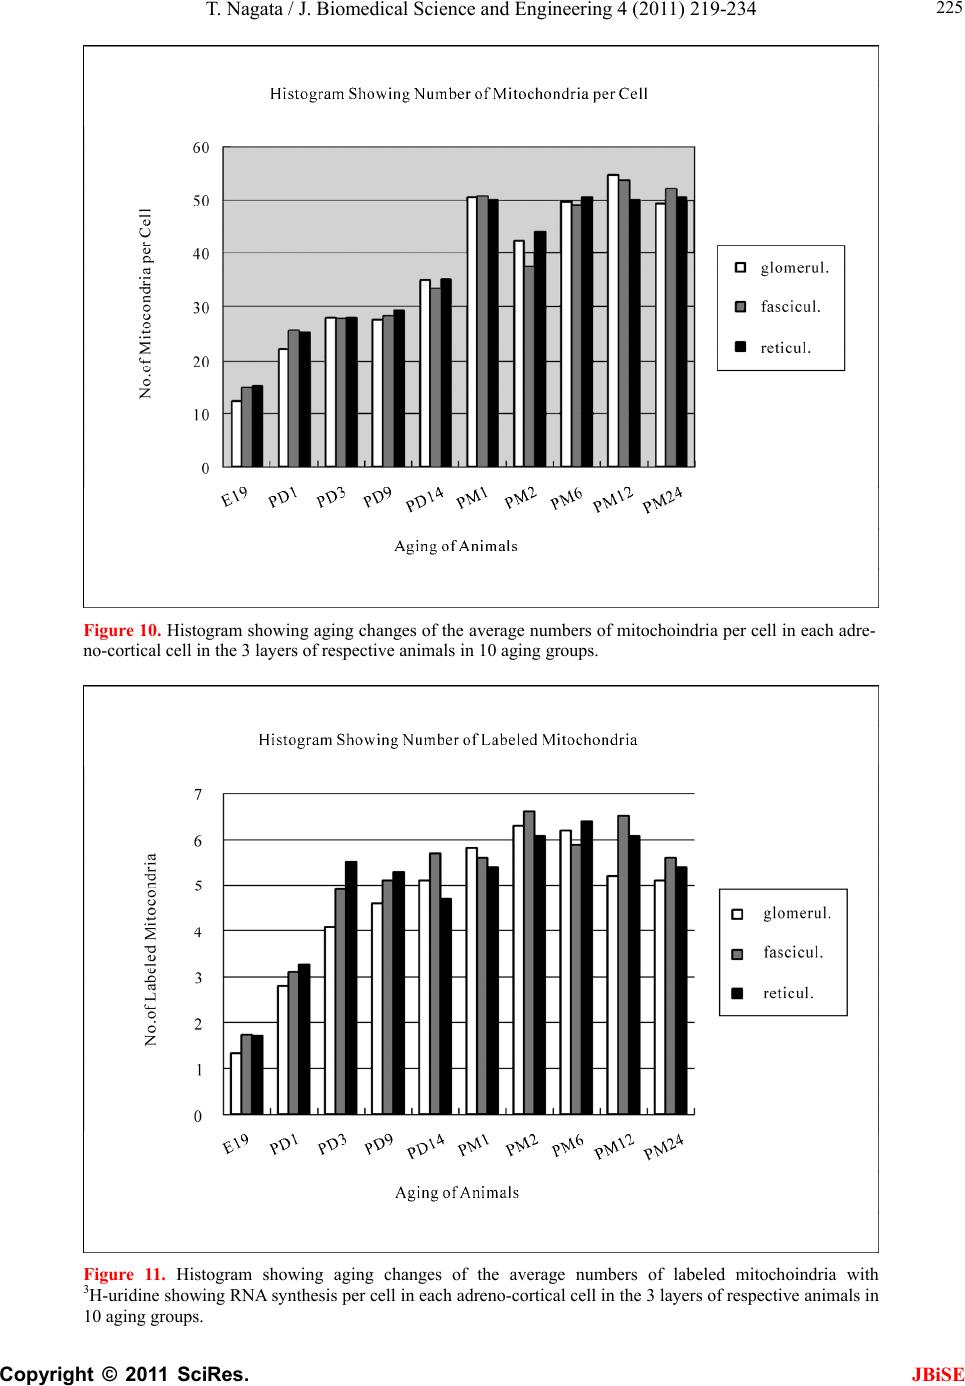 T. Nagata / J. Biomedical Science and Engineering 4 (2011) 219-234 Copyright © 2011 SciRes. JBiSE 225 Figure 10. Histogram showing aging changes of the average numbers of mitochoindria per cell in each adre- no-cortical cell in the 3 layers of respective animals in 10 aging groups. Figure 11. Histogram showing aging changes of the average numbers of labeled mitochoindria with 3H-uridine showing RNA synthesis per cell in each adreno-cortical cell in the 3 layers of respective animals in 10 aging groups. 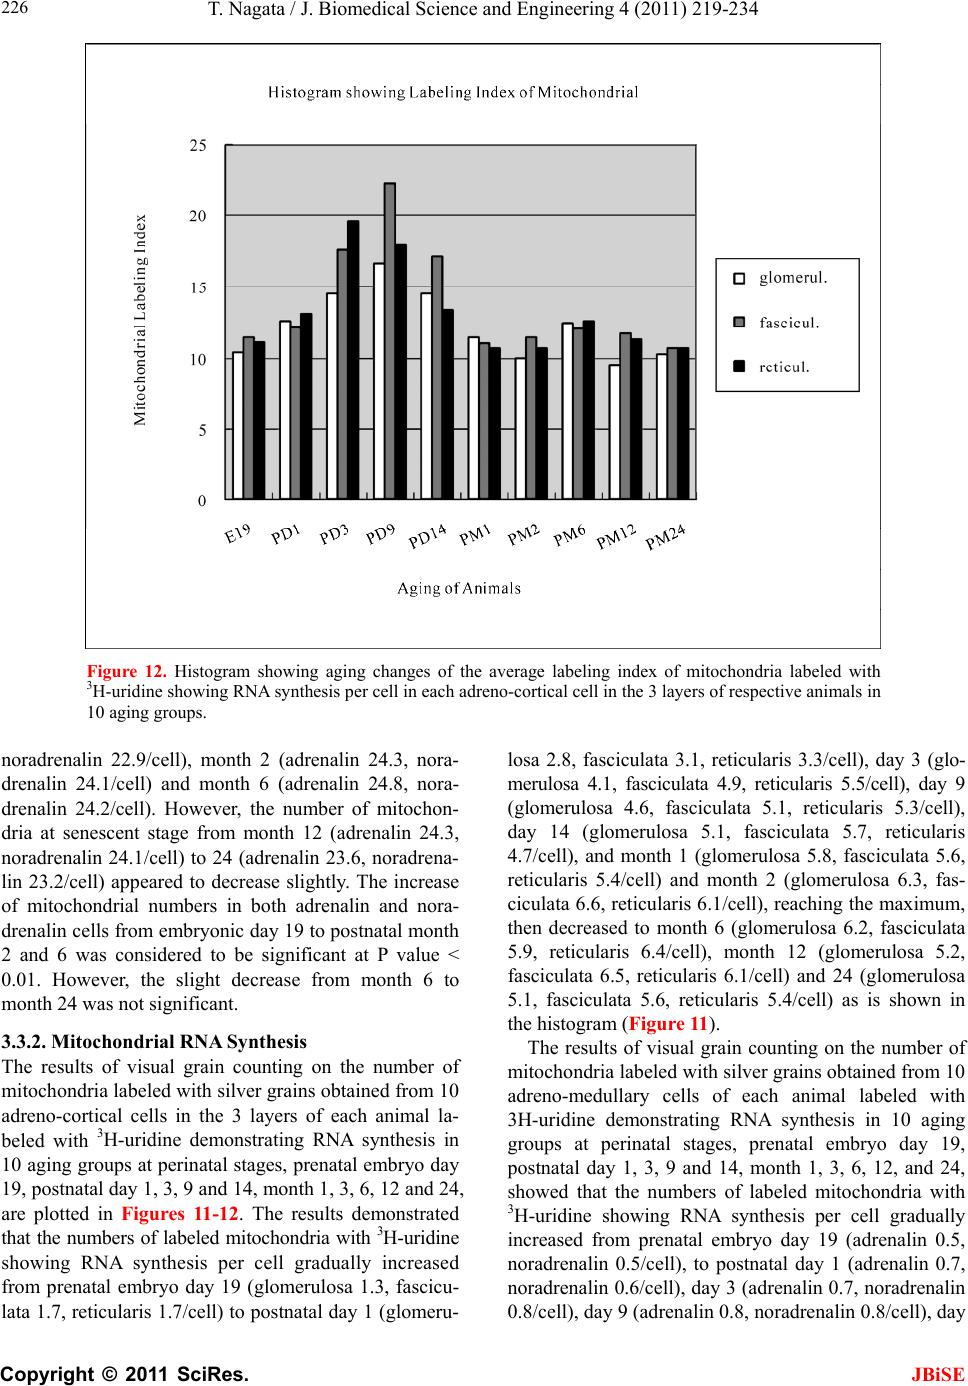 T. Nagata / J. Biomedical Science an d Engineering 4 (2011) 219-234 Copyright © 2011 SciRes. JBiSE 226 Figure 12. Histogram showing aging changes of the average labeling index of mitochondria labeled with 3H-uridine showing RNA synthesis per cell in each adreno-cortical cell in the 3 layers of respective animals in 10 aging groups. noradrenalin 22.9/cell), month 2 (adrenalin 24.3, nora- drenalin 24.1/cell) and month 6 (adrenalin 24.8, nora- drenalin 24.2/cell). However, the number of mitochon- dria at senescent stage from month 12 (adrenalin 24.3, noradrenalin 24.1/cell) to 24 (adrenalin 23.6, noradrena- lin 23.2/cell) appeared to decrease slightly. The increase of mitochondrial numbers in both adrenalin and nora- drenalin cells from embryonic day 19 to postnatal month 2 and 6 was considered to be significant at P value < 0.01. However, the slight decrease from month 6 to month 2 4 w as n ot significant. 3.3.2. Mitoch ondrial RN A Synthe sis The results of visual grain counting on the number of mitochondria labeled with silver grains obtain ed fro m 10 adreno-cortical cells in the 3 layers of each animal la- beled with 3H-uridine demonstrating RNA synthesis in 10 aging groups at perin atal stages, prenatal embryo day 19, postnatal day 1, 3, 9 and 14, month 1, 3, 6, 12 and 24, are plotted in Figures 11-12. The results demonstrated that the numbers of labeled mitochondria with 3H-uridine showing RNA synthesis per cell gradually increased from prenatal embryo day 19 (glomerulosa 1.3, fascicu- lata 1.7, reticularis 1.7/cell) to postnatal da y 1 (glomeru- losa 2.8, fasciculata 3.1, reticularis 3.3/cell), day 3 (glo- merulosa 4.1, fasciculata 4.9, reticularis 5.5/cell), day 9 (glomerulosa 4.6, fasciculata 5.1, reticularis 5.3/cell), day 14 (glomerulosa 5.1, fasciculata 5.7, reticularis 4.7/cell), and month 1 (glomerulosa 5.8, fasciculata 5.6, reticularis 5.4/cell) and month 2 (glomerulosa 6.3, fas- ciculata 6.6, reticularis 6.1/cell), reaching the maximum, then decreased to month 6 (glomerulosa 6.2, fasciculata 5.9, reticularis 6.4/cell), month 12 (glomerulosa 5.2, fasciculata 6.5, reticularis 6.1/cell) and 24 (glomerulosa 5.1, fasciculata 5.6, reticularis 5.4/cell) as is shown in the histogram (Figure 11). The results of visual grain counting on the number of mitochondria labeled with silver grains obtain ed fro m 10 adreno-medullary cells of each animal labeled with 3H-uridine demonstrating RNA synthesis in 10 aging groups at perinatal stages, prenatal embryo day 19, postnatal day 1, 3, 9 and 14, month 1, 3, 6, 12, and 24, showed that the numbers of labeled mitochondria with 3H-uridine showing RNA synthesis per cell gradually increased from prenatal embryo day 19 (adrenalin 0.5, noradrenalin 0.5/cell), to postnatal day 1 (adrenalin 0.7, noradrenalin 0.6/cell), day 3 (adrenalin 0.7, noradrenalin 0.8/cell), day 9 (adrenalin 0.8, noradrenalin 0.8/cell), day  T. Nagata / J. Biomedical Science and Engineering 4 (2011) 219-234 Copyright © 2011 SciRes. JBiSE 227 14 (adrenalin 0.8, noradrenalin 0.9/cell), reaching the maximum, and decreased to month 1 (adrenalin 0.5, no- radrenalin 0.5/cell), month 2 (adrenalin 0.45, noradrena- lin 0.4/cell), month 6 (adrenalin 0.41, noradrenalin 0.36/cell), and month 12 (adrenalin 0.4, noradrenalin 0.32/cell) and 24 (adrenalin 0.38, noradrenalin 0.35/cell). The data were stochastically analyzed using variance and Student’s t-test. The increases of the numbers of labeled mitochondria in both adrenalin and noradrenalin cells from embryo day 19 to postnatal day 14, as well as the decreases from day 14 to month 24 were stochasti- cally significant (P < 0.01). 3.3.3. The Labeling Index Finally, the labeling indices of adreno-cortical cells showing RNA synthesis in respective aging stages were calculated from the number of labeled mitochondria (Figure 11) dividing by the number of total mitochon- dria per cell (Figure 10), which were plotted in Figure 12, respe ctively. The results showed that the labeling indices gradually increased from prenatal day 19 (glomerulosa 10.4, fas- ciculata 11.4, reticularis 11.1%) to postnatal newborn stage at postnatal day 1 (glomerulosa 12.6, fasciculata 12.1, reticularis 13.1%) and day 3 (glomerulosa 14.5, fasciculata 17.6, reticularis 19.6%), and to juvenile stage at postnatal day 9 (glomerulosa 16.6, fasciculata 22.3, reticularis 18.0%), reaching the maximum, and de- creased to day 14 (glomerulosa 14.5, fasciculata 17.1, reticularis 13.4%) and to the adult stage at month 1 (glomerulosa 11.4, fasciculata 11.0, reticularis 10.7%) and month 2 (glomerulosa 10.0, fasciculata 11.4, reticu- laris 10.7%), to month 6 (glomerulosa 12.4, fasciculata 12.0, reticularis 12.6%) to month 12 (glomerulosa 9.5, fasciculata 11.7, reticularis 11.3%) and finally to senes- cence at month 24 (glomerulosa 10.3, fasciculata 10.7, reticularis 10.7%), as is shown in the histogram (Figure 12). Likewise, the labeling indices of adreno-medullary cells showing RNA synthesis in respective aging stages were calculated from the number of labeled mitochon- dria, dividing by the number of total mitochondria per cell. The results showed that the labeling indices gradu- ally increased from prenatal day 19 (adren alin 2.8, nora- drenalin 2.6%) to postnatal newborn day 1 (adrenalin 2.8, noradrenalin 2.4%), day 3 (adrenalin 3.3, noradrenalin 2.9%), day 9 (adrenalin 3.4, noradrenalin 2.3%) to juve- nile stage at day 14 (adrenalin 3.6, noradrenalin 3.8%), reaching the maximum, and decreased to adult stages at month 1 (adrenalin 2.1, noradrenalin 2.2%), month 2 (adrenalin 1.8, noradrenalin 1.6%), month 6 (adrenalin 1.7, noradrenalin 1.5%), month 12 (adrenalin 1.6, nora- drenalin 1.4%) and 24 (adrenalin 1.6, noradrenalin 1.5%) as shown in Figures 13-17. From the results, the in- creases of the mitochondrial labeling indices in both adrenalin and noradrenalin cells from embryo day 19 to postnatal day 14, as well as the decreases from day 14 to month 24 were stochastically significant (P < 0.01). In the previous study, the labeling indices of mito- chondrial DNA synthesis in 2 cell types of adrenal me- dulla in respective aging stages were already calculated from the number of labeled mitochondria and the number of total mitochondria per cell. The results showed that the labeling indices of DNA gradually increased from prenatal day 19 (adrenalin 2.8, noradrenalin 2.6%) to postnatal newborn day 1 (adrenalin 2.8, noradrenalin 2.4%), day 3 (adrenalin 3.3, noradrenalin 2.9%), day 9 (adrenalin 3.4, noradrenalin 2.3%) to juvenile stage at day 14 (adrenalin 3.6, noradrenalin 3.8%), reaching the maximum, and decreased to adult stages at month 1 (adrenalin 2.1, noradrenalin 2.2%), month 2 (adrenalin1.8, Figure 13. Electron microscopic radioautogram of the me- dulla of a juvenile mouse at postnatal day 14, labeled with 3H-uridine showing RNA synthesis (several silver grains) in the nucleus as well as in a few mitochondria of both adrenalin and noradrenalin cells. × 3 000. Figure 14. Electron microscopic radioautogram of the me- dulla of an old adult mouse aged at postnatal month 12, labeled with 3H-uridine showing RNA synthesis in the nu- cleus and a few mitochondria of both adrenalin and noradrenalin cells. 3000 ×.  T. Nagata / J. Biomedical Science an d Engineering 4 (2011) 219-234 Copyright © 2011 SciRes. JBiSE 228 Figure 15. Histogram showing number of mitochondria per cell. Figure 16. Histogram showing number of mitochondria labeled with 3H-ridine.  T. Nagata / J. Biomedical Science and Engineering 4 (2011) 219-234 Copyright © 2011 SciRes. JBiSE 229 Figure 17. Histogram showing the labeling index labeled with 3H-uridine. noradrenal i n 1. 6%), month 6 (adrenalin 1.7, noradrenalin 1.5%), month 12 (adrenalin 1.6, noradrenalin 1.4%) and 24 (adrenalin 1.6, noradrenalin 1.5%) as discussed in the previous study. From the results, the increases of the mitochondrial labeling indices in both the adrenalin and noradrenalin cells from embryo day 19 to postnatal day 14, as well as the decreases from day 14 to month 24 were stochastically significant (P < 0.01). The labeling indices of RNA revealed in the present study, on the other hand, gradually increased from prenatal day 19 (adrenalin 2.8, noradrenalin 2.6%) to postnatal newborn day 1 (adrenalin 2.8, noradr enalin 2.4%), day 3 (adr ena- lin 3.3, noradrenalin 2.9%), day 9 (adrenalin 3.4, nora- drenalin 2.3%) to juvenile stage at day 14 (adrenalin 3.6, noradrenalin 3.8%), reaching the maximum, and de- creased to adult stages at month 1 (adrenalin 2.1, nora- drenalin 2.2%), month 2 (adrenalin 1.8, noradrenalin 1.6%), month 6 (adrenalin 1.7, noradrenalin 1.5%), month 12 (adrenalin 1.6, noradrenalin 1.4%) and 24 (adrenalin 1.6, noradrenalin 1.5%). From the results, the increases of the mitochondrial labeling indices of RNA synthesis in both adrenalin and noradrenalin cells from embryo day 19 to postnatal day 14, as well as the de- creases from day 14 to month 24 were stochastically significant (P < 0.01). 4. DISCUSSION From the results obtained at present, it was shown that the labeling indices of the adreno-cortical cells in 3 lay- ers of each animal labeled with 3H-uridine demonstrat- ing RNA synthesis in 10 groups gradually increased from prenatal embryo day 19 to postnatal day 1, 3, 9, reaching the maxima, and decreased to day 14, month 1, 2, 6, 12 and 24, due to aging and senescence. On the other hand, the adreno-medullary cells showing RNA synthesis gradually increased from prenatal day 19 to postnatal newborn day 1, 3, 9, 14, reaching the maxi- mum, and decreased to adult stages at month 1, 6, 12, and 24, slightly different from DNA synthesis. As for the macromolecular synthesis in various cells in various organs of experimental animals observed by light and electron microscopic radioautography, it is well known that the silver grains due to radiolabeled 3H-thy- midine demonstrate DNA synthesis [1-3,48,49], while the grains due to 3H-uridine demonstrate RNA synthesis [22,25,26,28]. The previous results obtained from the studies on the adreno-cortical cells of aging mice by light microscopic radioautography revealed that silver grains indicating DNA synthesis incorporating 3H-thy- midine were observed over the nuclei of some adreno- cortical cells at perinatal stages from postnatal day 1 to 14 [39,40]. However, they did not observe the intrami- tochondrial DNA synthesis. In the previous study [41], the numbers of silver grains showing nuclear DNA syn- thesis, as expressed by grain counting, did not give any significant difference between the cells in the 3 layers in  T. Nagata / J. Biomedical Science an d Engineering 4 (2011) 219-234 Copyright © 2011 SciRes. JBiSE 230 the same aging groups. These results indicated that the amount of DNA synthesized in one nucleus was almost the same as in any other cells independent upon whether the nucleus belong ed to any layers of th e adrenal cortex. However, these differences between the 3 layers at re- spective aging groups were not stochastically significant (P < 0.01). These results indicated that the DNA syn- thetic activity in the nuclei of 3 layers of the adrenal cortex did not show any difference. To the contrary, the numbers of mitochondria labeled with 3H-thymidine per cell as well as the labeling indices between the aging groups increased gradually from prenatal embryo day 19, to postnatal day 1, 3, 9 and 14, to postnatal month 1 and 2, then decreased to month 6, 12 and 24. These de- creases were stochastically significant (P < 0.01). These results indicated that the mito chondria in adreno-cortical cells proliferated from perinatal and postnatal newborn stage to adult stage at postnatal month 1 and 2, reaching the maxima, then lost their proliferating activities from aged stage at month 6 to senescent stage up to month 24. On the other hand, the radioautograms in the present study showing incorporations of 3H-uridine into mito- chondria indicating mitochondrial RNA synthesis re- sulted in silver grain localization over the mitochondria independently from the nuclei whether the nuclei were labeled with silver grains or not in almost all the cells in the 3 layers of the adreno-cortical cells from prenatal embryo day 19 to postnatal day 1, 3, 9 and 14, to post- natal month 1, 2, 6, 12 and 24, during the development and aging. The numbers of labeled mitochondria show- ing RNA synthesis increased from perinatal day to post- natal adult stage at month 2, then kept plateau, while the labeled mitochondria with 3H-uridine showing RNA synthesis increased from perinatal stage to postnatal adult stage at month 2, then decreased at month 24, while the labeling indices increased from perinatal em- bryonic day to postnatal newborn and juvenile stages at day 9, then decreased from day 14 to senescence at month 24, then decreased to the adult stages at month 1 and 2, to month 6, 12 and 24. These changes demon- strate the respective aging changes. The results obtained previously [41] indicated that mitochondria in the adre- nocortical cells proliferated from newborn to adult stag- es around month 1 and 2, showing mitochondrial DNA synthesis, while the mitochondrial RNA synthesis in- creased from newborn stage to postnatal day 9, then de- creased from day 14, reaching the maxima, then de- creased to month 24, but the RNA synthetic activity was kept from day 14 to month 12 which decreased to se- nescent at month 24 due to aging. With regard to the DNA in mitochondria in animal cells or plastids in plant cells, many studies have been reported in various cells of various plants and animals since 1960s [53-56]. Most of these authors observed DNA fibrils in mitochondria which were histochemically extracted by DN’ase. Electron microscopic observation of the DNA molecules isolated from the mitochondria revealed that they were circular in shape, with a circum- ference of 5-6 µm [57]. It was calculated that such a single molecule had a molecular weight of about 107 daltons [58]. Mitochondria of various cells also con- tained DNA polymerase, which was supposed to func- tion in the replication of the mitochondrial DNA [59]. On the other hand, the incorporations of 3H-thymidine into mitochondria demonstrating DNA synthesis were observed by means of electron microscopic radioauto- graphy in lower organism such as slime mold [60,61], tetrahymena [62] or chicken fibroblasts in tissue culture under abnormal conditions [63]. However, these authors used old-fashioned developers consisting of methol and hydroquinone (MQ-developer), which produced coarse spiral silver grains resulting in inaccurate localization over cell organelles when observed by electron micros- copy. All of these authors showed photographs of elec- tron radioautographs with large spiral-formed silver grains (2-3 µm in diameter) localizing not only over the mitochondria but also outside the mitochondria. I n order to obtain smaller silver grains, we first used elon-ascorbic acid developer after gold latensification [1-6], which produced comma-shaped smaller silver grains (0.4-0.8 µm in diameter), then later we used phenidon developer after gold latensification, producing dot-like smaller silver grains (0.2-0.4 µm in diameter) localizing only inside the mitochondria showing ultrahigh resolution of radioautograms [30,49-52]. These papers were the first that demonstrated intramitochondrial DNA synthesis incorporating 3H-thymidine with accurate intramito- chondrial localization in avian and mammalian cells. With regard to the resolution of electron microscopic radioautography, on the other hand, many authors dis- cussed the size of silver grains under various conditions and calculated various values of resolutions [4,5,64-66]. Those authors who used the M-Q developers maintained the resolution to be 100-160 nm [64,65], while those authors who used the elon-ascorbic acid developer [4,5,66] calculated it to be 25-50 nm. When we used phenidon developer at 16˚C for 1 min after gold latensi- fication, we could produce very fine dot-shaped silver grains and obtained the resolution around 25 nm [30,49-51,66,67]. For the analysis of electron radioauto- graphs, Salpeter et al. [64] proposed to use the half-distance and very complicated calculations through which respective coarse spiral-shaped silver grains were judged to be attributable to the radioactive source in a certain territory within a resolution boundary circle. However, since we used phenidon developer after gold  T. Nagata / J. Biomedical Science and Engineering 4 (2011) 219-234 Copyright © 2011 SciRes. JBiSE 231 latensification to produce very fine dot-shaped silver grains, we judged only the silver grains which were lo- cated in the mitochondria which were dot-shaped very fine ones to be attributable to the mitochondria without any problem as was formerly discussed [3-5,49-52]. Then we also demonstrated intramitochondrial DNA synthesis incorporating 3H-thymidine in some other es- tablished cell lines originated fro m human being such as HeLa cells [3-6] or mitochondrial fractions prepared from in vivo mammalian cells such as rat and mouse [7-9]. It was later commonly found in various cells and tissues not only in vitro obtained from various organs in vivo such as the cultured human HeLa cells [13,68], cultured rat sarcoma cells [12], mouse liver and pancreas cells in vitro [11,14,31], but also in vivo cells obtained from various organs such as the salivary glands [15], the liver [16-29], the pancreas [30,31], the trachea [32], the lung [33], the kidneys [34], the testis [35,36], the uterus [37,38], the adrenal glands [39-42], the brains [43], and the retina [44-48] of mice, rats and chickens. Thus, it is clear that all the cells in various organs of various ani- mals synthesize DNA not only in their nuclei but also in their mitochondria. The relationship between the intramitochondrial DNA synthesis and cell cycle was formerly studied in syn- chronized cells and it was clarified that the intramito- chondrial DNA synthesis was performed without nuclear involvement [4]. However, the relationship between the DNA synthesis and the aging of individual animals and men has not yet been clarified except a few papers re- cently published by Korr and associates on mouse brain [69-72]. They reported both nuclear DNA repair, meas- ured as nuclear unscheduled DNA synthesis, and cyto- plasmic DNA synthesis labeled with 3H-thymidine in several types of cells in brains such as pyramidal cells, Purkinje cells, granular cells, glial cells, endothelial cells, ependymal cells, epithelial cells as observed by light microscopic radioautography using paraffin sections. They observed silver grains over cytoplasm of these cells by light microscopy and maintained that it was reasonable to interpret these labeling as 3H-DNA outside the nuclei, which theoretically belonged to mitochon- drial DNA without observing the mitochondria by elec- tron microscopy. From the results, they concluded that distinct types of neuronal cells showed a decline of both unscheduled DNA and mitochondrial DNA syntheses with age in contrast that other cell types, glial an d endo- thelial cells, did not show such age-related changes without counting the number of mitochondria in respec- tive cells nor counting the labeling indices at respective aging stages. Thus, their results from the statistics ob- tained from the cytoplasmic grain counting seems to be not accurate without observing mitochondria directly. To the contrary, we had studied DNA synthesis in the livers of aging mice [16-29] and clearly demonstrated that the number of mitochondria in each hepatocytes, especially mononucleate hepatocytes, increased with the ages of animals from the perinatal stages to adult and senescent stages, while the number of labeled mitochondria and the labeling indices increased from the perinatal stages, reaching a maximum at postnatal day 14, then decreased. Our previous studies [22,23] also clarified that the DNA synthesis and cell proliferation by mitosis were the most active in the nuclei of mononucleate hepatocytes at the perinatal stages in contrast that binucleate cells were less active at the perinatal stage but th e number of binucleate hepatocytes increased at senescent stages and the results suggest the possibility that the mitochondria in mononu- cleate hepatocytes synthesized their DNA by themselves which peaked at postnatal day 14 in accordance with the proliferation of mononucleate hepatocytes while binu- cleate hepatocytes increased after the perinatal stage and did not divide but remained binucleate keeping many mitochondria in their cytoplasm which were more in number than mononucleate hepatocytes at the senescent stage. Thus, our previous papers [22-28] were the first that dealt with the relationship between the DNA synthesis and aging in hepatocytes of mice in vivo at v arious ages by means of electron microscopic radioautography ob- serving the small dot-like silver grains, due to incorpor a- tions of 3H-thymidine, which exactly localized inside the mitochondria. Our previous results [39-42] also r evealed that an increase was observed by direct observation on mitochondria at electron microscopic level and obtaining accurate mitochondrial number and labeling indices in adreno-cortical cells in 8 groups of developing mice. There was a discrepancy between our results from the hepatocytes [22,23] as well as the adrenocortical cells [39-42] and the results from the several types of cells in the brains by Korr et al. [69-72]. The reaso n for this dif- ference might be due to the difference between the cell types (hepatocytes or ad renal cells and the brain cells) or the difference between the observation by electron mi- croscopy, i.e., direct observation of mitochondria in our results or light microscopy, i.e., indirect observation of mitochondria without observing any mitochondria di- rectly and misinterpretation by Korr et al. [69-72]. The results obtained from the adrenal glands of aging mice at present should form a part of special cytochem- istry [49], as well as a part of special radioautographol- ogy [50], i.e., the application of radioautography to the adrenal glands, as was recently reviewed by the present author. We expect that such special radioautographology and special cytochemistry should be further developed in all the organs animals in the future.  T. Nagata / J. Biomedical Science an d Engineering 4 (2011) 219-234 Copyright © 2011 SciRes. JBiSE 232 5. CONCLUSIONS From the results obtained at present, it was concluded that almost all the cells in the 3 layers of the adrenal cortex of mice at various ages, from prenatal embryo day 19 to postnatal newborns, on day 1, 3, 9 and 14, and adults to postnatal month 1, 2, 6, 12 and 24, were labeled with silver grains showing RNA synthesis with 3H-uridine in their mitochondria. Quantitative analysis on the number of mitochondria in adreno-cortical cells in the 3 layers resulted in an increase from the prenatal day to postnatal day 1, 3, 9, 14, and month 1 and 2, and 6, reaching the maximum at postnatal month 12, then a little decreased to month 24. To the contrary, the num- bers of labeled mitochondria with 3H-uridine showing RNA synthesis increased from perinatal stage to postna- tal juvenile stage at day 9, and decreased to aging and senescence, while the mitochondrial labeling index also increased from prenatal day to postnatal day 1, 3 and 9, reaching the maximum at postnatal day 9, then de- creased to day 14, month 1, 2, 6, 12 and 24. On the other hand, the number of mitochondria per cell in the medulla increased from fetal day 19 to post- natal month 1 reaching the plateau from month 1 to 24, while the number of labeled mitochondria per cell and the labeling index of intramitochondrial RNA synthesis incorporating 3H-uridine increased from fetal day 19 to postnatal day 14, reaching the maxima and decreased from month 1 to 24. These results demonstrate that the number of mito- chondria in adrenal cells in both the cortex and medulla increased by proliferating themselves synthesizing mi- tochondrial DNA and RNA at perinatal stages to postna- tal month 1-6 and decreased due to aging. 6. ACKNOWLEDGEMENTS This study was supported in part by Grant-in-Aids for Scientific Re- search from the Ministry of Education, Science and Culture of Japan (No. 02454564) while the author worked at Shinshu University School of Medicine as well as Grants for Promotion of Characteristic Research and Education from the Japan Foundation for Promotion of Private Schools (1997, 1998 1999, 2000) while the author worked at Nagano Women’s Jr. College. The author is also grateful to Grant-in-Aids for Scientific Research from the Japan Society for Promotion of Sciences (No. 18924034, No. 19924204 and No. 20929003) while the author has been working at Shinshu Institute of Alternative Medicine and Welfare since 2005 up to the present time. The author thanks Dr. Kiyokazu Kametani, Technical Official, Research Center for Instrumental Analy- sis, Shinshu University, for his technical assistance in electron micros- copy during the course of this study. REFERENCES [1] Nagata, T., Shibata, O. and Nawa, T. (1967a) Electron microscopic radioautographic studies of nucleic acid and protein syntheses in the liver and kidney cells of chickens and mice in tissue culture. Archivum Histologicum Ja- ponicum, 28, 540-541. [2] Nagata, T., Shibata, O. and Nawa, T. (1967b) Incorpora- tion of tritiated thymidine into mitochondrial DNA of the liver and kidney cells of chickens and mice in tissue cul- ture. Histochemie, 10, 305-308. doi:10.1007/BF00304312 [3] Nagata, T. (1972a) Electron microscopic dry-mounting autoradiography. Proceedings of the 4th International Cong Histochemistry and Cytochemistry, Kyoto, 43-44. [4] Nagata, T. (1972b) Radioautographic study on intrami- tochondrial nucleic acid synthesis: Its relationship to the cell cycle in cultivated cells. Proceedings of the 4th In- ternational Cong Histochemistry and Cytochemistry, Kyoto, 223-224. [5] Nagata, T. (1972c) Electron microscopic radioautography of intramitochondrial RNA synthesis of HeLa cells in culture. Histochemie, 32,163-170. doi:10.1007/BF00303731 [6] Nagata, T. (1972d) Quantitative electron microscope radioautography of intramitochondrial nucleic acid syn- thesis. Acta Histochemica et Cytochemica, 5, 201-203. [7] Nagata, T. (1974) Electron microscopic radioautography of intramitochondrial nucleic acid syntheses in mammal- ian cells in vitro. Proceedings of the 8th International Cong Electron Microscopy, Canberra, 2, 346-347. [8] Nagata, T., Yamada, Y., Iwadare, N. and Murata, F. (1975) Relationship of intramitochondrial nucleic acid synthesis to the nucleoli in cultivated cells as revealed by electron microscopic radioautography. Proceedings of the 10th International Cong Anatomy, Tokyo , 474-475. [9] Nagata, T., Iwadare, N. and Murata, F. (1976) Mitochon- drial and nucleolar RNA synthesis as revealed by elec- tron microscopic radioautography. Proceedings of 5th International Cong Histochemistry and Cytochemistry, Bucharest, 242-243. [10] Nagata, T. (1984) Electron microscopic observation of target cells previously observed by phase-contrast mi- croscopy: Electron microscopic radioautography of laser beam irradiated cultured cells. Journal of Clinical Elec- tron Microscopy, 17, 589-570. [11] Nagata, T. and Murata, F. (1977) Electron microscopic dry-mounting radioautography for diffusible compounds by means of ultracryotomy. Histochemistry, 54, 75-82. doi:10.1007/BF00493331 [12] Nagata, T., Iwadare, N. and Murata, F. (1977a) Electron microscopic radioautography of nucleic acid synthesis in cultured cells treated with several carcinogens. Acta Pharmacol Toxicol, 41, 64-65. [13] Nagata, T., Murata, F., Yoshida, K., Ohno, S., Iwadare and N. (1977b) Whole mount radioautography of cul- tured cells as observed by high voltage electron micros- copy. Proceedings of the 5th International Conference on High Voltage Electron Microscopy, Kyoto, 347-350 [14] Nagata, T., Ohno, S. and Murata, F. (1977c) Electron microscopic dry-mounting radioautography for soluble compounds. Acta Pharmacol Toxicol, 41, 62-63. [15] Nagata, T., Ito, M. and Chen, S. (2000) Aging changes of DNA synthesis in the submandibular glands of mice as observed by light and electron microscopic radioauto-  T. Nagata / J. Biomedical Science and Engineering 4 (2011) 219-234 Copyright © 2011 SciRes. JBiSE 233 graphy. Annals of Microscopy, 1, 13-22. [16] Nagata, T., Ohno, S., Kawahara, I., Yamabayashi, S., Fujii, Y. and Murata, F. (1979) Light and electron micro- scopic radioautography of nucleic acid synthesis in mi- tochondria and peroxisomes of rat hepatic cells during and after DEHP administration. Acta Histochemica et Cytochemica, 16, 610-611. [17] Nagata, T., Ohno, S., Yoshida, K. and Murata, F. (1982a) Nucleic acid synthesis in proliferating peroxisomes of rat liver as revealed by electron microscopical radioauto- graphy. Histochemical Journal, 14, 197-204. doi:10.1007/BF01041214 [18] Nagata, T., Fujii, Y. and Usuda, N. (1982b) Demonstra- tion of extranuclear nucleic acid synthesis in mammalian cells under experimental conditions by electron micro- scopic radioautography. Proceedings of the 10th Interna- tional. Cong Electron Microscopy, Hamburg, 2, 305-306. [19] Ma, H. and Nagata, T. (1988a) Studies on DNA synthesis of aging mice by means of electron microscopic radio- autography. Journal of Clinical Electron Microscopy, 21, 335-343. [20] Ma, H. and Nagata, T. (1988b) Electron microscopic radioautographic study of DNA synthesis in the livers of aging mice. Journal of Clinical Electron Microscopy, 21, 715-716. [21] Ma, H., Gao, F., Sun, L., Jin, C. and Nagata, T. (1994) Electron microscopic radioautographic study on the syn- thesis of DNA, RNA and protein in the livers of aging mice. Medical Electron Microscopy, 27, 349-351. doi:10.1007/BF02349694 [22] Nagata, T. (2003) Light and electron microscopic radio- autographic studies on macromolecular synthesis in ami- totic hepatocytes of aging mice. Cell and Molecular Bi- ology, 49, 591-611. [23] Nagata, T. and Ma, H. (2005) Electron microscopic ra- dioautographic study on mitochondrial DNA synthesis in hepatocytes of aging mouse. Annals of Microscopy, 5, 4-18. [24] Nagata, T. (2006) Electron microscopic radioautographic study on protein synthesis in hepatocyte mitochondria of developing mice. Annals of Microscopy, 6, 42-54. [25] Nagata, T. (2007) Electron microscopic radioautographic study on macromolecular synthesis in hepatocyte mito- chondria of aging mouse. Journal of Cell & Tissue Re- search, 7, 1019-1029. [26] Nagata, T. (2007) Electron microscopic radioautographic study on nucleic acids synthesis in hepatocyte mitochon- dria of developing mice. Trends Cell and Molecular Bi- ology, 2, 19-33. [27] Nagata, T. (2007) Electron microscopic radioautographic study on protein synthesis in mitochondria of binucleate hepatocytes in aging mice. Scientific World Journal, 7, 1008-1023. doi:10.1100/tsw.2007.140 [28] Nagata, T. (2007) Macromolecular synthesis in hepato- cyte mitochondria of aging mice as revealed by electron microscopic radioautography. I. Nucleic acid synthesis. In: Vilas, A.M., Alvarez, J.D. Eds., M odern Resea rch and Educational Topics in Microscopy. Formatex, Badajoz, Spain, 1, 245-258. [29] Nagata, T. (2007) Aging changes of macromolecular synthesis in the mitochondria of the liver of aging mouse. Annual Review of Biomedical Sciences, 9, 30-36. [30] Nagata, T. (1992) Radiolabeling of soluble and insoluble compounds as demonstrated by light and electron mi- croscopy. In: Wegmann, R.J., Wegmann, M.A. Eds., Re- cent Advances in Cellular and Molecular Biology, Peters Press, Leuven, 6, 9-21. [31] Nagata, T., Usuda, N. and Ma, H. (1986) Electron mi- croscopic radioautography of nucleic acid synthesis in pancreatic acinar cells of prenatal and postnatal aging mice. Proceedings of the 11th International Cong Elec- tron Microscopy, Kyoto, 3, 2281- 2282. [32] Sun, L., Gao, F., Jin, C. and Nagata, T. (1997) DNA syn- thesis in the trachea of aging mice by light and electron microscopic radioautography. Acta Histochemica et Cy- tochemica, 30, 211-220. [33] Nagata, T. and Sun, L. (2007) Electron microscopic ra- dioautographic study on mitochondrial DNA and RNA syntheses in pulmonary cells of aging mice. Annals of Microscopy, 7, 36-59. [34] Hanai, T. and Nagata, T. (1994) Electron microscopic radioautographic study on nucleic acid synthesis in peri- natal mouse kidney tissue. Medical Electron Microscopy , 27, 355-357. doi:10.1007/BF02349695 [35] Gao, F., Ma, H., Sun, L., Jin, C. and Nagata, T. (1994) Electron microscopic radioautographic study on the nu- cleic acid and protein synthesis in the aging mouse testis. Medical Electron Microscopy, 27, 360-362. doi:10.1007/BF02349697 [36] Gao, F., Chen, S., Sun, L., Kang, W., Wang, Z. and Na- gata, T. (1995) Radioautographic study of the macromo- lecular synthesis of Leydig cells in aging mouse testis. Cell and Molecular Biology, 41, 145-150. [37] Yamada, A.T. and Nagata, T. (1992) Light and electron microscopic radioautography of DNA synthesis in the endometria of pregnant ovariectomized mice during ac- tivation of implantation window. Cell and Molecular Bi- ology, 38, 763-774. [38] Yamada, A.T. and Nagata, T. (1993) Light and electron microscopic radioautographic studies on the RNA syn- thesis of peri-implanting pregnant mouse uterus during activation of receptivity for blastocyst implantation. Cell and Molecular Biology, 39, 221-233. [39] Ito, M. and Nagata, T. (1996) Electron microscopic ra- dioautographic study on DNA synthesis and the ultra- structure of the adrenal gland in aging mice. Medical Electron Microscopy, 29, 145-152. doi:10.1007/BF02348068 [40] Ito, M. (1996) Radioautographic studies on aging changes of DNA synthesis and the ultrastructural devel- opment of mouse adrenal gland. Cell and Molecular Bi- ology, 42, 279-292. [41] Nagata, T. (2008) Electron microscopic radioautographic study on mitochondrial DNA synthesis in adrenal cortical cells of developing mice. Journal of Cell & Tissue Re- search, 8, 1303-1312. [42] Nagata, T. (2008) Electron microscopic radioautographic study on mitochondrial DNA synthesis in adrenal cortical cells of developing and aging mice. Science World Jour- nal, 8, 683-697. [43] Cui, H., Gao, F., Ma, H. and Nagata, T. (1996) Study on DNA synthesis of cellular elements in the cerebella of aging mice by light and electron microscopic radioauto- graphy. Proceedings of the 4th China-Japan Joint Histo-  T. Nagata / J. Biomedical Science an d Engineering 4 (2011) 219-234 Copyright © 2011 SciRes. JBiSE 234 chemistry and Cytochemistry Symposium, Chongqing Pub- lishing House, Chongqing, 111-112. [44] Gunarso, W. (1984) Radioautographic studies on the nucleic acid synthesis in the retina of chicken embryo II. Electron microscopic radioautography. Shinshu Medical Journal, 32, 241- 248. [45] Gunarso, W., Gao, F., Cui, H., Ma, H. and Nagata, T. (1996) A light and electron microscopic radioautographic study on RNA synthesis in the retina of chick embryo. Acta Histochemica, 98, 300-322. [46] Gunarso, W., Gao, F. and Nagata, T. (1997) Development and DNA synthesis in the retina of chick embryo ob- served by light and electron microscopic radioautography. Cell and Molecular Biology, 43, 189-201. [47] Kong, Y. and Nagata, T. (1994) Electron microscopic radioautographic study on nucleic acid synthesis of peri- natal mouse retina. Medical Electron Microscopy, 27, 366-368. doi:10.1007/BF02349699 [48] Nagata, T. (2006) Aging changes of macromolecular synthesis in the avian and mammalian eyes as revealed by microscopic radioautography. Annual Review of Bio- medical Sciences, 8, 33-67. [49] Nagata, T. (2001) Special cytochemistry in cell biology. In: Jeon, K.W. Ed., International Review of Cytology, Academic Press, New York, 211, 33-151. [50] Nagata, T. (2002) Radioautographology general and spe- cial. In: Graumann, W. Ed., Progress in Histochemistry and Cytochemistry, Urban & Fischer, Jena, 37, 57-226. [51] Nagata, T. (1996) Techniques and application of electron microscopic radioautography. Journal of Electron Mi- croscopy, 45, 258-274. [52] Nagata, T. (1997) Techniques and application of micro- sco p i c radioautography. Histology and Histopathology , 12, 1091-1 124. [53] Nass, S. and Nass, M.M.K. (1963) Intramitochondrial fibers with DNA characteristics. I. Fixation and electron staining reactions. II. Enzymatic and other hydrolytic treatments. The Journal of Cell Biology, 19, 593-629. doi:10.1083/jcb.19.3.593 [54] Gibor, A. and Granick, S. (1964) Plastids and mitochon- dria: Inheritable system. Science, 145, 890-897. doi:10.1126/science.145.3635.890 [55] Gahan, P.B. and Chayen, J. (1965) Cytoplasmic deoxy- ribonucleic acid. International Review of Cytology, 18, 223-247. doi:10.1016/S0074-7696(08)60555-0 [56] Nass, M.M.K. (1966) The circularity of mitochondrial DNA. Proceedings of the National Academy of Sciences, 56, 1215-1222. doi:10.1073/pnas.56.4.1215 [57] van Bruggen, E.F.J, Borst, P., Ruttenberg, G.J.C.M., Gruber, M. and Kroon, A.M. (1966) Circular mitochon- drial DNA. Biochimica et Biophysica Acta, 119, 437-439. [58] Sinclair, J.H. and Stevens, B.J. (1966) Circular DNA filaments from mouse mitochondria. Proc Nat Acad Sci US., 56, 508-514. doi:10.1073/pnas.56.2.508 [59] Schatz, G. (1970) Biogenesis of mitochondria. In: Racker, E., Ed., Membranes of Mitochondria and Chloroplasts, Van Nostrand-Reinhold, New York, 251-314. [60] Guttes, E. and Guttes, S. (1964) Thymidine incorporation by mitochondria in Physarum polycephalum. Science, 145, 1057- 1058. doi:10.1126/science.145.3636.1057 [61] Schuster, F.L. (1965) A deoxyribose nucleic acid com- ponent in mitochondria of didymium nigirpes, a slime mold. Experimental Cell Research, 39, 329-345. doi:10.1126/science.145.3636.1057 [62] Stone, G.E. and Miller Jr., O.L. (1965) A stable mito- chondrial DNA in Tetrahymena puriformis. Experimental Zoology, 159, 33-37. doi:10.1002/jez.1401590104 [63] Chévremont, M. (1963) Cytoplasmic deoxyribonucleic acids: Their mitochondrial localization and synthesis in somatic cells under experimental conditions and during the normal cell cycle in relation to the preparation for mitosis. Cell Growth and Cell Division. In: Harris, R.J.C. Ed., Symposia of the International Society for Cell Biol- ogy, Academic Press, New York, 2, 323-333. [64] Salpeter, M.M., Bachmann, L. and Salpeter, E.E. (1969) Resolution in electron microscope radioautography. The Journal of Cell Biology, 44, 1-20. doi:10.1083/jcb.41.1.1 [65] Nadler, N.J. (1971) The interpretation of grain counts in electron microscope radioautography. The Journal of Cell Biology, 49, 377-382. [66] Uchida, K. and Mizuhira, V. (1971) Electron microscope autoradiography with special reference to the problem of resolution. Archivum Histologicum Japonicum, 31, 291-320. [67] Murata, F., Yoshida, K., Ohno, S. and Nagata, T. (1979) Electron microscopic radioautography using a combina- tion of phenidon developer and domestic emulsion. Acta Histochemica et Cytochemica, 12, 443-450. [68] Nagata, T. (1984) Electron microscopic observation of target cells previously observed by phase-contrast mi- croscopy: Electron microscopic radioautography of laser beam irradiated cultured cells. Journal of Clinical Elec- tron Microscopy, 17, 589-590. [69] Korr, H., Phillipi, V., Helg, C., Schiefer, J., Graeber, M.B. and Kreutzberg, G.W. (1997) Unscheduled DNA synthe- sis and mitochondrial DNA synthetic rate following in- juring of the facial nerve. Acta Neuropathologica, 94, 557-566. doi:10.1007/s004010050750 [70] Korr, H., Kurz, C., Seidler, T.O., Sommer, D., Schmitz, C. (1998) Mitochondrial DNA synthesis studied autoradio- graphically in various cell types in vivo. Brazilian Jour- nal of Medical and Biological Research, 31, 289-298. doi:10.1590/S0100-879X1998000200012 [71] Schmitz, C., Axmacher, B., Zunker, U. and Korr, H. (1999a) Age related changes of DNA repair and mito- chondrial DNA synthesis in the mouse brain. Acta Neu- ropathologica, 97, 71-81. doi:10.1007/s004010050957 [72] Schmitz, C., Materne, S. and Korr, H. (1999b) Cell-type- specific differences in age-related changes of DNA repair in the mouse brain-molecular basis for a new approach to understand the selective neuronal vulnerability in Alz- heimer’s disease. Journal of Alzheimer’s Disease, 1, 387-407. |