Vol.3, No.1B, 20-25 (2014) Journal of Agricultural Chemistry and Environment
http://dx.doi.org/10.4236/jacen.2014.31B005
Copyright © 2014 SciRes. OPEN ACCESS
Novel method for determination of sodium in foods
by thermome tr ic endpoint titrime try (TE T )
Thomas Smith1*, Christian Haider2
1Antom Technologies Pty Ltd., Brisbane, Australia; *Corresponding Author: labrat@antomtechnologies.com
2Titration Competence Center, Metrohm AG, Herisau, Switzerland
Received November 2013
ABSTRACT
A no ve l ye t simple, rapid and robust thermomet-
ric endpoint titration (TET) method for the deter-
mination of sodium in various foodstuffs is de-
scribed. Sodium reacts exothermically with alu-
minium in the presence of an excess of potas-
sium and fluoride ions to form NaK2AlF6 (“elpa-
solite”). This reaction forms the basis of a ro-
bust, reliable analytical procedure suitable for
routine process control. The reaction of calcium
under similar conditions (to form KCaAlF6) sug-
gests that potentia ll y, calcium may interfere in
the determination of sodium in some foodstuffs.
Results of an investigation suggest that at molar
ratios [Ca]/[Na] < 0.85, an error of <1% of the
measured value of sodium is incurred.
KEYWORDS
Sodium; Titration; Food; Foodstuffs; TET;
Thermometric Endpoint Titration; Elpasolite
1. INTRODUCTION
In recent times, the negative impact of high levels of
dietary sodium on human health outcomes has attracted
increased attention from public health regulatory authori-
ties. In many jurisdictions, there is a requirement for
food manufacturers to state the total sodium content of
the product on the package. To this time, sodium in food-
stuffs has been analyzed by spectroscopic techniques
such as flame photometry, inductively-coupled plasma
spectroscopy (ICP) and atomic absorption spectroscopy
(AAS), or by ion selective electrode (ISE), gravimetry or
titrimetry.
The spectroscopic procedures mentioned previously
require extensive sample dilution to br ing the analyte
concentration into a suitable range for measurement, and
require careful sample clean-up to avoid nebulizer and
burner blockage. Further, a significant financial barrier
for smaller laboratories is the provision and maintenance
of gas supplies and fume extraction equipment. Ion se-
lective electrode measurement has to contend with inter-
ferences and changes in sodium ion activity with respect
to the composition of the sample matrix. Gravimetric
procedures generally suffer by being slow and demand-
ing of high skill levels by analysts.
As an analytical chemistry technique, titration has an
advantage over spectroscopic and ion analysis methods
as it exhibits a linear (rather than logarithmic) response
to changes in concentration of the analyte. To date, the
main titration method for sodium has been analysing the
chloride content by argentometric titration with standard
silver nitrate and infer the sodium content from the
stoichiometry of sodium chloride. This approach suffers
from two significant sources of error. Firstly, not all so-
dium in a food has chloride as a counter-ion. Manufac-
turers routinely add salts of sodium for many purposes,
for instance as preservatives, stabilizers, emulsifiers and
flavour enhancers. Additionally, there are non-sodium
chloride sodium sources from the foods themselves. For
instance, a modern trend is to substitute a portion of the
sodium chloride additive with potassium chloride in or-
der to maintain a level of “saltiness” in the flavour pro-
file while reducing the sodium impact of the product.
Thus, in spite of its simplicity, the titrimetric determina-
tion of sodium by calculation from the chloride content is
considered no longer acceptable. Titrimetric procedures
for the determination of sodium ion itself, based on the
insolubility of sodium zinc uranyl acetate have been pro-
posed [1,2] but have clearly not found favour with users
over the years. Similarly, a complexo metric procedu re [3]
does not appear to be in routine use.
Saj [4] proposed a direct-injection enthalpimetric me-
thod for the determination of sodium. This method relied
on the exothermic precipitation of NaK2AlF6 (elpasolite),
with the temperature increase of the test solution corre-
lated to the amount of sodium present. The reaction:
++ 3+26
Na2KAl6FNaKAlF
+++↔
(1)
is simple and occurs stoichiometrically, but as described,
T. Smith, C. Haider / Journal of Agricultural C hem i stry and Environment 3 (2014) 20-25
Copyright © 2014 SciRes. OPEN ACCESS
21
Saj’s procedure is difficult and complex, requiring high-
ly accurate calorimetric measurements and the use of
hydrofluoric acid and platinum vessels. It is not suitable
for routine measurements by the less-skilled operators
employed in many quality control laboratories today.
In contrast to enthalpimetric measurement methods,
thermometric titrimetry is a technique which is able to
utilize the near-universal property of enthalpy change in
chemical reactions in a relatively easy-to-use manner.
Thermometric titrations are readily automated, and share
with other automated titration techniques the use of a
sensor to detect the endpoint of the titration reaction. In
the case of thermometric titrimetry, the sensor is a ther-
mometer. The temperature sensing element is a thermis-
tor, a solid-state device which exhibits relatively large
changes in its resistance as a function of temperature.
The thermistor forms one arm of Wheatstone bridge, and
the analogue output is converted to a digital signal and
transferred by an electronic interface to a computer for
processing. The actual temperature of the solution is im-
material, as the sensor is only required to detect the
change in solution temperature at the endpoint. For this
reason, there is no need to calibrate the sensor. Further,
sensor maintenance is minimal, and it is normally stored
dry between titrations. It is thus a technique suitable for
use in many industrial situations.
The challenge was to utilize the chemistry pioneered
by Saj and to convert it into a relatively easy titration
method, suitable for use in routine process and quality
control in food manuf acturing fa cilities. I t was found that
the only viable method employs a titrant solution com-
prising aluminium ions accompanied by potassium ions
in a concentration ratio such that the molar ratio [Al]/[K]
was 1:2.2, that is, a 10% molar excess over the stoi-
chiometric ratio of 1:2 in NaK2AlF6. Fully-dissociated
alumi ni um ion, Al3+ is the operating ion in the titrant, and
is the one against which the titrant is standardized. The
excess of fluoride ion required to drive the reaction equi-
librium to the right is provided in the titration solution by
either ammonium hydrogen difluoride, NH4FHF or
ammonium fluoride, NH4F. While NH4FHF also buff-
ers the titration solution to a near-ideal pH 3, NH4F can
be used in combination with acids such as hydrochloric,
acetic and trichloroacetic according to the circumstances
of sample preparation, and may be preferred by some
analysts.
2. EXPERIMENTAL
2.1. Apparatus
Thermometric titration measurements were made with
a Metrohm 8 59 Titrotherm thermometric titration system
(Herisau, Switzerland) fitted with a Metrohm 6.9011.040
Thermoprobe fluoride-resistant sensor. Automated titra-
tions were carried out in polypropylene vessels mounted
in the rac k of a Metrohm 814 Sample Processo r.
Sample preparation included comminution and disin-
tegration. A small “inverted cup” style of kitchen blender
was used to render some samples to a suitable size for
representative sampling, and a Polytron PT1300 D high
shear disintegrator (VWR, Germany) was used to fluid-
ize the sample and obtain maximum extraction of the
analyte.
2.2. Reagents
All reagents were of analytical grade.
Titrant: c(Al3+) = 0.5 mol/L, c(K+) = 1.1 mol/L, pre-
pared from aluminium nitrate Al(NO 3)39H2O and potas-
sium nitrate, KNO3.
Buffer/conditioning reagent: c(NHF.HF) = 300 g/L
ammonium hydrogen difluoride, or a lternatively, c(NH4F)
= 400 g/L ammonium fluoride.
pH adjuster, sample digestion and sodium liberation
aids: glacial acetic acid, trichloroacetic acid.
Solvents: toluene, acetone, deionized water.
Standard solution: c(NaCl) = 0.25 mol/L, prepared
from sodi um chloride fre shly dried for 4 hours at 110˚C.
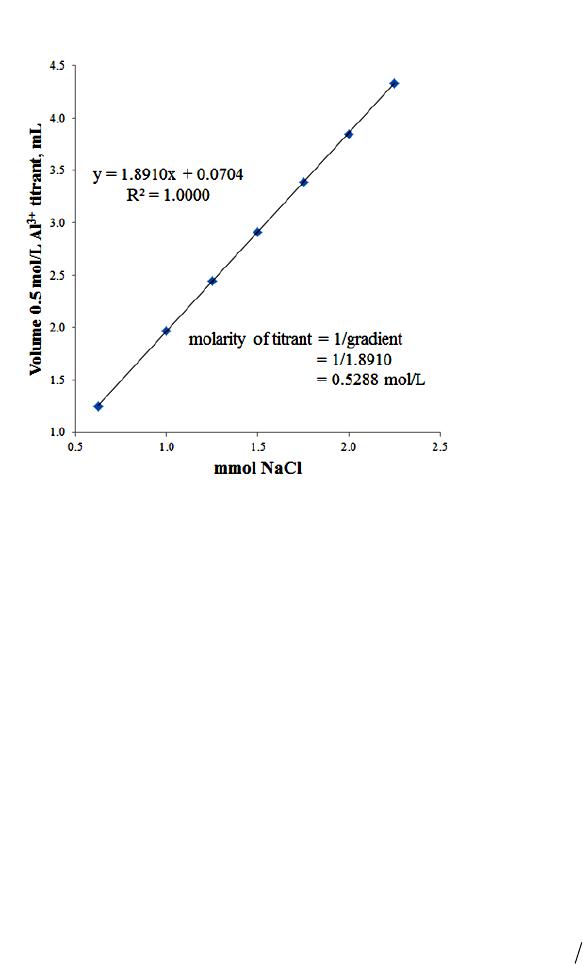
2.3. Titrant Standardization
The titrant is standardized against a standard sodium
solution, prepared from sodium chloride. A titration pro-
gram was prepared to automatically dispense aliquots of
increasing volumes of standard NaCl into successive
vessels placed in the rack of the sample processor. Each
titration vessel contained 5 mL c(NH4F) = 400 g/L and 1
mL concentrated HCl, with deionized water added such
that the total volume of f luid (including the NaCl aliquot)
approximated 30 mL. The titration program automatical-
ly computed the molarity, systematic error of the deter-
mination and the coefficient of correlation from a regres-
sion analysis of the results. Figure 1 illustrates the
process by which the titrant molarity and systematic er-
ror is calculated.
This procedure provides assurance that the method is
linear over the anticipated range of sodium values to be
measured, and also determines its systematic error. The
systematic error incorporates all error sources inherent in
the determination, including sodium impurities in the
reagents. The systematic error is equal to the value of the
y axis intercept in the linear relationship, and in this in-
stance was calculated to be 0.070 mL.
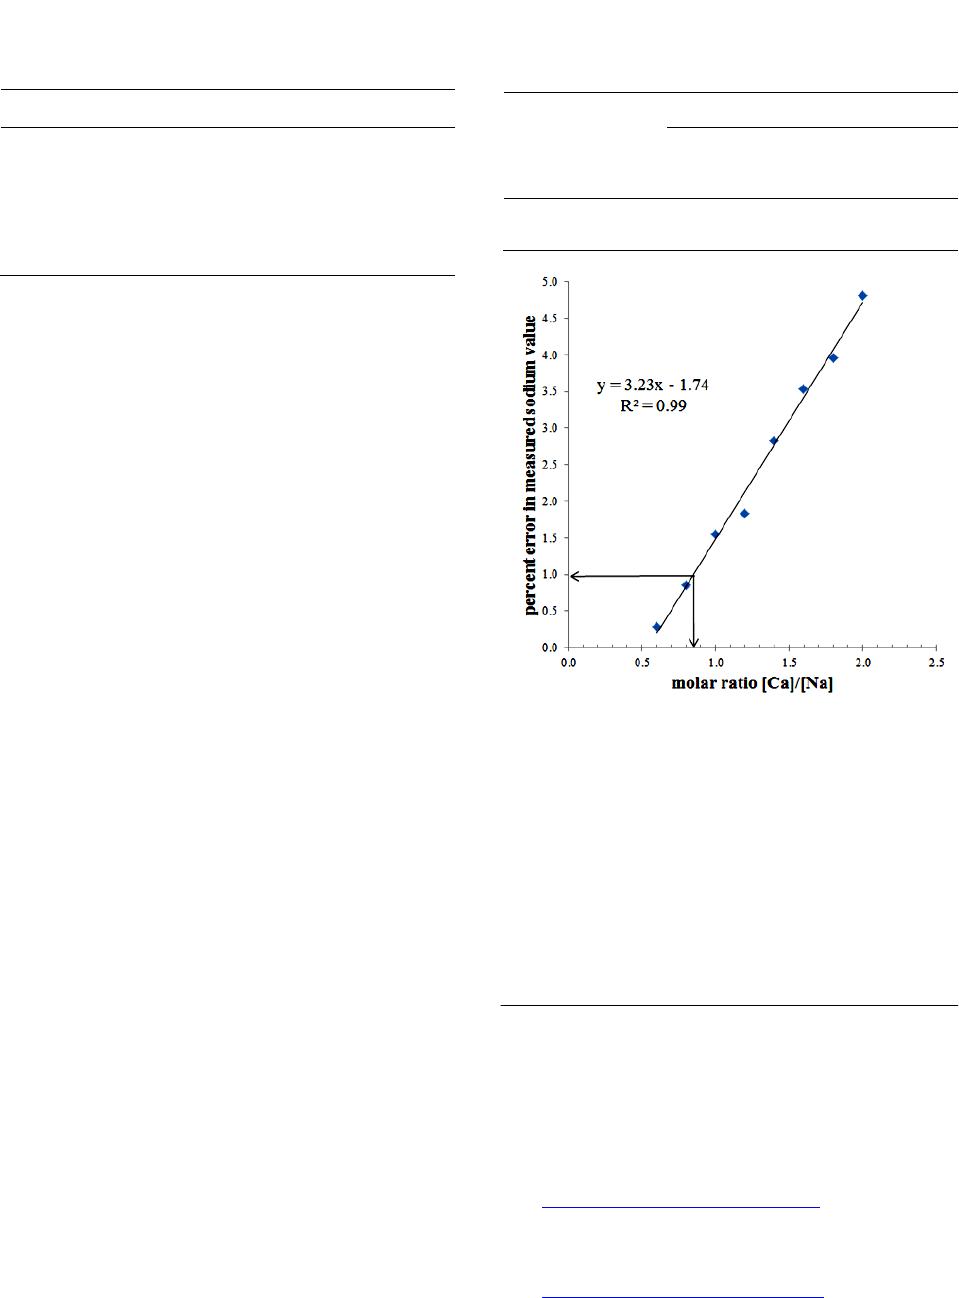
2.4. Determination of Systematic Error
For accurate estimation of analytes in samples by TET,
it is important to determine the systematic error of the
analysis as applied to the sample under investigation.
T. Smith, C. Haider / Journal of Agricultural C hem i stry and Environment 3 (2014) 20-25
Copyright © 2014 SciRes. OPEN ACCESS
22
Figure 1. Illustration of regression analysis method of ti-
trant molarity determination.
The systematic error of a titration encompasses all errors
inherent in the determination. These errors may include
in this instance (but may not be restricted to) traces of
sodium in the reagents used in the determination, the dif-
ference between the instrumentally-determined end-point
and that theoretically obtained under equilibrium condi-
tions, delays in the detection of temperature changes in
the solution, and processing delays in the electronics and
software of the instrument. In practical terms, the syste-
matic error needs only to be performed on each sample
type under investigation during the setting-up phase, un-
less experimental conditions are changed at a later date.
The methodology is analogous to the titrant standardiza-
tion procedure outlined previously. A range of sample
amounts are titrated, using the same quantities of rea-
gents employed for the sample preparation and the titra-
tion itself. A plot of the sample amount (x axis) against
the amount of titrant consumed (y axis) should yield a
linear relationship after regression analysis. The y axis
intercept is equivalent to the systematic error of the me-
thod. Except in the instance of a standard addition pro-
cedure, the systematic errors for the analysis of all sam-
ples reported here was determined.
2.5. Sample Preparation
This paper deals with the analysis of sodium in various
foodstuffs. There are at least three principals evident in
the preparation of a sample for titrimetric analysis:
1) The analyte must be fully liberated fro m the sample
matrix, and be in a suitable condition so that it can react
with the titrant;
2) The fluid containing the analyte is sufficiently mo-
bile and non-viscous so that it can be rapidly mixed with
the titrant, ensuring that the titration signal noise is not
excessive;
3) That other constituents present in the fluid pre-
sented for titration do not prevent a reproducible
stoichi ometric end p oint from being found.
Given that the physical and chemical nature of food-
stuffs varies enormously, the analyst must be able to use
knowledge of the sample in order to devise a suitable
sampl e preparati on re gime.
2.6. Determination of Sodium in Dairy and
Non-Dairy Milk Products
The sodium content of such produ cts is relatively low.
The general procedure was modified to employ a stan-
dard addition of a fixed volume of a sodium solution,
where the blank value of the standard addition is sub-
tracted from that obtained from titration of the sample
plus blank.
A 100 mL aliquot of milk was pipetted into a 250 mL
Erlenmeyer flask containing 12.0 g trichloroacetic acid
and a magnetic spin bar. The flask contents were then
stirred for five minutes. The curdled milk was then fil-
tered through a fast filtering paper. A 25 mL aliquot of
the filtrate was then titrated with standardized
c(Al(NO 3)3) = 0.5 mol/L, c(KNO3) = 1.1 mol/L solution
after automated addition of 3 mL c(NaCl) = 0.25 mol/L
and 5 mL c(NH4F) = 40% (w/v) solution. Note that sinc e
the aliquot is taken from a solution whose original vol-
ume has been enhanced by the addition of the tri-
chloroacetic acid; this volume increase has to be taken
into account when calculating the effective volume of
original milk actually titrated.
It was found experimentally that the dissolution of 12
g trichloroacetic acid in 100 mL water increased the
volume of solution to 106 mL. Therefore, for example, a
25 mL aliquot of filtrate or centrifugate was equivalent to
2510010623.58 mL×=
of ori ginal milk.
Table 1 lists results obtained in T.S’ laboratory, as well
as those by a colleague working in another laboratory
using the same methodology.
2.7. Determination of Sodium in “Two
Minute” or “Instant” Noodle Snacks
“Two minute” noodles are a popular snack. To prepare
for eating, boiling water is poured onto a compressed
noodle cake in the plastic container. Before eating the
contents of a flavour sachet are stirred in. Successful
analysis of the total sodium content requires that the so-
dium contents of the noodles and the flavouring are de-
termined separately, the results being combined mathe-
matically according to the respective masses of the com-
ponents. Beside sodium chloride, other sources of so-
dium are present in the product. Th e following list of so-
T. Smith, C. Haider / Journal of Agricultural C hem i stry and Environment 3 (2014) 20-25
Copyright © 2014 SciRes. OPEN ACCESS
23
Table 1. TET analysis of total sodium content of soy and cow’s
milks.
Sample
mg Na/100g
Nutritional
information-stated
average values (label) Found by TET
Soy milk #1 25 24.9 ± 0.2 (n = 7)
Soy milk #2 44 65.1 ± 0.1 (n = 8)
Soy milk #3 60 61.2 ± 0.81 (AAS = 62.02)
Cow’s milk 40 44.4 ± 0.41
Notes 1and 2: Results supplied by colle ague working i n another laboratory.
dium salts were found on the label of a popular brand of
“two-minute” noodles (Table 2).
2.7.1 Analysis of Dried Noodle Cake
The mass of the entire noodle cake was determined
and recorded. The cake was then roughly broken, and
transferred quantitatively to the container of an inverted
cup style of domestic blender, where it was reduced to
the consistency of coarse flour. It was then turned out in
its entirety onto a clean sheet of paper, where it was
“coned and quartered” to obtain a representative sample.
Approximately 2.5 g of sample was weighed accurately
into a 75 mL polypropylene titration vessel, and 10 mL
of 300 g/L trichloroacetic acid solution added. The sus-
pension was allowed to stand for a few minutes, then 10
mL acetone added, and the suspension homogenized with
a high shear disintegrator at 20,000 rpm. The shaft of the
disintegrator was washed with approximately 5 mL of a
1:1 acetone/water mixture into the titration vessel. Ace-
tone was used to reduce the swelling of the starch grains,
keeping the fluid mobile and easy to mix during the titra-
tion. The suspension was then titrated with standardized
c(Al(NO 3)3) = 0.5 mol/L , cKNO3) = 1.1 mol/L solution
after automated addition 5 mL c(NH4F) = 400 g/L solu-
tion .
2.7.2. Analy sis of Flavour Sachet
The mass of the entire contents of a flavour sachet was
first determined and recorded. The material was then
transferred quantitatively to a 500 mL volumetric flask,
which was made to volume with deionized water and
thoroughly mixed. To remove solids which might other-
wise block volumetric pipettes used to take aliquots, the
flask contents were filtered through a rapid flow quail-
tative filter paper. A 20 mL aliquot of the solution was
then pipetted into a 75 mL polypropylene titration vessel,
and 2 mL of concentrated hydrochloric acid added. The
automated titration program added 5 mL c(NH 4F) = 400
g/L solution before being titrated with standardized
c(Al(NO3)3) = 0.5 mol/L , c(KNO3) = 1.1 mol/L s olution.
Table 2. Food code numbers for sodium sources in “two min-
ute” noodle snacks.
Food Code Number Sodium source
- Sodium chloride
451 Pentasodium triphosphate
500 Sodium carbonates
621 Monosodium glutamate
635 Disodium ribonucleotides
The final total sodium content of the snack pack was
computed from the sodium contents and masses of the
components. Table 3 compares the manufacturer ’s stated
analysis values with those determined by TET analysis.
It is unknown how the manufacturer determines the
total average values of the products, but it may be noted
that if the sodium value for the noodle cake is subtracted
from the TET results, the TET results would have been in
much closer agreement.
Typica l titration plots for the analysis of sodium in the
compressed noodle cake and the flavour sachet are illus-
trated in Figures 2 and 3.
The inflection in the solution temperature curve de-
notes the endpoint. This is located accurately by the
second derivative of the digitally-smoothed solution tem-
perature curve. The degree of digital smoothing can be
adjusted in the titration software.
2.8. Determination of Sodium in Processed
Cheeses
Cheese products such as processed cheeses may con-
tain various sodium salts aside from sodium chloride
which are added during manufacturing in order to obtain
a product of the desired characteristics. In these cheeses,
protein, fat and water are combined into a homogenous
mass, meaning that careful attention must be given to
fully liberating sodium ion from the matrix. Grated and
sliced cheeses from a number of manufacturers were pur-
chased for the tests. Based on the anticipated sodium
content of the sample, between 2 to 5 g of grated or
finely sliced cheese was weighed into a 75 mL polypro-
pylene titration vessel. To aid in the liberation of the so-
dium, 10 mL of 300 g/L trichloroacetic acid solution was
added, together with 10 mL of deionized water. The sam-
ple was dispersed for 30 seconds at 20,000 rpm using a
high shear disintegrator. A milky fluid resulted. To pre-
vent later fouling of the titration apparatus, 5 mL of to-
luene was then added to assist in solubilizing the fat. The
sample was then subjected to another 30 seconds of dis-
integration. Finally, the disperser head was carefully
washed with approximately 10 mL of deionized water
into the titration vessel.
T. Smith, C. Haider / Journal of Agricultural C hem i stry and Environment 3 (2014) 20-25
Copyright © 2014 SciRes. OPEN ACCESS
24
Table 3. Comparison of manufacturer-stated average values
with TET-analyzed values.
Component
Na mg/100g
Nutritional
information-stated
average values (label) Found by TET
Noodle cake - 273 ± 5 (n = 8)
Beef flavour sachet - 984 ± 3 (n = 5)
Chicken flavour sachet - 1228 ± 4 (n = 5)
Total beef-flavoured
noodles 1025 1256
Total chicken-flavoured
noodles 1255 1501
Figure 2. TET titration plot-sodium in noodle cake in “two
minute” noodle snack pack.
Figure 3. TET Titration plot-sodium in flavour sachet of “two
minute” noodle snack.
At the beginning of the automated titration program, 5
mL c(NH4F) = 400 g/L solution was added. The titration
then proceeded with standardized c(Al(NO3)3) = 0.5
mol/L , c(KNO3) = 1.1 mol/L solution as titrant. Table 4
lists a comparison between the manufacturer ’s stated av -
erage values, and those found by TET.
Although the values cited by the manufacturers can be
regarded as average values only and can be expected to
Table 4. Comparison of manufacturer-stated average values
with TET-analyzed values.
Cheese sample
Na mg/100g
Nutritional
information-stated
average values (label) Found by TET
Shredded parmesan 1060 986 ± 3 (n = 5)
Shredded tasty cheese 610 732 ± 5 (n = 5)
“Light” cheese slices 600 684 ± 3 (n = 5)
“Colby” slices 668 725 ± 9 (n = 5)
vary according to the degree of process control imposed,
three of the four samples exhibited a positive bias when
analyzed by TET. The potential for interference by other
ions which form similar compounds to elpasolite NaK 2AlF6
has to be considered. Calcium is an important component
of milk products. Calcium is also known to form KCaAlF6,
an “elpasolite” type of compound. Tri- chloroacetic acid
is known to liberate calcium by its de- naturing effect on
calcium caseinate, and has been used for this purpose in
the determination of calcium in milk products. Calcium
therefore has the potential to interfere in the determina-
tion of sodium by the TET “elpasolite” method.
An experiment was set up, whereby increasing
amounts of calcium were added to a fixed amount of so-
dium, with both ion solutions dosed by precision auto-
matic burettes. Amounts of calcium (as CaCl2) ranging
from 0 to 2.5 mmol were dosed to 1.25 mmol sodium as
NaCl, and then titrated with c(Al(NO3)3) = 0.5 mol/L,
c(KNO3) = 1.1 mol/L solution after adding 2 mL concen-
trated HCl and 5 mL c( NH4F) = 400 g/L solution. Fig-
ure 3 illustrates the effect of increasing the molar ratio
[Ca]/[Na] on the error in determining the sodium content
of the solution.
It may be observed that unti l a molar ratio of [Ca]/[ Na]
of approximately 0.5 is reached, there is a negligible ef-
fect on the error in determining the sodium value. There-
after, the increase is approximately linear. To put these
results into context, the [Ca]/[Na] molar ratios for a ran-
dom selection of commercial cheeses were calculated,
based on the average values given on the packages.
These values are listed in Table 5.
By reference to Ta bl e 5 and Figure 4, it may be ob-
served that the highest [Ca]/[Na] molar ratio results in an
error in the determined value of the sodium content of
approximately 1% of that value. This is likely to be well
within the variations in the sodium value during manu-
facture, and a decision could be made to neglect this er-
ror for routi ne process control.
An analytical recovery test for the determination of
sodium in processed cheeses was performed by a col-
league working in a third laboratory. Known amounts of
T. Smith, C. Haider / Journal of Agricultural C hem i stry and Environment 3 (2014) 20-25
Copyright © 2014 SciRes. OPEN ACCESS
25
Table 5. [Ca]/[Na] molar ratios in some commercial cheeses.
Cheese Na mg/100 g Ca mg/100 g [Ca]/[Na]
Grated parmesan 1000 550 0.32
Processed “tasty” cheese 640 732 0.66
Processed “swiss” slices 470 600 0.73
Mozzarella 475 700 0.85
sodium chloride were added to a previously analyzed
sample of a spreadable cream cheese. Analytical recove-
ries ranged from 99.5% - 102.6% over seven separate
determinations, with a mean recovery of 100.0%.
2.9. Determination of Sodium in Canned
Fish Products
“Snack packs” of canned fish are a popular luncheon
choice. From a point of view of sample preparation, it is
necessary to liberate all sodium from a matrix which
possesses high protein content. In this instance, the entire
contents of a small can of fish snack were transferred to
the cup of a domestic kitchen blender which had been
rinsed with deionized water and dried. The fish product
was blended until a smooth mass was obtained, from
which no water separated. Approximately 10 g of this
homogenate was weighed into a 75 mL polypropylene
titration vessel, and 15 mL deionized water and 5 mL of
c(CCl3COOH) = 300 g/L trichloroacetic acid solution
added. The vessel contents were subjected to high shear
homogenisation at 20,000 rpm for 60 seconds. The head
of the disintegrator was carefully washed with minimum
deionized water into the titration vessel, which was then
placed in the rack of an automatic sample processor. The
automated titration program commenced with dosing of
c(NH4F) = 400 g/L ammonium fluoride solution, follow-
ed by titration with c(Al(NO3)3) = 0.5 mol/L, c(KNO3) =
1.1 mol/L solution. The results of analysis are listed in
Table 6.
3. CONCLUSION
The examples illustrated h ere are not exhaustive of the
range of the technique. Other foodstuffs which have been
successfully analyzed include dry snack foods as potato
and corn chips crackers and pretzels, sauces, soups and
marinades, as well as the sodium in the “overrun” fluid
used in the manufacture of margarine. The practical de-
tection limit of the procedure is governed by the amount
of sample which can be successfully processed and pre-
sented to the instrument for analysis, but the sodium
content of most foodstuffs lies within the ran ge of an aly-
sis. Application of the procedure also depends on the
ability to devise a suitable sample preparation procedure
to liberate the sodium from the sample matrix in such a
Table 6. Analysis of tuna fish snack for sodium by TET.
Sample
Na mg/100g
Nutritional
information-stated
average values (label) Found by TET
“Chunk-style tuna in
natural spring water” 253 236 ± 2.1 (n = 5)
Figure 4. Effect of [Ca]/[Na] molar ratio on the percent-
age error in determining the sodium content.
fashion that it can be titrated reliably. The titration itself
is robust and reliable.
ACKNOWLEDGEMENTS
The authors wish to thank Darina Mestman Rosen of Dr. Golik
Chemical Instrumentation, Israel, and Angelika Kilast of Deutsche
Metrohm GmbH & Co., KG, Germany, for kindly providing some of
the analytical results used in this paper.
REFERENCES
[1] Sen, B. (1957) Indirect complexometric titration of so-
dium and potassium with EDTA. Fresenius Zeitschrift
für Analytische Chemie, 157, 2-6.
[2] Dobbins, J.T. and Byrd, R.M. (1931) A volumetric me-
thod of determining sodium. Journal of the American
Chemical Society, 53, 3288-3291
http://dx.doi.org/10.1021/ja01360a011
[3] Carr, J.D. and Swartzfager, D.G. (1970) Complexometric
titration for the determination of sodium ion. Analytical
Chemistry, 42, 1238-1241.
http://dx.doi.org/10.1021/ac60293a025
[4] I. Saj. (1969) Magyar Kemiai Folyoirat, 75, 1-3.