P. Wilaipon / Journal of Agricultur al C hemistry and Environment 3 (2014) 1-4
Copyright © 2014 SciRes. OPEN A CCESS
drying [6]. Drying periods for the case of microwave, hot
air, and combined microwave-air drying methods were
studied. It was reported that the latter was accounted for
the shortest drying period.
The aim of this study was to evaluate the drying cha-
racteristics of combined microwave-air method for the
case of cassava. Furthermore, the mathematical model
parameters were also calculated by using regression
technique.
2. MATERIAL AND METHOD
2.1. Material
Rayong-9 cassavas with an initial moisture content of
61% on wet basis were obtained from a local factory in
Phitsanulok, Thailand. T heir initial moisture content val-
ue was examined, according to ASAE S358.2 DEC99
standard, by using a cabinet hot-air dryer (Memmert 600,
30˚C - 350˚C, 2400 W) and a digital balance (accuracy
0.001 g). Then, the material was cut into 10 mm thick
and 25 - 50 mm diameter with the cutting machine. All
cassavas used in the experiment were from the same
batch.
2.2. Drying Experiment and Data Analysis
The drying s ystem was comprised of two 86 × 43 mm
rectangular waveguides, two air-cooled magnetrons, and
a 44 × 51 × 93 cm cavity. Two 800 W-magnetrons used
in the experiments work at the frequency of 2.45 GHz.
They were installed in the waveguides mounted on the
same plane, the top of the cavity. Four heaters, 2 kW
each, were installed at the air inlet duct. A temperature
controller (Shimax MAC5D) and type K thermocouple
were utilized for temperature control purpose. In order to
record the sample weight loss, a 15 kg single-point loa d-
cell coupled to a load cell indicator (Primus CM 013)
was installed on the top of the cavity. Additionally, A
Testo 435, accuracy ±0.25˚C and ±2% RH, was used for
measuring the temperature and relative humidity of inlet
air.
In all experiments, approximately 2.5 kg of samples
were used. The samples were uniformly spread on a dry-
ing tray and placed in the drying cavity. The temperature
and velocity of hot air were set at 60 ˚C and 1 m/s respec-
tively. A temperature sensor was utilized for measuring
surface temperature of the sample. It was used as an in-
put for microwave power operation control. The experi-
ments were investigated at two levels of sample temper-
ature viz. 70˚C and 80˚C respectively.
The values of moisture ratio were calculated using the
following equation:
(1)
where :
MR is the moisture ratio;
Mt is the moisture content at 1 hour (%);
Me is the equilibrium moisture content (%);
Mi is the initial moisture content (%).
Several conventional drying models have been pro-
posed for determining the moisture ratio as a function of
drying time. In this research, the drying models of cas-
sava drying by using 2 planes magnetron microwave-air
drying system were investigated. Newton model [7],
Page’s model [8], logarithmic model [9], Henderson &
Pabis model [10], and diffusion model [3] were applied
to describe the characteristics of cassava drying.
(2)
(3)
(4)
(5)
() ()() ()
MRa expkt1aexpktb=− +−−
(6)
where :
k is the drying constant;
n is the power parameter;
a and b are parameters;
t is drying time (hour).
Coefficient of determination (R2), adjusted coefficient
of determination
, and standard error of esti-
mation (SEE) were utilized to evaluate the goodness of
fit of the tested drying models to the experimental data.
3. RESULT AND DISCUSSION
Effective mathematical model of drying characteristic
is crucial for cassava microwave-air drying kinetics in-
vestigation. The combination of microwave and hot-air
energy were able to reduce the sample moisture content
from 61% to 8% db in 300 - 340 minutes depending on
the levels of sample temperature set point. It was found
that as the set-point temperature increased, the drying
time was decreased. By using non-linear regression tech-
nique, the drying constants and coefficients of the five
models obtained are shown in Table 1.
In order to evaluate goodness of fit, coefficient of de-
termination (R2), adjusted coefficient of determination
, and standard error of estimation (SEE) were
also computed. The goodness of fit was determined by
the higher R2 and
values as well as the lower
SEE values. For all cases, it was found that R2 and
values were higher than 0.98, and SEE values
were lower than 0.029.
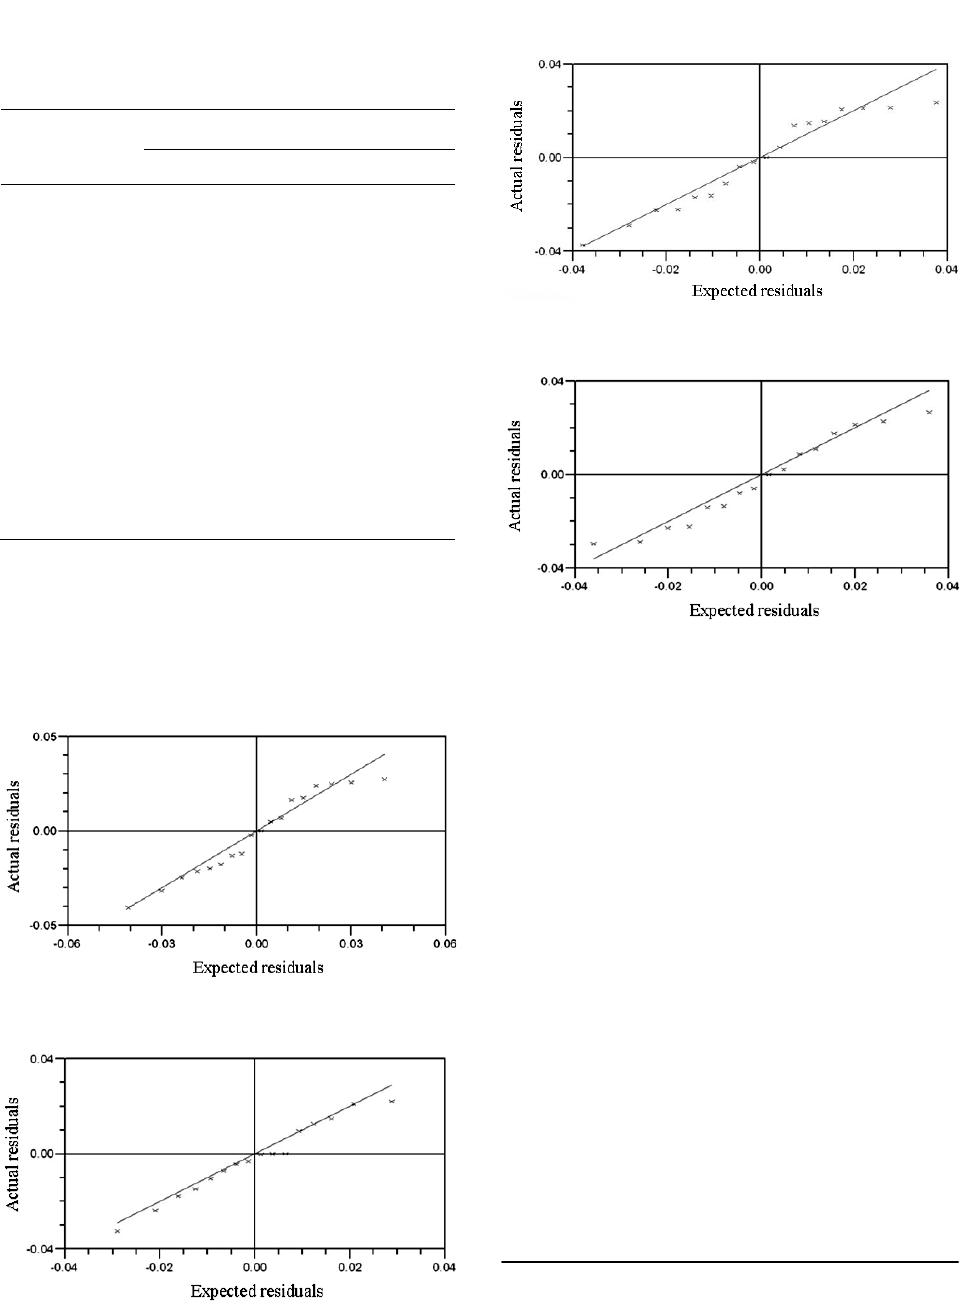
Furthermore, it was found that diffusion and Page’s
models gave the excellent fit results for all the experi-
mental data. For the case of diffusion model regression,
the values of R2,
and SEE for 70˚C - 80˚C set-