Journal of Geoscience and Environment Protection
2014. Vol.2, No.1, 1-5
Published Online Januray 2014 in SciRes (http://www.scirp.org/journal/gep) http://dx.doi.org/10.4236/gep.2014.21001
OPEN ACCESS
1
Effectiveness of Improved Cookstoves to Reduce Indoor Air
Pollution in Developing Countries. The Case of the
Cassamance Natural Subregion, Western Africa
Candela de la Sota, Julio Lumbreras, Javier Mazorra*, Adolfo Narros,
Luz Fernández, Rafael Borge
Department of Chemical and Environmental Engineering, Technical University of Madrid (UPM), Spain
Email: *javimazorra@gmail.com
Received October 2013
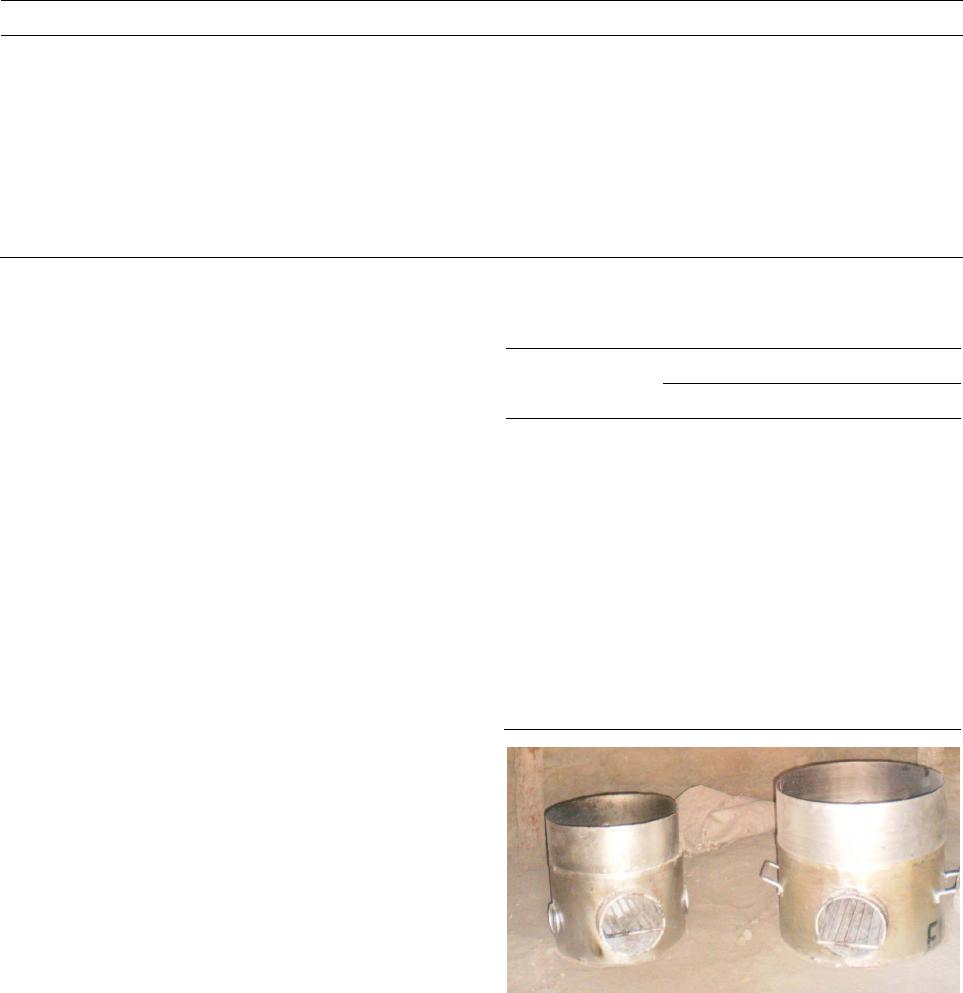
The Spanish NGO “Alianza por la Solidaridad” has installed improved cookstoves in 3000 households
during 2012 and 2013 to improve energy efficiency reducing fuelwood consumption and to improve in-
door air quality. The type of cookstoves were Noflaye Jeeg and Noflaye Jaboot and were installed in the
Cassamance Natural Subregion covering part of Senegal, The Gambia and Guinea-Bissau. The Technical
University of Madrid (UPM) has conducted a field study on a sample of these households to assess the
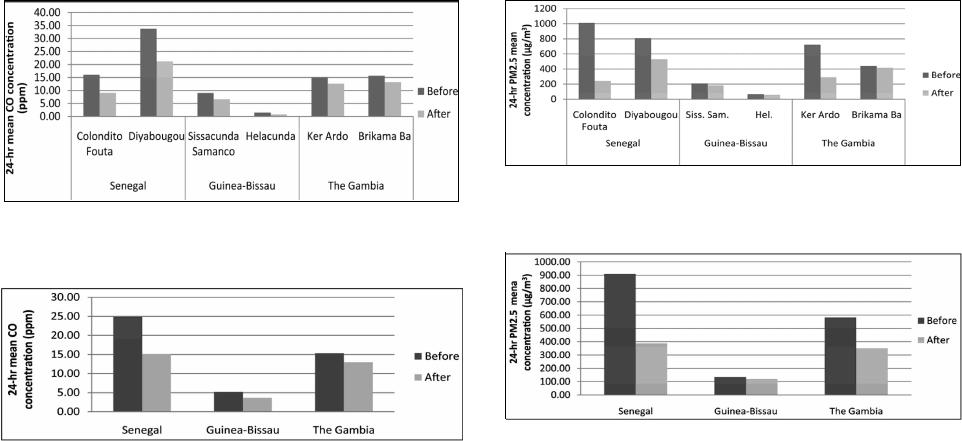
effect of improved cookstoves on kitchen air quality. Measurements of carbon monoxide (CO) and fine
particle matter (PM2.5) were taken for 24-hr period before and after the installation of improved cook-
stoves. The 24-hr mean CO concentrations were lower than the World Health Organization (WHO)
guidelines for Guinea-Bissau but higher for Senegal and Gambia, even after the installation of improved
cookstoves. As for PM2.5 concentrations, 24-hr mean were always higher than these guidelines. However,
improved cookstoves produced significant reductions on 24-hr mean CO and PM2.5 concentrations in
Senegal and for mean and maximum PM2.5 concentration on Gambia. Although this variability needs to
be explained by further research to determine which other factors could affect indoor air pollution, the
study provided a better understanding of the problem and envisaged alternatives to be implemented in fu-
ture phases of the NGO project.
Keywords: Indoor Air Pollution; Improved Cookstoves; Biomass Burning; Health Effects; Western Africa
Introduction
According to the International Energy Agency 2.7 billion
people (40% of global population) rely on the traditional use of
biomass for cooking (IEA, 2010). The traditional use of bio-
mass refers to the basic technology used, such as three-stone
fire or inefficient cookstove, and not the resource itself.
As a result of the incomplete combustion due to inefficient
conditions, many pollutants are emitted, both gaseous and solid
or liquid. The major compounds are: carbon monoxide (CO),
particulate matter (PM), nitrogen dioxide (NO2) and other or-
ganic compounds.
The exposure to these pollutants during long periods of time
has a wide range of health effects causing around 1.5 million
premature deaths per year worldwide, being the second leading
cause of death in developing countries today and the first by
2030 (IEA, 2010).
Up to date, numerous studies have pointed out the relation-
ship between the exposure to indoor air pollution (IAP) and
several health problems (WHO, 2006). There is scientific evi-
dence that risk of pneumonia and acute infection of the lower
respiratory tract among children under five years old and risk of
suffering from chronic obstructive pulmonary disease in adult
women are bigger in households where wood or coal is used for
cooking activities than in those where electricity, gas or other
cleaner fuels are used (WHO, 2006). Other problems such as
eye diseases and burns are likewise extended.
In these households, pollutant levels can be between 10 and
50 times higher than the standard set by the World Health Or-
ganization (WHO) for CO and PM (shown in Table 1).
Case Study
The Casamance Natural Subregion in Western Africa is lo-
cated between three countries: Senegal, The Gambia and Gui-
nea-Bissau, forming an interdependent system with common
geographical and ethnic characteristics. The subregion also
shares a high level of poverty, analphabetism and malnutrition,
which specially affect women.
This situation contrasts with the great potential of natural and
productive resources. However, the unequal distribution of
these resources produces several difficulties for the subregion
inhabitants. Even more, the pressure over natural resources is
increasing due to climate change and food-related products
competence (for biofuel production, timber and other crops).
Within this context, the Spanish NGO “Alianza por la Soli-
daridad” is carrying out a 4-year project with the aim of contri-
buting to poverty aleviation and improvement of living stan-
dards in the Casamance Natural Subregion and promoting food
sovereignty and environmental governance.
Among several areas of work, there is one focused on the
improvement of energy efficiency at both the family and the
community sphere through the change from three-stone stoves
*Corresponding author.
C. DE LA SOTA ET AL.
OPEN ACCESS
2
Table 1.
WHO guidelines values set for pollutants.
Pollutan t Observed effect Guideline value
CO* Decrease in exercise tolerance and increase symptoms in people with ischemic heart problems.
15 min. mean—100 mg/m3
1 hr. mean—35 mg/m3
8 hr. mean—10 mg/m3
24 hr. mean—7 mg/m3
**PM Effects on respiratory and cardiovascular systems.
PM2.5: Annual mean—10 μg/m3
24 hr. mean—25 μg/m3
PM10: Annual mean—20 μg/m3
24 hr. mean—50 μg/m3
NO2* Respiratory symptoms, bronchoconstriction, increased bronchial reactivity,
respiratory tract inflammation, increased susceptibility to respiratory inflammation. 1hr. Mean—200 μg/m3
Annual mean—40 μg/m3
Note: Source: (WHO, 2010)* and (WHO, 2005)**.
to improved cookstoves. The main aim of this activity is to
achieve a reduction on fuelwood consumption, collection time
and indoor air pollution related to the traditional use of bio-
mass.
During 2012 and 2013, the work area was geographically li-
mited to rural communities of Kerawane and Wassadou in Se-
negal, the Pirada Sector in Guinea-Bissau and Samba Sira Dis-
trict in The Gambia. After a participatory process, it was de-
cided to install two improved cookstoves in each household, the
Noflaye Jeeg and Noflaye Jaboot stoves (Figure 1). These
stoves do not include a chimney and they are locally produced
adapting the Rocket Stove model. During this period, improved
cookstoves were installed in 3000 households.
Methodology
Study Design
Measurements presented in this study were obtained between
January 2013 and March 2013 in households of 6 rural villages,
two in each country, using a “before and after” design as it
requires smallest sample size and it reduces variability because
same households are used (Edwards, R. et al., 2007). In order to
quantify seasonal effects independently from the impact of the
improved cookstove is necessary to do a “before and after with
control” design (Edwards, R. et al., 2007), but due to great va-
riability in kitchen characteristics and ventilation and the ne-
cessity of larger sample, it was chosen to do the study without a
control group (according to Dutta, K. et al., 2007). To avoid
this problem, all the measurement, before and after the stove
installation, were done during the same season and climatic
conditions (Edwards, R. et al., 2007), in this case the dry season.
Participating households were selected in cooperation with the
local team and with previous information from the NGO. The
number of household selected in each village is shown in Table
2.
Indoor Air Pollution Monitoring
IAP was determined by continuous measurements of carbon
monoxide (CO) and fine particulate matter (PM2.5) concentra-
tions in each kitchen for a 24-hour period before and after the
installation of the improved cookstoves.
Monitoring equipments were selected based on the following
criteria: portability, autonomy and capability of long-time data
storage. These characteristics are necessary to obtain valid re-
Table 2.
Number of participating household in each village.
Village N˚ of Households
Before After
Senegal
Colondito Fouta 11 27
Diyabougou 22 22
Guinea-Bissau
Sissaucunda Samanco 11 26
Helacunda 11 11
The Gambia
Brik ama -Ba 40 40
Ker Ardo 54 49
Figure 1.
Noflaye Jegg (left) and Noflaye Jaboot (rigth) stoves.
sults in this type of studies (Bates, L. et al., 2005; MacCarty, N.
et al., 2008; Chowdury, Z. et al., 2012). According to this, CO
measurements were made with the EL-USB-CO monitor (Las-
car Electronics Ltd., UK), that uses an electrochemical sensor
while PM2.5 was monitored with IAP Meter 5000 Series
(Aprovecho Research Center, OR, USA) applying a light scat-
tering technique. Both of them included a data logger to store
minutal data during all the measurement period.
EL-USB-CO monitors were placed 1 m away from the com-
C. DE LA SOTA ET AL.
OPEN ACCESS
3
bustion zone and 1.45 m high and IAP Meter 5000 Series mon-
itors 1.3 m away from the combustion side and 1.3 m high, both
on the side of the stove opposite to open doors and windows
(Bates, L. et al., 2005; MacCarty, N. et al., 2008). Standard
protocols were followed to perform each measurement (Bails,
R. et al., 2007; Smith, K.R. et al., 2007).
Household Questionnaires
In each household selected for the study a survey was made
by the field team before and after the stove change using a
common questionnaire which was translated to every local
language. People interviewed were women on charge of cook-
ing activities and head of households.
The information collected was about social and economic
factors, family characteristics, woodfuel use, stove use, cooking
patterns and habits along with factors that could affect pollu-
tants concentration during the measurement period.
Together with this questionnaire, physical data such as kit-
chen shape and size, ventilation, number and size of doors and
windows, amount and size of woodfuel used, were taken.
Results and discussion
Pollutant concentrations, as 24-hr mean and maximum for
CO and PM2.5, before and after the installation of improved
cookstoves including the percent change for each village and
the country average, are shown in Tables 3 and 4.
CO Concentration
CO measurements show that 24-hr mean concentrations are
higher than WHO guideline values in Senegal and Gambia, and
lower in Guinea-Bissau (except for Sissacunda Samanco before
the installation).
Figures 2 and 3 show the graphical representation conclud-
Table 3.
24-hr mean and maximum CO concentration (ppm) before and after installation of improved cookstoves.
Before After 24-hr mean
percent change
Maximum percent
change
Mean SD Maximum Mean SD Maximum
Senegal
Colondito Fouta 16.00 11.56 170.00 9.04 7.04 149.78 29.38** 7.14
Diyabougou 33.79 18.57 210.57 21.20 11.77 193.53 37.26** 8.09
Average 24.90 18.45 190.28 15.12 11.05 171.65 33.32** 0.48
Guinea-Bissau
Sissaucunda Samanco 8.98 4.14 95.77 6.60* 4.90 101.86 43.16 22.59
Helacunda 1.43* 1.87 48.23 0.77* 1.73 35.00 46.35 27.43
Average 5.21* 4.97 72.00 3.68* 3.92 68.43 46.35 27.43
The Gambia
Ker Ardo 14.9 8.91 191.38 12.63 11.27 179.09 15.24 16.10
Brikama Ba 15.69 10.79 169.7 13.26 10.54 197.06 15.48 6.86
Average 15.29 9.99 174.42 12.95 11.04 194.22 15.48 11.48
Note: *Lower than WHO guideline value. **Significant reduction (p < 0.05).
Table 4.
24-hr mean and maximum PM2.5 concentration (μg/m3) before and after installation of improved cookstoves.
Before After 24-hr mean
percent change
Maximum percent
change
Mean SD Maximum Mean SD Maximum
Senegal
Colondito Fouta 1010 - 66091.00 241.67 170.6 34478.78 39.60** 36.06
Diyabougou 809.50 404.7 42321.10 531.7 333.7 54269.22 34.32** 28.23
Average 909.75 388.6 54206.05 386.67 293.4 44374.00 36.96** 3.91
GuineaBissau
Sissaucunda Samanco 207.5 96.9 34566.50 182.00 180.5 46185.00 133.49 93.93
Helacunda 62.00 1.4 6937.00 57.10 71.2 8965.40 30.65 8.15
Average 134.75 107.9 20751.75 119.55 148.1 27575.20 51.42 42.89
The Gambia
Ker Ardo 725.50 485.1 74223.50 288.20 289.8 43919.60 60.28** 40.83**
Brikama Ba 439.30 333.7 45946.70 415.6 312.0 39264.80 5.39 14.54
Average 582.40 431.0 60085.10 351.90 300.3 41592.20 32.84 27.69
Note: *Lower than WHO guideline value. **Significant reduction (p < 0.05).
C. DE LA SOTA ET AL.
OPEN ACCESS
4
Figure 2.
24-hour mean CO concentrations before and after the instalattion of the
improved cookstove in each village.
Figure 3.
24-hour mean CO concentrations before and after the instalattion of the
improved cookstove country averages.
ing that:
The highest 24-hr mean CO concentration was observed in
Diyabougou. This result could be explained by the higher
wood consumption due to a higher family size.
The lowest 24-hr mean CO concentration was obtained in
Guinea-Bissau due to a better kitchen ventilation
There are no significant differences between Colondito
Fouta with Gambians villages.
The lowest maximum concentrations were observed in
Guinea-Bissau while no differences between Gambia and
Senegal were identified.
Concerning CO concentration variations between before and
after:
A significant reduction (p < 0.05) for 24-hr mean CO con-
centration was observed in Senegal although they are not
enough to accomplish with WHO guideline values.
In Guinea-Bissau, the highest reductions in percentage of
24-hr mean CO concentration were measured although
these reductions are low in absolute terms with no statistical
significance.
In Gambia, where 24-hr mean CO concentration were simi-
lar to Senegal, a lower reduction was obtained and with no
statistical significance.
A great variability on maximum concentrations was ob-
served with no significant reduction anywhere.
PM2.5 Concentration
PM2.5 measurements showed that 24-hr mean concentrations
are higher than WHO guideline values in all villages and coun-
tries.
Graphical representation of results (Figures 4 and 5), shows:
24-hr mean PM2.5 concentrations were bigger in Senegal
than in the other countries. It was also observed that Diya-
bougou have a similar result to Colondito Fouta, contrarily
to 24-hr mean CO values.
In Guinea-Bissau, 24-hr mean PM2.5 concentrations were
Figure 4.
24-hour mean PM2.5 concentrations before and after the instalattion of
the improved cookstove in each village.
Figure 5.
24-hour mean PM2.5 concentrations before and after the instalattion of
the improved cookstove country average.
lower than in other villages and countries, as occurred for
24-hr mean CO values due to higher ventilations.
In Gambia, results showed that concentration in Ker Ardo
was quite bigger than in Brikama Ba before the installation
but with improved cookstoves, results were the opposite.
The maximum concentration before installation was ob-
served in Ker Ardo maybe linked to the use of alternative
fuels as plastics or crop and livestock wastes due the wood
fuel scarcity.
In Helacunda maximum concentration was lower because in
this village is usual to cook outside during the dry season.
In Table 4, changes between before and after the installation
showed a great variability within three countries:
As in the case of CO concentration, a significant reduction
(p < 0.05) is observed for 24-hr mean PM2.5 concentration
in Senegal although they are not enough to accomplish with
WHO guidelines.
In Guinea-Bissau, reductions were not statistically signifi-
cant.
In Gambia, a significant reduction (p < 0.05) was found for
24-hr mean PM2.5 concentration in Ker Ardo but no signi-
ficance was observed for Brikama Ba. Ker Ardo results
could be explained by the reduction in the use of alternative
fuels with improved cookstoves .
In Ker Ardo, a significant reduction (p < 0.05) for the
maximum PM2.5 concentration was also identified.
In other villages, maximum concentrations did not show
significant reductions.
Conclusion
Concerning potential health problems associated to 24-hr
mean CO concentrations, only Guinea-Bissau values were low-
er than the WHO guidelines, both before and after the cooks-
tove implementation. For Senegal and Gambia, concentrations
were higher, even using improved cookstoves. As for 24-hr
C. DE LA SOTA ET AL.
OPEN ACCESS
5
mean PM2.5 concentrations, they were higher than WHO guide-
lines for all cases.
Improved cookstoves installation produced significant reduc-
tion in Senegal for 24-hr mean CO and PM2.5 concentration and
in one of the Gambia’s locations for 24-hr mean and maximum
PM2.5 concentration. However, no significant reductions were
observed for Guinea Bissau. This variability is usual in pro-
grams implementing improved cookstoves without chimney.
Although the same stoves are used in each village, it has
been obtained a wide range of results. Further research is
needed to determine which other factors could affect pollutant
concentration inside kitchens as type of fuel used for cooking,
woodfuel consumption, kitchen shape and size, and ventilation.
REFERENCES
Bailis, R., Berrueta, V., Chengappa, C., Dutta, K., Edwards, R., Masera,
O. et al. (2007). Performance testing for monitoring improved bio-
mass stove interventions: Experiences of the Household Energy and
Health Project. Energy for Sustainable Development, 11, 57-70.
http://dx.doi.org/10.1016/S0973-0826(08)60400-7
Bates, L., Bruce, N., Theuri, D., Owala, H., Hada, J., Hood, A. et al.
(2005). Smoke, health and household energy. Volume 1: Participa-
tory methods for design, installation, monitoring and assessment of
smoke alleviation technologies. ITDG/Practical Action.
Chowdury, Z., Le, L. T., Al Masud, A., Chang, K. C., Alauddin, M.,
Hossain, M. et al. (2012). Quantification of indoor air pollution from
using cookstoves and estimation of its health effects on adult women
in northwest Bangladesh. Aerosol and Air Quality Research, 12, 463-
475.
Dutta, K., Shields, N. K., Edwards, R., & Smith, K. R. (2007). Impact
of improved biomass cookstoves on indoor air quality near Pune, In-
dia. Energy for Sustainable Development, 11, 19-32.
http://dx.doi.org/10.1016/S0973-0826(08)60397-X
Edwards, R., Hubbard, A., Khalakdina, A., Pennise, D., & Smith, K. R.
(2007). Design considerations for field studies of changes in indoor
air pollution due to improved stoves. Energy for Sustainable Devel-
opment, 11, 71-81.
http://dx.doi.org/10.1016/S0973-0826(08)60401-9
IEA (2010). World energy outlook 2010, energy poverty. How to make
modern energy access universal? International Energy Agency.
MacCarty, N., Still, D., Ogle, D., & Drouin, T. (2008). Assessing cook
stove performance: Field and lab studies of three rocket stoves com-
paring the open fire and traditional stoves in tamil nadu, india on
measures of time to cook, fuel use, total emissions, and indoor air
pollution. Aprovecho Research Center.
Smith, K. R., Dutta, K., Chengappa, C., Gusain, P. P. S., Masera, O.,
Berrueta, V. et al. (2007). Monitoring and evaluation of improved
biomass cookstove programs for indoor air quality and stove perfor-
mance: conclusions from the Household Energy and Health Project.
Energy for Sustainable Development, 11, 5-18.
http://dx.doi.org/10.1016/S0973-0826(08)60396-8
WHO (2005). Air Quality guidelines global update 2005. World Health
Organization.
WHO (2006). Fuel for life. Household energy and health. World Health
Organization.
WHO (2010). WHO guidelines for indoor air quality: Selected pollut-
ants. World Health Organization.