 Journal of Environmental Protection, 2011, 2, 21-36 doi:10.4236/jep.2011.21003 Published Online March 2011 (http://www.SciRP.org/journal/jep) Copyright © 2011 SciRes. JEP 21 Ambient Air Non-Methane Volatile Organic Compound (NMVOC) Study Initiatives in India - a Review Amrita Talapatra, Anjali Srivastava NEERI, Kolkata Zonal Laboratory, I-8, Sector ‘C’, East Kolkata Area Development Project, Kolkata, India. Email: talapatra_amrita@yahoo.co.in Received September 14th, 2010; revised November 8th, 2010; accepted December 23rd, 2011. ABSTRACT Different aspects of Volatile Organic Compounds (VOCs) are being investiga ted in details by different research groups in Indian institutes. The spectrum covers measuring technologies, source apportionment and variability studies, all these are in due process of preparing a guideline for the sustainable development in terms of industrial, infrastructu ral as well as overall growth of the country. Both the outdoor and indoor air quality has significant impact on human health. With special concentration on BTEX and HAPs, the health related investigations are conducted as part of inter- disciplinary studies o f environmental science. Newer technologies to remove VOCs under specific industria l and prac- tical conditio ns are getting emerged a s a compa ratively new era . It addresses field s like ad sorption, conden sation, per- vaporation, biodegradation and catalytic combustion. Besides, different kinds of biofilters have drawn significant atten- tion nowadays. The final selection of appropriate technology depends on type and concentrations of VOCs, extent of separation required and cost involved. All these technologies are although well studied, but could not be adopted for regular commercial usage till da te. There is scope to explore new horizons as well as regular monitoring on the intro- duced pathways to limit VOC emission in the ambient air. This review aims at a concise discussion on all the areas that come under the umbrella of non-methane VOC technologies. Keywords: VOC, India, BTEX, HAP, Biofilters, Catalytic Combustion 1. Introduction Volatile organic compounds (VOC) are ubiquitous at- mospheric species of both natural and anthropogenic sources. These are wide range of chemicals including aliphatic and aromatic hydrocarbons, alcohols, aldehydes, ketones, esters and halogenated compounds sharing the same characteristics of high volatility in the ambient en- vironment and result in alteration of the chemistry of atmosphere. On the global scale natural emissions of nonmethane hydrocarbons (NMHCs) and VOCs exceed anthropogenic emissions. Among the natural sources, vegetation is the dominant source. Oceanic and microbial production of these species is minimal as compared to other sources of input. On the other hand, anthropogenic sources are the result of urbanization and industrializa- tion. This rapid urbanization and industrialization, at some places in a most unorganized way, is the general picture in developing countries around the world. The main concern of VOCs is the role they play in the forma- tion of ozone and photochemical smog and increased risk of cancer. Thereby it is quite evident that although in rural areas natural vegetation causes VOC emission, due to lower NOx concentration, O3 production is less; which is not the case in urban atmosphere, where due to the industrial and vehicular pollution the relative concentra- tion of NOx reaches up to a level so that it easily contrib- utes to production of O3 even in small concentration of NMHCs. In polluted areas with relatively high concen- tration of NOx, photochemical oxidants of NMHCs, initi- ate a complex series of photochemical reactions that lead to the production of O3 and other secondary oxidant pol- lutants [1]. The emission of VOCs thus have much more detrimental effect in urban areas and the percentage con- centration of VOCs in ambient air, their source profile identification and effect on health due to exposure should be well understood to undertake a successful planning of metropolis or establishment of industrial belt. India being a leading giant among developing coun-  Ambient Air Non-Methane Volatile Organic Compound (NMVOC) Study Initiatives in India - a Review 22 tries, huge pressure from different domestic and interna- tional forums is put on to formulate rules and regulations towards VOC control along with many other ecofriendly footsteps. Considering the global scenario, not even EPA proposed any standard for ambient VOCs. But the US Occupational Safety and Health Administration (OSHA) and World Health Organization have come up with some guidelines for these air pollutants, but these are recom- mendations and not compulsory for governments to fol- low [2]. Although started late, but from last decade in Indian continent, several initiatives, largely in academic sector have taken place regarding measurement and con- trol of VOCs. This review is meant to accommodate the various areas of published work from Indian Institutes based on VOCs monitoring in Indian cities. 2. National Level Regulations Central Pollution Control Board India has regulated Benzene and Benzo(a)Pyrene by including them in Na- tional Ambient Air Quality Standard since November 2009. Standards for Benzene and Benzo(a)Pyrene are mentioned in Table 1. Corresponding vehicular exhaust norms and auto fuel quality specifications also have been put forward to im- pose certain restrictions. Vehicular exhaust norms are in effect from 1991 and the current scenario specifies com- bined value for hydrocarbon and NOx to be respectively 0.35 and 0.18 g/km for Bharat Stage III and IV passenger cars, whereas the values are 1.5 and 1.0 for 2/3 wheelers (Bharat Stage II and III respectively). Heavy Diesel ve- hicles are allowed upto 1.1, 1.6 and 0.96 g/km hr of hy- drocarbons for Bharat stage II, III and IV respectively. Maximum permissible amount of benzene in gasoline has been specified to be 1% by volume in the year 2010 con- siderably lowering it from 5% in the year 1996. 3. Monitoring and Measurement of VOCs Air quality monitoring requires detection in a very low concentration (ppb range) for several types of VOCs. This necessitates sufficient sensitivity to trap the com- pounds of interest for subsequent analysis using appro- priate chromatographic technique [3]. Generally two ba- sic principles are being followed e.g., active sampling that includes pumping of controlled air flow into the sampler for a specific sampling period and thereafter air drawn-in is passed through the adsorbent for adsorption of pollutant being monitored; whereas passive sampling is dependent on diffusion of pollutant from bulk air to the adsorbent directly. Therefore the ideal adsorbents ex- pected to possess characteristics like large accessible pore volume, no catalytic activity, hydrophobicity, high thermal and hydrothermal stability and easy regeneration properties. In general, the research papers have men- tioned activated charcoal as the adsorbing media, al- though there have been considerable studies towards cost effective alternative new materials like surface modified zeolites, product synthesized from fly-ash [3-5]. Target VOCs specified in USEPA Compendium method TO-14 or TO-17 were generally monitored using adsorption, thermal desorption and subsequent analysis on GC-MS or GC-FID [5-7]. 4. Ambient Air Concentration of VOCs 4.1. Anthropogenic Sources For assessing anthropogenic sources of VOCs, urban atmosphere is the target environment because of high level of pollution. In India the capital city Delhi and three other metropolitan cities like Mumbai, Chennai and Kolkata are therefore the natural selection in almost all the cases. Large population necessitating highways, busy traffic network and thereby refueling stations, high rise office, residential and commercial complexes forbidding easy air passage and nearby industrial hubs keep on add- ing versatile sources of VOCs in these cities. Being situ- ated at different geographical locations the cities as a whole represent the generic atmospheric pattern of the country. Table 1. National ambient air quality standard. Concentrations in ambient aira Pollutant Industrial, Residential, Rural and Other Area Ecologically Sensitive Area (notified by Central Government)Methods of Measurement Benzene (C6H6) µg/m3 5 5 -Gas chromatography based continuous analyzer -Adsorption and Desorption followed by GC analysis Benzo(a)Pyrene (BaP)-particulate phase only, ng/m3 1 1 -Solvent Extraction followed by HPLC/GC analysis aT ime weighted Average-Annual. Copyright © 2011 SciRes. JEP  Ambient Air Non-Methane Volatile Organic Compound (NMVOC) Study Initiatives in India - a Review23 Kolkata: The Kolkata metropolitan area is a mega city of 1246 km2 with a high vehicle density (5685 per km2). In December 2002, the number of vehi- cles registered with the Public Vehicles Depart- ment was about 0.8 million, with 40 000-50 000 vehicles being added each year (Asian Develop- ment Bank, 2005); In terms of traffic, local vehi- cles are supplemented by those coming from sub- urbs. To service the fleet, a large number of work- ers are associated with fueling [8]. Delhi: Delhi, the National Capital Territory of In- dia, has a geographic area of 1483 km2 stretched in east–west width approximately 51.9 km and north- west width approximately 48.48 km with a popula- tion 13.79 million. Delhi is situated at latitude of 28˚24′ 17″ to 28˚53 and the longitude of 76˚20′37″ to 77˚20′37″ with an altitude of 216 m above mean sea level in the semi-arid zone of India. To the north the Himalayas are at a distance of just 160 km and to the south are the central hot plains. To the west of Delhi is the Great Indian Desert (The Thar) of Rajasthan and cooler hilly regions to the northeast. The climate of Delhi is mainly influ- enced by its inland position and the prevalence of continental air during the major part of the year. Extreme dryness with an intensively hot summer and cold winter are the main characteristics of the climate. The mean annual rainfall in Delhi is 71.5 mm. About 81% of the annual rainfall is received during the monsoon months. January is the coldest month with the mean daily maximum temperature at 21.3˚C and mean daily minimum at 7.3˚C. May and June are the hottest months with temperatures touching 46 - 47˚C. The average annual tempera- ture ranges between 22˚C and 25˚C. The air in Delhi is dry for most of the year, with very low relative humidity from April to June and markedly higher humidity in July and August, when weather conditions are oppressive. Temperature inversions are common in winter [5,6,9,10]. Mumbai: Mumbai is located at the coast of Arabian Sea on the West coast of India. Mumbai is one of the largest metropolitan cities of the World with its population of approximately 12 million in 2001. Mumbai is also one of the fast developing me- tropolises with variety of activities, viz. commer- cial, residential, industrial, port activity, etc. The total number of registered vehicles in 2001 is about 10,29,563. Two wheelers form a major portion of vehicular population, followed by cars and jeeps. Mumbai is hub of commercial and industrial activ- ity. It is a port town. Mumbai has a tropical sa- vanna climate with relative humidity ranging be- tween 57% and 87%, and annual average tempera- ture of 25.3˚C, with a maximum of 34.5˚C in June and minimum of 14.3˚C in January. The average annual precipitation is 2078 mm, with 34% of total rainfall occurring in July. The prevailing wind di- rections are from West and northwest, with West and southwest shifts during monsoon. Some east- erly component is observed during winter [7,11]. Although parts of the cities are planned, in maximum areas there is no clear distinction of sectors like residen- tial or industrial and thus generating complex air shed profile. Again petrol pumps situated nearby the roads add up evaporative emission to exhaustive emission. Cer- tainly all these emissions pollute indoor air also. Thereby the traditional monitoring system divides the localities in specific zones but the source profiles can never be com- pletely separated according to different activity centers. In recent years ambient air quality in these cities has been thoroughly studied by different research groups, but the subsequent source apportionment studies reveal the emission nature of the cities more specifically [9,10]. 4.2. Source Profile Identification and Analysis Rapid economic and urban population growths have triggered a series of challenges to the endeavors of maintaining the clean air [11]. New pollutants are being increasingly recognized and point to sources, which are of inevitable use in day-to-day modern life. Air pollution sources have grown and so also the pollutants. In order to devise effective air quality management programmes to control VOCs, it is necessary to know the sources of VOCs in the region of concern. Receptor models assess contributions from various sources based on observations at sampling sites. Chemical mass balance (CMB) recep- tor model have been used to apportion different fractions of VOCs in several urban areas. Principal component analysis (PCA or factor analysis), multiple linear regres- sion analysis (MLR) and all other approaches are based on fundamental mass balance concept. CMB modeling approach using multiple linear least squares regressions was used to identify the probable sources of VOCs. The foremost step to apply CMB is to judge the applicability of the model to the study with regard to source composi- tions being constant over a period of sampling. In a com- plex urban airshed, some source profiles were collinear with the measured species. This leads to the average ab- solute errors of approximately 30% even when coeffi- cients of variations in source profiles reached 50%. Within last five years, study on source apportionment of major cities of India has been performed with special focus on petrol retail distribution centers. The broad per- spectives of the cities are clearly understood from the findings. Copyright © 2011 SciRes. JEP  Ambient Air Non-Methane Volatile Organic Compound (NMVOC) Study Initiatives in India - a Review 24 Evaporative emissions dominate in Mumbai [12]. Oceanic emissions also contribute significantly to TVOCs in Mumbai. Sources other than exhaust of petrol driven vehicles, contribute to a large extent to benzene concentration in ambient air. Abnor- mally higher B/T (concentration ratio between benzene and toluene) of 11.74 at petrol pumps in- dicates adulteration of fuels as well. The presence of chlorinated compounds in Mumbai may be attributed to emissions from the sea. The concen- trations of C6-C10 hydrocarbons were more than that for C2-C5 at the industrial sites whereas C2-C5 hydrocar- bons were more at refineries [13]. Emissions from diesel internal combustion engine were found to be a dominating source of VOCs in ambient air of Delhi ranging between 26 to 54% [14]. Large number of diesel generator sets is used in Delhi in residential, commercial and industrial areas as a backup to power supply. But showing effect of intervention in use of petroleum and diesel fuel and shift to CNG, benzene emission reported is comparatively low in Delhi. Sludge emissions consist of emission from sewage treatment plants and open defecation is detected in both the cities as these are common practice in everywhere in India. Vehicular exhaust emissions from adjacent road- ways are the greatest contributor (39.0 ± 15.7%) in Kolkata petrol pumps situated on the curbside of busy roads with high traffic density [8]. Contribu- tions of exhaust from light duty diesel driven, as well as petrol vehicles, (the majority of the petrol driven light duty vehicles were without catalytic converters), also contributed significant amounts of VOCs (10.3 ± 5.2% and 6.5 ± 6.4%, respectively) around the petrol pumps. In general, in all these three metro cities other sources like automotive refinishing, repairing and washing ser- vice facilities in the adjoining garages inside the petrol pump premises, petrol spilled during refueling, automo- tive painting, repairing works, degreasing, fugitive emis- sions from the petrol storage facilities, automotive con- sumer products, automotive tyres been recognized. Compiling from different sources the emission pattern of these 3 cities can be summarized as in Table 2. 4.3. Indoor VOC Studies Studies on indoor pollution are important since an aver- age person spends more than 80% of the daytime in the indoor environment either in the home or in the work place [19]. The poor quality of indoor air has been linked to a number of symptoms, which the World Health Or- ganization has defined as Sick Building. These symp- toms include headache, nausea, irritation of the eyes, mucous membranes and the respiratory system, drowsi- ness, fatigue and general malaise. Poor air quality in of- fice premises produces discomfort, decreases worker’s efficiency and increases absenteeism. Conversely, im- proved air quality can lead to improved productivity. Among the Volatile Organic Compounds VOCs, benzene is confirmed as a human carcinogen. The other VOCs, such as hexane, heptane and octane can affect the central nervous system. Therefore, the studies related to indoor air pollution due to VOCs are of significance as they are directly related to the health of human beings in day-to- day life. The main sources of VOCs in the indoor environment are building materials, furnishing, cleaning compounds, dry cleaning agents, paints, varnishes, glues, aerosol propellants, refrigerants, fungicides, germicides, cosmet- ics and textiles. Human activities such as cooking, cleaning and smoking also contribute to VOCs in the indoor environment. Many workers have carried out studies on VOCs in indoor air in residences and office premises and concentrations of VOCs have been found to vary widely from place to place. Besides indoor sources, industrial emissions, exhaust from vehicles driven on diesel and gasoline are some of the anthropogenic sources of VOCs in the outdoor environment which con- tribute to indoor VOCs; it has been observed that the rate of indoor pollution was affected by the direction of wind. Methods for monitoring VOCs in indoor air may be classified as one of two types viz. analytical methods which detect and quantitate pollutants on site and collec- tion techniques which concentrate organics on some type of sorbent for later analysis [20]. Solid sorbents are the materials most commonly employed for collection of vapour phase organics. Comparing VOCs in different indoor environments as well as with corresponding nearby outdoor observations show large variations in concentrations. The xylenes and toluene were the main contributors for indoor levels of a recently renovated hall having polished and varnished furniture. This location showed a significant concentration of these compounds even a week after the polishing and varnishing. The main contributor for the kitchen environment was benzene. The laboratory environment showed high indoor/outdoor ratios (I/O) for benzene and hexane, mainly due to the usage of these solvents. The indoor levels of VOC con- centrations were significantly high in locations where painting activity continued and the magnitude of concen- trations depended upon the type of paint being used. The I/O ratio of total C6-C10 compounds was also signifi- cantly high in these locations. In the rooms where ciga- rette smoking is a constituent, the concentration of ben- ene depends on the size of the room, ventilation rate, z Copyright © 2011 SciRes. JEP  Ambient Air Non-Methane Volatile Organic Compound (NMVOC) Study Initiatives in India - a Review Copyright © 2011 SciRes. JEP 25 Table 2. Emission pattern of metro cities in india. Region Highest Recorded TNMVOCLocation Benzene: Toluene Type of emission 138-214 µg/m3 Residential 362-462 µg/m3 Commercial 311-472 µg/m3 Industrial 666-790 µg/m3 Traffic Mumbai [7,11,12] 1206-1372 g/m3 Petrol pumps 11.74 Evaporative 92-162 µg/m3 Residential 1167-1369 µg/m3 Commercial 361-656 µg/m3 Industrial 541-733 µg/m3 Traffic Delhi [9,10,12,14-16] 560-819 µg/m3 Petrol pumps 8.11 Diesel engine exhaust 43.0-546.1 µg/m3 Residential cum Commercial 83-456.1 µg/m3 Industrial 177.6-745.2 µg/m3 Traffic Kolkata [8,17,18] 128.3.1173.6 µg/m3 Petrol pumps 3.5 Vehicular Exhaust number of people smoking, the number of cigarettes smoked, etc. All the VOCs found in non air conditioned indoor air was also found in air conditioned indoor air and air conditioned indoor air was found to be contami- nated by some additional VOCs. Inside Car: Fabrics, upholstery, carpets, adhesives, paints, cleaning materials contribute towards in- vehicle VOCs [21]. Malfunctioning in the automo- bile system emits the VOCs 10-30 times more than usual vehicle and such excessive emission elevates in-vehicle concentration of gasoline derived com- ponents. Thereby, total time spent in vehicle is of much concern as total dose of VOC inhaled affects human health and thus the study becomes very much relevant in the current scenario of developed as well as developing countries. The two com- monly used vehicles in India (Maruti Zen and Ma- ruti 800) were considered for estimation of VOCs inside parked car by Patil S. et al. and successful monitoring was done to come up with highest con- centration of Benzene in both the cases caused by unleaded petrol in the vehicle. It was suggested earlier that even when all the windows were closed tightly, the air turnover rate in automobile was 9 times higher when vehicle was traveling at 40 km/h than when it was parked. 4.4. Variability of VOC in Atmosphere The variability of pollutants is an important factor in de- termining human exposure to the chemicals. Variability can be divided into measured, spatial, temporal or sea- sonal and temporal-spatial interaction components [6]. Information on variability is required to determine the optimum sampling period, frequency to capture short-term peak concentrations, optimum number and locations of monitoring sites for population exposure assessment. Knowledge of variability of concentration within each microenvironment and between similar microenviron- ments is important in design of monitoring programmes and in the application of exposure models. Chemicals with observed concentrations to show low relative standard deviation are supposed to uniformly distribute in space. For others, measurement variability can arise from sampling and analysis methods, which can be detected by collection of duplicate samples; actual atmospheric concentrations variability also results in concentration variations. It has been established that al- though complexities are introduced by diurnal variations in local sources, local effects of wind, other meteoro- logical conditions and local factors; maximum variability is introduced due to temporal and temporal spatial inter- action. A recent study, although centered on urban at- mosphere of Delhi, can be generalized for Indian climate, exhibit clear seasonal variations of the inter-species ra- tios indicating differential reactivity of the VOC species in different seasons. Observed seasonal trends can be addressed by the seasonal characteristics of the prevail- ing meteorology, variations in the source strength and, most importantly, the availability of OH radical and in- solation that take care of the removal process of the VOC  Ambient Air Non-Methane Volatile Organic Compound (NMVOC) Study Initiatives in India - a Review 26 species from the atmosphere. The meteorology in Delhi shows an explicit winter and summer characteristics. In the winter months calm conditions and high stability of the atmosphere prevails, which hinder the pollutants from dissipating faster. Temperature inversion, which is a common phenomenon in the winter months and low mixing heights do restrict dilution process of the pollut- ants. Thus in the winter months the pollutants generally show a higher level of concentration. An enhanced emis- sion of aromatics is also reported due to cold start of gasoline powered vehicles in the winter months. In In- dian cities during winter, slum dwellers ignite biomass including wood waste and other organic refuse for heat- ing that also contribute to VOC loading of the atmos- phere [10]. In contrast, the summer months in Delhi ex- perience higher mixing height and an unstable atmos- phere in addition to which there might be several occa- sions of sandstorm, locally known as andhi [5]. Mete- orologically these factors favor to better mixing and easy dissipation of the pollutants leading to their lower levels in the atmosphere. Delhi records more insolation during summers which helps in the photolysis of species like ozone, aldehydes etc., leading to the formation of OH radical. The reaction of terpene with ozone also leads to the formation of OH radical. Thus in the summer months high level of OH concentration could prevail in the at- mosphere of Delhi, which plays the key role in the at- mospheric clean up and degradation process of the aro- matic VOCs. The study shows a clear seasonal profile with a unimodal pattern for the summer months. In in- dustrial areas toluene and xylene profiles are bimodal indicative of enhanced evaporation of toluene from in- dustrial units, vehicular service stations, electric motor winding and waste decomposition at waste dumping lands around the sampling location in hotter months. 4.5. BTEX Benzene, toluene, ethylbenzene and xylene (BTEX) form an important group of aromatic Volatile Organic Com- pounds (VOCs) because of their role in the tropospheric chemistry and the risk posed by them to human health. BTEX constitute upto 60% of non-methane VOCs and can be considered as an efficient indicator of organic compound pollution from road traffic [5]. The reaction of the BTEX with hydroxyl radicals (OH) and/or nitrate (NO3) radicals serves as the dominant degradation proc- esses for aromatic VOCs in the atmosphere. The result- ing products contribute to secondary organic aerosol (SOA) formation by nucleation and condensation. In the presence of NOx, aromatic VOCs in general, react with OH radicals to form ozone; thus modifying the oxidizing capacity of the atmosphere. Ozone formation potential of VOCs can vary by virtue of differences in their reactivity and structure. This has led to the development of scales of so called ‘reactivity’ or “ozone formation potential” for VOC. For ranking of the BTEX with respect to their contribution to O3 formation, MIR (Maximum Incre- mental Reactivity) coefficient is a popular means which has been used in a recent study on BTEX concentration in ambient air of Delhi along with rate constants of VOC-OH reactions to assess the ozone formation poten- tial of BTEX compounds. MIR can be defined as the amount (in grams) of ozone formed per gram of VOC added to an initial VOC–NOx mixture, indicating how much a compound may contribute to the ozone formation in the air mass. These unitless MIR coefficients are in- tended for use in relatively high NOx conditions, which may be used as an important tool in ozone control pro- grams. The reactivity of VOC with OH radical depicts the ability of the hydrocarbon to form higher oxidized products like aldehydes, ketones, acids, organic peroxy radicals, etc. A good mutual correlation among the spe- cies indicates that they might primarily originate from the same source and a good mutual correlation between ethylbenzene and xylene indicates that they might possi- bly originate from gasoline vehicle and gasoline stations. Based on the MIR scale, xylenes are the most dominant contributor to ozone formation among BTEX. Toluene is the second largest contributor to ozone formation. Ozone formation potential of benzene is minimal though it is the most hazardous species among BTEX. Efforts to reduce lead content of the fuel gasoline and to maintain the octane number have led to an increase in benzene and other aromatic carbons in gasoline. Use of tetra ethyl lead (TEL) in fuel was phased out between 1994 and 1998 in major cities in India [22,23]. There is a general consensus that for well maintained vehicles, the majority of the exhaust fumes which build up in the vehicle interiors, come from the exhaust fumes of surrounding vehicles either naturally or by ventilation and not from the vehicle itself. The elevated VOC inside the vehicles without catalytic converter used in the study is associated with internal leakage of engine evaporative emission and/or vehicle exhaust emission through body cracks into the vehicle interior due to the fairly old vehi- cle age (> 10 years), poor body conditions, high mileage and poor car maintenance. On the other hand, newer catalyst equipped cars marketed after 2001 respect Bharat Stage II norms (equivalent to European Union Emission Standard, EURO II) and have efficient emis- sion control with less combustive VOC emission. A two phase (phase I: 2001-2002 & phase II: 2003- 2004) monitoring made inside and in the immediate out- side of passenger cars fitted with and without catalytic converters using different types of fuels, along two con- gested urban routes. During Phase I of the study, the Copyright © 2011 SciRes. JEP  Ambient Air Non-Methane Volatile Organic Compound (NMVOC) Study Initiatives in India - a Review27 benzene content in gasoline was 5% and the mean con- centration of in-vehicle benzene in cars without catalytic converter was found to be as high as 721.2 μg/m3. In Phase II when the benzene content was reduced to 3% and with modified engine type, the mean in-vehicle ben- zene concentration was reduced to 112.4 μg/m3. The in-vehicle concentration varied with engine type and age of the vehicle. Roadside ambient mean concentration of benzene was 214.8 μg/m3 and 30.8 μg/m3 in Phase I and Phase II respectively. The same study showed, the value was higher than the cars fuelled by diesel (0.78 for ben- zene and 0.70 for toluene) or LPG (0.95 for benzene and 0.94 for toluene). It has been established earlier that die- sel fuelled vehicles are primarily impacted by the pene- tration of roadway air into the cabin while for the gaso- line fuelled vehicle, the exhaust emission is rich with the target VOCs due to the presence of these components in the gasoline. The increase in T/B ratio inside and outside of all types of cars in Phase II along with roadside static value reflects the positive effect of decreased level of benzene in fuel as well as presence of different commer- cial and industrial sources of toluene in urban areas. Toluene level was not significantly different in Phases I and II. Thereby it can be pointed out, that Commuters in urban Kolkata travelling in cars are more exposed to BTEX compared to other cities of the world, not only because of inadequate emission control, but also due to insufficient road space and slow driving speed. Another similar study on five different microenviron- mental regions in Mumbai viz., petrol pump, traffic junc- tion, arterial road, highway and parking areas has also concluded that the concentration of benzene in air cannot be related to only the number of vehicles, but along with ventilation available, age and type of vehicle, meteorol- ogy also contribute significantly. High concentrations at traffic junctions and parking areas are due to startup emissions of engines; whereas at repair garages the use of solvents for cleaning contributes to high benzene con- centrations [24,25]. Unlike Kolkata no declining trend in benzene concen- tration has been reported in Mumbai, which can be due to the industrial releases, a significant contributor in Mum- bai, does not show any evidence of coming down. Be- sides vehicles fitted with catalytic converter, two wheel- ers, three wheelers and four wheelers without catalytic converter still form a significant part of vehicle inventory in Mumbai and thereby not impacted much till the time of study. All these methods used to measure concentration of benzene are mainly based on passive diffusion or pumped diffusion with a very low flow rate. Averaging time of measurements varies from few minutes for online system to few days in case of passive diffusion. Like other classic pollutants no averaging time is suggested for monitoring of benzene. The volume of air sampled varies from 0.5 to 101 over the sampling period. The measurements made at the traffic junction do not repre- sent a well-mixed atmosphere. Therefore an attempt was made to include dispersion parameters into multimedia model to predict concentrations of benzene using multi- media mass balance model considering emission into air in a micro spatial scale defined as area of approximately around traffic intersections and highways as compared to regional, continental and global scales used [26]. Al- though the model overestimates the concentrations, but due to fairly good agreement with observed values can be used as a tool to act as an indicative value. In microenvi- ronment 0.1% of benzene is distributed on road surface and 0.3% on urban soil and most of the benzene 99.6% remains in the air whereas, 97.2% of benzene remains in air phase of the environment, small amounts get por- tioned into agricultural soil (1.4%), other soils (0.9%) and sea water (0.5%) in regional system. The predicted concentration of benzene in air at regional scale is 0.267 µg/m3 and half life time in air was estimated at 10.5 days. Based on their photochemical reactivity towards hy- droxyl radical, the concentrations of the VOCs were scaled to formaldehyde equivalent, which showed that the high molecular weight carbonyls and xylenes con- tribute significantly to the total OH-reactive mass of the VOCs [27]. Intense solar radiation in tropical climate increases secondary formation of the low molecular weight carbonyls by photo-oxidation of VOCs especially BTEX and thereby governing principal pathway for the disappearance. Biomarker for Benzene: Benzene after inhalation, excreted rapidly in urine as conjugate phenol and dihydroxy phenol and it is comprised of almost one-third of retained content [28]. Thus phenol be- ing a metabolite of benzene, its excretion has been traced as marker of short-term benzene exposure. Being a painless, easy to obtain and low-cost proc- ess the urinary phenol technique is applied on workers (non-smoker and non-alcoholic consump- tion) of petrol-filling stations of peri-urban areas in eastern India. The concentration of phenol was de- termined by aminoantipyrine method and found to vary between 5.14 + 1.63 and 11.66 + 1.92 (before and after work shift) compared to 2.09 + 0.62 and 3.28 + 0.76 for control sample. 5. Natural Sources Considering abatement of air pollutants, decrease in am- bient temperature by evapotranspiration, sequestering of carbon dioxide and subsequent processes to march to- wards better air quality plantation in urban and industrial Copyright © 2011 SciRes. JEP  Ambient Air Non-Methane Volatile Organic Compound (NMVOC) Study Initiatives in India - a Review 28 areas have been a common trend nowadays [29-31]. Many vegetational species emit VOCs, particularly iso- prene, which is highly reactive and having high photo- chemical ozone creation potential (POCP) value, and terpenes, responsible for the formation of acid rains; formation of secondary aerosols in the atmosphere af- fecting radiative balance of earth is another major impact caused by biogenic VOCs. Isoprene emission constitutes about 40% of all biogenic hydrocarbons emitted into the atmosphere from vegetation. Using Dynamic flow en- closure technique foliar emission of a series of local plant species in Delhi has been thoroughly studied by Padhy et. al. Diel, seasonal and interspecies variations have been recorded and the trend was analyzed in order to prepare the total annual biogenic VOC emission from India. Testing saplings of about 2 years old no isoprene emis- sion detected during night time from any species, but starts early in the morning and gradually increasing reaching peak during noon and afternoon. The initiation of emission shifted with the change in season, recording the most delayed during winter ensuring the dependency of isoprene emission on temperature and light. It is al- ready observed that isoprene emission reaches the maximum at light intensities in saturated photosynthesis and increases with the rise in temperature up to certain point and thereafter it rapidly declines. The maximum amount of isoprene was emitted in the rainy season (8.5 + 8.3 μg·g-1 leaf dry weight·h-1) and lowest during the win- ter (3.9 + 6.8 μg·g-1 leaf dry weight·h-1). Unlike isoprene -pinene emissions were not confined to daytime only. The rate of emission for -pinene appears to be inde- pendent of light but increase exponentially with tem- perature. Considering all kind of emissions Bougainvilea spectabilis and Nerium indicum are recommended for creating hedge; Acacia Arabica, Alstonia scholaris, Azadirachta indica and other seven species have been suggested for tree plantation. 6. Hazardous Air Pollutants and Health Issues The United Nations estimated that over 600 million peo- ple in urban areas worldwide were exposed to dangerous levels of traffic-generated air pollutants [2]. Air pollution and its public health impacts are drawing increasing concern from the environmental health research commu- nity, environmental regulatory agencies, industries, as well as the public. The quality of the air, both indoors and outdoors, is closely related to morbidity and mortal- ity from respiratory and cardiovascular diseases. Many of the VOCs are included in the list of 188 hazardous air pollutants (HAPs) identified by USEPA. (HAPs) are the pollutants known or suspected to cause cancer or other serious health effects or adverse environmental effects. HAPs have a potential to partition into different compo- nents of environment, and some of them have considera- bly long lifetime in one environmental component or other making them persistent in ecosystem. Persistence is an important attribute for determining the overall human health and ecological impact of a chemical released to the environment. Persistent pollutants pose a greater po- tential concern per unit release because they cannot be rapidly removed from the environment. An appropriate measure of persistence is the characteristic time a chemical remains in the environment. This can theoretically be determined by finding the overall decay rate of a pollut- ant in a closed defined landscape system, calculation of which requires both the mass distribution among envi- ronmental media and media specific half-life. Multimedia models based on concept of fugacity, has been successfully used to determine whether the pollut- ant can have a local, regional or global scale impact de- pending on the characteristic spatial scale [32]. The TaPL3 model, while applied for Thane Belapur Industrial Area (TBIA), divided the environment in five well-mixed compartments like atmosphere, creek, soil, sediment and vegetation. The model mathematically calculates the en- vironmental persistence; Travel Distance in Air (Long Range Transport Potential or LRT) defined as the poten- tial for the chemical to be subject to long range transport and the average hoping value H, representing the average number of hops experienced by the chemical from one compartment to another. Carbon tetrachloride scored the highest (0.99) in average no. of HOPs and the lowest value (0.001) was recorded for Formaldehyde. Persis- tence hours value for Naphthalene is the highest (3.23E + 09) whereas minimum value (51.6) is registered for For- maldehyde. HAPs have varying types of human health effects, car- cinogenic and non-carcinogenic, depending upon the chemicals involved, concentration and exposure time. Some of them have both toxic and carcinogenic effect. The toxic effect can be acute (short-term severe health effect) or chronic (long-term persistent health effect). Toxicity is often evident in a shorter length of time than the carcinogenic effect. The potential health effects of non-carcinogens range from skin irritation to life-short- ening. Carcinogens cause or increase the incidence of malignant neoplasms or cancers. Risk characterization integrates the information on hazard identification, dose response assessment and exposure assessment to develop a qualitative and quantitative estimate of the likelihood that any of the hazards associated with the chemical will be realized in exposed people. Risk score system helps to identify environmental releases of toxic chemicals that are likely to pose greater risk to human health. This sys- tem adjusts the amount of a chemical that is released Copyright © 2011 SciRes. JEP  Ambient Air Non-Methane Volatile Organic Compound (NMVOC) Study Initiatives in India - a Review29 using a weighing factor (a chemical’s toxic equivalency potential (TEP)) so that chemical releases can be com- pared on a common scale that takes into account differ- ences in toxicity and exposure potential. The study shows, the workers and residents of TBIA are exposed to levels of HAPs which have potential for adverse impact on their health. The current study considered output of TaPL3 to be the input of concentrations of HAPs in different com- ponents of environment to calculate toxicity profile. Tra- ditionally, exposure assessment is focused on ambient air pollution levels, which can be easily obtained by estab- lishing several fixed monitoring sites in the region of interest. Due to spatial variations of the pollutant levels in the study areas, usually exposure monitoring data ob- tained from these limited number of fixed-sites are not accurate enough for epidemiologic studies. An alternative for this is the adoption of traffic indica- tors (population density and traffic intensity) and geo- graphic information system (GIS), especially when traf- fic-related exposure is the main focus. By collecting traf- fic indicator information, personal exposure can be esti- mated. This method is suitable for long-term exposure assessment for large populations in urban areas. It is an effective method when the main goal is to estimate the exposure profiles of a certain area, and it is better in ad- dressing spatial variations of air pollution levels in a cer- tain area than fixed-site monitoring. The introduction of portable measuring equipment made personal exposure assessment feasible by addressing exposure issues for high risk populations like traffic policemen and drivers. But this technique is expensive and not suitable for large population-based study and long-term monitoring. This personal monitoring system has been taken place in atleast two major studies of VOC exposure based on Kolkata city [21,33]. Kolkata is one of the most populous metropolitan cities of the world with significant com- muter flows and thereby large number of staffs is en- gaged in transport buses as well as petrol pumps. Two different studies have been conducted to assess the in-vehicle and pumping station exposure of VOCs for the workers involved. For the first case, exposure to VOCs is found to depend on the condition of the engine, the qual- ity of fuel used, and on traffic density. The mean benzene exposure of drivers and conductors are 527.3 and 154.2 µg/m3 respectively. The concentrations of the VOCs, benzene, toluene, o-xylene and p-xylene were found in the ranges, 147 - 3465.3, 42.5 - 3770, 108.1 - 2347.8 and 56.6 - 437.8 µg/m3 respectively. The wide ranges may be because of the poor conditions of engines buses sampled. They may emit more VOCs due to fuel loss or due to contamination of the fuel used. Drivers mean exposures to benzene, toluene, and o-xylene were found to be higher than for conductors. During the study, buses were randomly selected, the days on which old model bus was selected the VOC values shooted up. The level of exposure in petrol pumps is largely de- pendent on the technical specifications of gasoline, espe- cially its benzene content, and to the emission control technology, such as vapor recovery systems in operation. Monitoring of the service station workers revealed that the average exposure level for benzene and toluene were 3.9 and 5.5 fold higher than the ambient air. The inte- grated lifetime cancer risks due to benzene, ethylbenzene, formaldehyde and acetaldehyde and the overall hazard index due to chronic exposure to some hazardous volatile organic compounds are 1.48E-04 and 2.3 indicating the probability of cancer as well as chronic health effect on the workers exposed. 7. Removal Initiative Considering anthropogenic emission due to the inherent presence of VOCs in the products (chemicals), the con- trol strategy for VOCs emission distinctly differs from that for the common urban pollutants such as NOx, SO2, and CO in that the former usually requires an end-of-pipe control strategy. The substitution of raw materials, equip- ment and process modification are applicable mostly in control of the later pollutants, whereas VOCs control methods include condensation, adsorption, catalytic oxi- dation, thermal oxidation, air stripping and biological treatment. There are findings like change in resistivity of polymeric nanomaterials [35], which can be used as sensing the presence of VOCs, but the elimination efforts has received much attention. The selection of appropriate technology depends on type and concentrations of VOCs, extent of separation required and cost involved [35,36]. 7.1. Adsorption/Condensation of VOC in Air Medium While condensation using N2 at cryogenic temperatures was recognized as the most effective and commercially suitable technique, adsorption is considered as the state- of-art technology having immense potential for VOC control. The keyword of an adsorption process is a po- rous solid medium having high adsorptive capacity. A large surface area or large micro-pore volume can be achieved due to the porous structure of the solid. The success of the adsorption process depends on the per- formance of adsorbents in both equilibria and kinetics. A solid exhibiting favourable adsorption isotherm as well as faster kinetics is supposed to be a good adsorbent. Therefore, in order to be a good adsorbent, a solid must have 1) a reasonably larger surface area, and 2) a rela- tively larger pore network for the transport of molecules to the interior. A relatively larger breakthrough time and gradual increase in the concentration following break- Copyright © 2011 SciRes. JEP  Ambient Air Non-Methane Volatile Organic Compound (NMVOC) Study Initiatives in India - a Review 30 through are desirable. Recently there have been a series of studies in this area focusing on: Theoretically establishing condensation followed by adsorption to be more effective in controlling VOCs than the condensation or adsorption alone, if the VOC concentrations varied over a large range [37]. Experimental analysis to confirm adsorption is an effective means for controlling VOC if the concen- tration levels are typically lower than 1%, which is mostly the case with air bound VOCs in parts per million (ppm) level, while the condensation is suited for higher concentration levels [38]. Experimentally demonstrating the suitability of ac- tivated carbon fiber in effectively adsorbing VOCs from inert gaseous stream under varying operating conditions [39,40]. Although there are commercially available adsorbents such as granular activated carbon (GAC), silica gel and zeolites, the search for material with greater adsorption potential and effective regeneration allows investigation on activated carbon fiber–toluene combination to judge. Certain successful mathematical model has also been derived to predict breakthrough characteristics taking into account gas-particle film mass transfer resistance, adsorbent pore diffusion and the adsorption/desorption rates (proved to be sole determinant of the dynamics) within the pore under dynamic conditions of different temperature (35 - 1000˚C), gas concentration (2000 - 10,000 ppm), gas flow rate (0.2 - 1.0 slpm) and weight of the adsorbent (2 - 10 g). A bed temperature of 50˚C was found to be favorable for both toluene and m-xylene, although a relatively larger adsorption of m-xylene by ACF was indicated. A temperature of 150˚C and regen- eration time of 60 - 75 min were typically required for the complete regeneration of ACF and even after 25-30 times of adsorption/desorption cycles no appreciable loss in its adsorption capacity was evident in the correspond- ing breakthrough response. This kind of air stripping and adsorption are estab- lished processes but these suffer from the disadvantage of pollutant transfer to the second phase. The expensive air stripping process is applied to compounds having significant higher partition coefficient to air over water. Activated carbon adsorption is not effective economi- cally as the spent carbon has to be regenerated time to time or disposed off and disposing of spent carbon should be done in environmentally accepted manner. 7.2. Pervaporation of VOC in Aqueous Medium Pervaporation (PV) is a membrane process involving separation of liquid mixtures through a dense membrane. In PV, separation of the desired component is achieved by its preferential sorption and diffusion through the membrane under reduced pressure which creates a chemical potential gradient in the liquid phase. The se- lectivity of the membrane is the determining factor in the relative flow of the different components. The cost of PV increases linearly with increasing system size, which makes PV most competitive for small to medium-sized stream for removal of VOCs. Since the selective permea- tion and diffusion of the VOCs through the membrane are dependent on their interaction with the membrane material, their sorption and diffusion behaviors through the membrane are functions of solubility parameter (thereby interaction parameter of the membrane poly- mers with the VOCs), chain rigidity or Tg of various components of membrane, hard segment concentration, presence of plasticizers and crosslink density in case of network polymer. Experimental parameters like feed temperature and concentration also have effects on sepa- ration performances like flux and separation factor. It appears from the chemical nature of chlorinated VOCs that a membrane with both flexible non-polar and rigid polar organic domains would be more suitable for their separation [41]. Segmented poly- urethanes with elastomeric soft domain and rigid urethane as well as urea domain can be projected as an ideal material of such type. A novel crosslinked hydroxyterminated polybutadiene based (HTPB) polyurethane urea (PUU)–poly (methyl methacry- late) (PMMA) interpenetrating network (IPN) membrane has been developed, which shows due to comparable solubility parameter values more affin- ity of VOC molecules to the PMMA moiety was evident and thereby with increase in polar PMMA separation efficiency also increases. Decrease in NCO/OH ratio (decrease in hard segment content) decreases crosslink density and subsequently re- sults in increased sorption. With increase in the feed concentration flux of chlorinated organic com- pounds increases. As the VOC concentration in the feed is increased, the membrane is more swollen due to polymer chain flexibility and increased in- teraction with PMMA component. All the mem- brane compositions show flux and selectiveness in the order of 1, 1, 2, 2-tetrachloroethane < carbon tetrachloride < chloroform < trichloroethylene. Pervaporation membranes have been made from some homopolymers like unplasticized polyvinyl chloride (UPVC), plasticized PVC (PPVC), poly- styrene (PSTY) and blends of UPVC and PSTY in different compositions to assess sorption and per- vaporation of tetrahydrofuran (THF) with different concentrations (0.44–11.3 wt.%) in water under various conditions like feed concentration, tem- Copyright © 2011 SciRes. JEP  Ambient Air Non-Methane Volatile Organic Compound (NMVOC) Study Initiatives in India - a Review31 perature etc [42]. The higher concentration of THF in feed promotes greater extent of sorption by swelling the THF selective membrane, whereas sorption selectivity decreases exponentially with feed concentration with PSTY, due to its highest hydrophobicity among all other types of mem- branes absorbs minimum amount of water, per- forming best. The activation energy for sorption and permeation was found to decrease linearly with increase in feed concentration of THF. For all the membranes separation characteristic decreases with increase in temperature. This may be due to in- creased permeation of both water and THF at higher temperature. The presence of polar dioctyl phthalate (DOP) plasticizer has caused maximum sorption by softening the stiff UPVC matrix by in- creasing its free volume. The higher sorption of UPVC than that of PSTY may be ascribed to its closer solubility parameter value with respect to THF. The attractiveness of the process is that the polluting compounds are selectively removed from the feed in al- most pure form. 7.3. Biodegradation of VOC in Aqueous Medium Aerobic biological processes such as the activated sludge process are very effective in removing volatile organic compounds from wastewaters. To come out with a bal- ance between too high concentration of hazardous waste causing inhibition of microorganism and too low rate of addition heading towards starvation of microbial cell, two phase partitioning bioreactor (TPPB) using water immiscible and biocompatible organic solvent has been well studied by a series of experiments by D. Singh et al. In TPPB 5000 mg/l benzene was biodegraded up to 50.17% over a period of 168h [43,44]. But VOCs like tetrachloroethylene, which are found to be resistant to biodegradation under aerobic conditions, can be successfully treated using upflow anaerobic sludge blanket (UASB) reactor [45,46]. The study was undergone to develop granular sludge using municipal digester sludge in the presence of tetrachloroethylene (PCE) by investigating the effect of increased concentra- tion of PCE on operational parameters of UASB reactor to dechlorinate PCE, and the effect of hydraulic retention time (HRT) on the performance of the process and to determine the kinetic parameters for the dehalogenation of PCE in a UASB reactor fed with a synthetic wastewa- ter. The granules of 0.25 ± 4 mm size were observed af- ter 82 days having mostly Methanothrix and Methano- sarcina bacteria. Influent PCE concentration of 5-50 mg/l decreased to less than 0.23 mg/l (98.5% ± 1% removal) in most cases. The trichloroethylene (TCE), cis-1,2-di- chloroethylene (cis-DCE), vinyl chloride (VC) and eth- ylene were formed on dehalogenation of PCE. Under steady state operation conditions the COD removal of 94% ± 2% and biogas production of 0.559 ± 0.508 m3/kg CODrem with methane content of 64% ± 2% was achieved. The maximum PCE dechlorination rate (qmax) was 14.28 mg PCE/g VSS.d and the half velocity coeffi- cient, (Ks), was 0.417 mg PCE/l under steady state con- ditions. The granules acclimated to PCE exhibits better removal capability to the higher concentration of PCE. Biological treatment being a slow process is not very effective. 7.4. Biofilters Cost competitive and efficient biofilters require very lit- tle supplementary nutrients for enhancing microbial sus- tainability and do not produce any hazardous secondary pollutants. Different filter bed-nutrient combinations are in use for treating VOCs experimentally. Table 3 gives a comprehensive idea about the different experimental studies in this field. Biofilter media are not effective at high temperature due to omission of microbial community. 7.5. Catalytic Combustion Oxidative destruction is possible at low temperature in presence of a catalyst and this energy efficient process can operate with very dilute pollutants [51]. Manganese nodule and TiO2-SiO2 have been studied for decomposi- tion of VOCs [52,53]. High temperature stable iron and manganese mixed pillared clay having high manganese content shows acetone decomposition reaction whereas material with high iron contents acts as a better catalyst for trichloroethylene decomposition [51]. 7.6. VOC Free Product Development Except for the previously mentioned approach of de- struction of VOC in some media (air or water), there is a completely separate view to design low or zero emission product in place of common VOC emitting items. A bio- degradable, eco-friendly vegetable oil based ink which, unlike conventional lithographic ink, doesn’t contain aliphatic solvents and also doesn’t use aliphatic and aro- matic solvents for cleaning various surfaces, which are coated with the ink, is prepared and characterized by Maji C. et al. [54,55]. The oil is a drying oil, a natural product containing triglycerides of fatty acids with un- saturated double bonds. These triglycerides react in the presence of light with oxygen in the air to crosslink, making the ink permanent on paper. The alkyd resin is non-volatile, synthetic, low molecular weight polyester with pendant aliphatic and carboxylic acid groups. It is similar to the resins made for use in paints. In its acid Copyright © 2011 SciRes. JEP 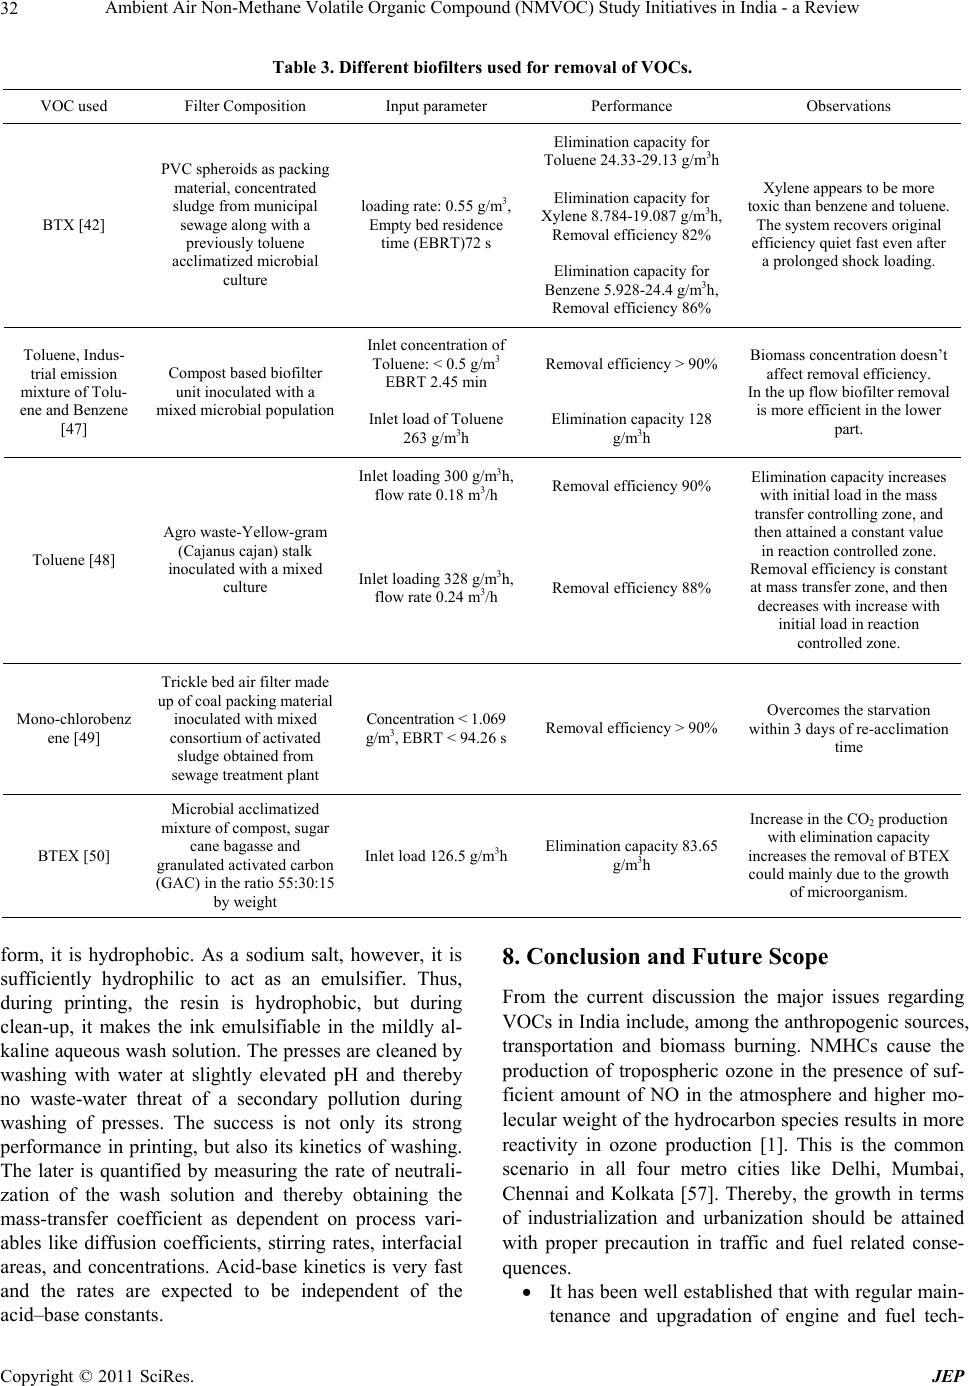 Ambient Air Non-Methane Volatile Organic Compound (NMVOC) Study Initiatives in India - a Review Copyright © 2011 SciRes. JEP 32 Table 3. Different biofilters used for removal of VOCs. VOC used Filter Composition Input parameter Performance Observations Elimination capacity for Toluene 24.33-29.13 g/m3h Elimination capacity for Xylene 8.784-19.087 g/m3h, Removal efficiency 82% BTX [42] PVC spheroids as packing material, concentrated sludge from municipal sewage along with a previously toluene acclimatized microbial culture loading rate: 0.55 g/m3, Empty bed residence time (EBRT)72 s Elimination capacity for Benzene 5.928-24.4 g/m3h, Removal efficiency 86% Xylene appears to be more toxic than benzene and toluene. The system recovers original efficiency quiet fast even after a prolonged shock loading. Inlet concentration of Toluene: < 0.5 g/m3 EBRT 2.45 min Removal efficiency > 90% Toluene, Indus- trial emission mixture of Tolu- ene and Benzene [47] Compost based biofilter unit inoculated with a mixed microbial population Inlet load of Toluene 263 g/m3h Elimination capacity 128 g/m3h Biomass concentration doesn’t affect removal efficiency. In the up flow biofilter removal is more efficient in the lower part. Inlet loading 300 g/m3h, flow rate 0.18 m3/h Removal efficiency 90% Toluene [48] Agro waste-Yellow-gram (Cajanus cajan) stalk inoculated with a mixed culture Inlet loading 328 g/m3h, flow rate 0.24 m3/h Removal efficiency 88% Elimination capacity increases with initial load in the mass transfer controlling zone, and then attained a constant value in reaction controlled zone. Removal efficiency is constant at mass transfer zone, and then decreases with increase with initial load in reaction controlled zone. Mono-chlorobenz ene [49] Trickle bed air filter made up of coal packing material inoculated with mixed consortium of activated sludge obtained from sewage treatment plant Concentration < 1.069 g/m3, EBRT < 94.26 s Removal efficiency > 90% Overcomes the starvation within 3 days of re-acclimation time BTEX [50] Microbial acclimatized mixture of compost, sugar cane bagasse and granulated activated carbon (GAC) in the ratio 55:30:15 by weight Inlet load 126.5 g/m3h Elimination capacity 83.65 g/m3h Increase in the CO2 production with elimination capacity increases the removal of BTEX could mainly due to the growth of microorganism. form, it is hydrophobic. As a sodium salt, however, it is sufficiently hydrophilic to act as an emulsifier. Thus, during printing, the resin is hydrophobic, but during clean-up, it makes the ink emulsifiable in the mildly al- kaline aqueous wash solution. The presses are cleaned by washing with water at slightly elevated pH and thereby no waste-water threat of a secondary pollution during washing of presses. The success is not only its strong performance in printing, but also its kinetics of washing. The later is quantified by measuring the rate of neutrali- zation of the wash solution and thereby obtaining the mass-transfer coefficient as dependent on process vari- ables like diffusion coefficients, stirring rates, interfacial areas, and concentrations. Acid-base kinetics is very fast and the rates are expected to be independent of the acid–base constants. 8. Conclusion and Future Scope From the current discussion the major issues regarding VOCs in India include, among the anthropogenic sources, transportation and biomass burning. NMHCs cause the production of tropospheric ozone in the presence of suf- ficient amount of NO in the atmosphere and higher mo- lecular weight of the hydrocarbon species results in more reactivity in ozone production [1]. This is the common scenario in all four metro cities like Delhi, Mumbai, Chennai and Kolkata [57]. Thereby, the growth in terms of industrialization and urbanization should be attained with proper precaution in traffic and fuel related conse- quences. It has been well established that with regular main- tenance and upgradation of engine and fuel tech-  Ambient Air Non-Methane Volatile Organic Compound (NMVOC) Study Initiatives in India - a Review33 nology exhaustive emission from vehicular fleet can be controlled. Emissions from tyres also needed attention as improving the quality of tyre can cause less contribution in contamination of ambient air because of its VOC content [57]. In addition to rubber compounds, Carbon black (rein- forcing fillers), Textile and Steel fibres in form of cord/rayon, synthetic suite of nylons and polyes- ters(reinforcing fibers), Petroleum oil, naphthenic oil or aromatic oil (lubricants),vulcanizing agents like organo sulfur compounds, Zinc oxide and Steric acid as curing agent are used in manufactur- ing tyre. In a comparative study including emis- sions of VOCs from wear and tear of automotive and aeroplane tyres by Patil S. et al. It was depicted that as many as sixty-six VOCs including twelve HAPs were identified among which fifty one VOCs were associated with automobile tyre. Aero- plane tyres not only generate lesser numbers of VOCs, but the concentrations generated are also comparatively small. Retreading and burning of tyres are very common in Indian cities and thus should be considered as a major source of air pol- lution. Since fuel adulteration also has come up as possible source, restrictions should be imposed on that kind of malpractice. On Governmental basis, certain steps and targets are established like, use of CNG in place of petrol or use of four stroke low emissive engine replacing two stroke ones; proper regulatory monitoring should be continued to assess the change in VOC level or shift in source profile. Unless it is helping in ambient air quality in Indian condition, no meas- ure just for the sake of changing the technology would do any good to the current situation. Although it should be kept in mind that, consider- ing factors including economic and technical feasi- bility, regulatory standards are 15-min, 1-hr 8-hr based, but an exposure level lower than the rec- ommended standard does not mean that a life-long exposure at such a level is safe; In addition, most of the standards were not established based on NOAELs (No observed adverse effect levels) or LOAELs (lowest observed adverse effect levels); still some restrictions should be imposed with strict laws which may need to be modified based on new discoveries or new economic and technical feasi- bilities. This should be accompanied with public awareness so that following or maintaining the standards do not become a burden, rather than a responsibility for the common people. Considering different aspects of research going on in India based on VOCs, some important studies are really lacking and can be taken for serious as- sessment. From certain source apportions the dumping sites have been considered possible basis of certain VOCs, but thorough study on this subject has not been recorded till now. Thereby the release of VOC in current scenario and corresponding change in case of applying certain technologies like utiliza- tion of solid waste as fuel and organic manure should be monitored in long term surveys. There is natural inclination towards biofuel throughout the world keeping in mind the dimin- ishing volume of fossil fuel. In India the effect on VOC profile with introduction of biofuel should be undertaken although the socio-economic impact should also be taken into account. REFERENCES [1] Kansal, “Sources and Reactivity of NMHCs and VOCs in the Atmosphere: A Review,” Journal of Hazardous Ma- terials, Vol. 166, No. 1, 2009, pp. 17-26. doi:10.1016/j.jhazmat.2008.11.048 [2] X. Han and L. P. Naeher, “A Review of Traffic-Related Air Pollution Exposure Assessment Studies in the De- veloping World,” Environment International, Vol. 32, No. 1, 2006, pp. 106-120. doi:10.1016/j.envint.2005.05.020 [3] S. S. Rayalu, S. U. Meshram, R. B. Biniwale, A. srivasa- tava, P. D. Jadav and S. Devotta, “Volatile Organic Car- bon Monitoring in Indoor Environment Using a Versatile Hydrophobic Flyash-Based Zeolite as Adsorbent,” Cur- rent Science, Vol. 91, No. 4, August 2006, pp. 497-503. [4] Srivastava, A. E. Joseph and S. D. Wachasunnder, “Quali- tative Detection of Volatile Organic Compounds in Out- door and Indoor Air,” Environmental Monitoring and Assessment, Vol. 96, No. 1-3, 2004, pp. 263-271. doi:10.1023/B:EMAS.0000031732.68465.af [5] R. R. Hoque, P. S. Khillare, T. Agerwal, V. Shridhar and S. Balachandran, “Spatial and Temporal Variation of BTEX in the Urban Atmosphere of Delhi, India,” Science of The Total Environment, Vol. 392, No. 1, 2008, pp. 30- 40. doi:10.1016/j.scitotenv.2007.08.036 [6] A. Srivastava, “Variability in VOC Concentrations in an Urban Area of Delhi,” Environmental Monitoring and Assessment, Vol. 107, No. 1-3, 2005, pp. 363-373. doi:10.1007/s10661-005-3546-8 [7] A. Srivastava, A. E. Joseph and S. Devotta, “Volatile Organic Compounds in Ambient Air of Mumbai - India,” Atmospheric Environment, Vol. 40, No. 5, 2006, pp. 892- 903. doi:10.1016/j.atmosenv.2005.10.045 [8] D. Majumdar (neé Som), C. Dutta, A. K. Mukherjee and S. Sen, “Source Apportionment of VOCs at the Petrol Pumps in Kolkata, India; Exposure of Workers and As- sessment of Associated Health Risk,” Transportation Re- search Part D, Vol. 13, No. 8, 2008, pp. 524-530. Copyright © 2011 SciRes. JEP  Ambient Air Non-Methane Volatile Organic Compound (NMVOC) Study Initiatives in India - a Review 34 doi:10.1016/j.trd.2008.09.011 [9] A. Srivastava, A. E. Joseph, S. Patila, A. More, R. C. Dixit and M. Prakash, “Air Toxics in Ambient Air of Delhi,” Atmospheric Environment, Vol. 39, No. 1, 2005, pp. 59-71. doi:10.1016/j.atmosenv.2004.09.053 [10] P. K. Padhy and C. K. Varshney, “Total Non-Methane Volatile Organic Compounds (TNMVOC) in the Atmos- phere of Delhi,” Atmospheric Environment, Vol. 34, No. 4, 2000, pp. 577-584. doi:10.1016/S1352-2310(99)00204-6 [11] A. Srivastava, “Source Apportionment of Ambient VOCS in Mumbai City,” Atmospheric Environment, Vol. 38, No. 39, 2004, pp. 6829-6843. doi:10.1016/j.atmosenv.2004.09.009 [12] A. Srivastava, A. E. Joseph, A. More and S. Patil, “Emis- sions of VOCs at Urban Petrol Retail Distribution Centres in India (Delhi and Mumbai),” Environmental Monitoring and Assessment, Vol. 109, No. 1-3, 2005, pp. 227-242. doi:10.1007/s10661-005-6292-z [13] M. Mohan Rao, G. G. Pandit, P. Sain, S. Sharma, T. M. Krishnamoorthy and K. S. V. Nambi, “Non-Methane Hy- drocarbons in Industrial Locations of Bombay,” Atmos- pheric Environment, Vol. 31, No. 7, 1997, pp. 1077-1085. doi:10.1016/S1352-2310(96)00266-X [14] Srivastava, B. Sengupta and S. A. Dutta, “Source Appor- tionment of Ambient VOCs in Delhi City,” Science of Total Environment, Vol. 343, No. 1-3, 2005, pp. 207-220. doi:10.1016/j.scitotenv.2004.10.008 [15] P. S. Khillare, R. R. Hoque, V. Shridhar, T. Agarwal and S. Balachandran, “Temporal Variability of Benzene Con- centration in the ambient Air of Delhi: A Comparative Assessment of Pre- and Post-CNG Periods,” Journal of Hazardous Materials, Vol. 154, No. 1-3, 2008, pp. 1013- 1018. doi:10.1016/j.jhazmat.2007.11.006 [16] B. Gurjar, J. A. Van Aardenne, J. Lelieveld and M. Mohan, “Emission Estimates and Trends (1990-2000) for Megacity Delhi and Implications,” Atmospheric Envi- ronment, Vol. 38, No. 33, 2004, pp. 5663-5681. doi:10.1016/j.atmosenv.2004.05.057 [17] G. Samanta, G. Chattopadhyay, B. K. Mandal, T. Roy Chowdhury, P. P. Chowdhury, C. R. Chanda, P. Banerjee, D. Lodh, D. Das and D. Chakraborty, “Air Pollution in Calcutta during Winter - a Three-Year Study,” Current Science, Vol. 75, No. 2, July 1998, pp. 123-138. [18] “Ambient Air Quality Status of Kolkata with Reference to Ozone, VOCs Including Carbonyls,” Report Submitted by NEERI to Central Pollution Control Board, New Delhi, February 2010. [19] P. K. Srivastava, G. G. Pandit, S. Sharma and A. M. Mohan Rao, “Volatile Organic Compounds in Indoor En- vironments in Mumbai, India,” The Science of the Total Environment, Vol. 255, No. 1, 2000, pp. 161-168. doi:10.1016/S0048-9697(00)00465-4 [20] R. Vasani, A. Srivastava and S. Wachasunder, “Health Effects of Indoor VOCs and Its Identification by GC- MS,” ISMAS Silver Jubilee Symposium on Mass Spec- trometry, NIO Dona Paula, Goa, 27-31 January 2003. [21] S. Patil, A. Srivastava and S. Wachasunder, “Qualitative and Quantitative Estimation of Volatile Organic Com- pounds inside Parked Car,” ISMAS Silver Jubilee Sympo- sium on Mass Spectrometry, NIO Dona Paula, Goa, 27-31 January 2003. [22] Som, C. Dutta, A. Chatterjee, D. Mallick, T. K. Jana and S. Sen, “Studies on Commuters’ Exposure to BTEX in Passenger Cars in Kolkata, India,” Science of the Total Environment, Vol. 372, No. 2-3, 2007, pp. 426-432. doi:10.1016/j.scitotenv.2006.09.025 [23] P. K. Srivastava, G. G. Pandit, S. Sharma and A. M. M. Rao, “Ambient Levels of Benzene and Other Aromatic Hydrocarbons in Mumbai,” Proceedings of Nature on Environment, B’lore Univ, June 2000. [24] A. Srivastava, S. N. Nair and A. E. Joseph, “Ambient Concentration of Benzene in Air Due to Vehicular Movement in Mumbai,” Current Science, Vol. 91, No. 10, November 2006, pp. 1-5. [25] A. Srivastava, A. E. Joseph and S. Nair, “Ambient Levels of Benzene in Mumbai City,” International Journal of Environmental Health Research, Vol. 14, No. 3, June 2004, pp. 215-222. doi:10.1080/0960312042000218624 [26] A. Srivastava and R. N. Singh, “Use of Multimedia Mass Balance Model to Predict Concentrations of Benzene in Microenvironment in Air,” Environmental Modelling & Software, Vol. 20, No. 1, 2005, pp. 1-5. doi:10.1016/j.envsoft.2004.04.003 [27] Dutta, D. Som, A. Chatterjee, A. K. Mukherjee, T. K. Jana and S. Sen, “Mixing Ratios of Carbonyls and BTEX in Ambient Air of Kolkata, India and Their Associated Health Risk,” Environmental Monitoring and Assessment, Vol. 148, No. 1-4, 2009, pp. 97-107. doi:10.1007/s10661-007-0142-0 [28] B. K. Padhi and P. K. Padhy, “Urinary Phenol as a Bio- marker of Exposure to Benzene from Occupational Ex- posures,” International Conference on Biomarkers in Health and Environmental Management & XXXII Annual Meet of Environmental Mutagen Society of India, Coim- batore, 10-12 January 2007. [29] P. K. Padhy, “Plants and Air Pollution, Current Issues in Environmental and Fish Biology,” Proceedings of UGC- DSA National Seminar on Environmental and Fish Biol- ogy, Shantiniketan, 1-3 February 2002. [30] P. K. Padhy and C. K. Varshney, “Emission of Volatile Organic Compounds (VOC) from Tropical Plant Species in India,” Chemosphere, Vol. 59, No. 11, 2005, pp. 1643- 1653. doi:10.1016/j.chemosphere.2005.01.046 [31] P. K. Padhy and C. K. Varshney, “Isoprene Emission from Tropical Tree Species,” Environmental Pollution, Vol. 135, 2005, pp. 101-109. doi:10.1016/j.envpol.2004.10.003 [32] Srivastava and D. Som, “Hazardous Air Pollutants in Industrial Area of Mumbai–India,” Chemosphere, Vol. 69, 2007, pp. 458-468. doi:10.1016/j.chemosphere.2007.04.050 [33] A. K. Mukherjee, S. K. Bhattacharya, S. Ahmed, S. K. Copyright © 2011 SciRes. JEP  Ambient Air Non-Methane Volatile Organic Compound (NMVOC) Study Initiatives in India - a Review35 Roy, A. Roychowdhury and S. Sen, “Exposure of Drivers and Conductors to Noise, Heat, Dust and Volatile Or- ganic Compounds in the State Transport Special Buses of Kolkata City,” Transportation Research Part D, Vol. 8, 2003, pp. 11-19. doi:10.1016/S1361-9209(02)00015-9 [34] P. Chitralekha, M. Balaji, S. Subramanian and D. P. Padiyan, “Sensing Properties of Polyoxomolybdate Doped Polyaniline Nanomaterials for Oxidising and Re- ducing Volatile Organic Compounds,” Current Applied Physics, Vol. 10, No. 2, 2010, pp. 457-467. doi:10.1016/j.cap.2009.07.005 [35] K. Ghoshal and S. D. Manjare, “Selection of Appropriate Adsorption Technique for Recovery of VOCs: An Analy- sis,” Journal of Loss prevention in the Process Industries, Vol. 15, No. 6, 2002, pp. 413-421. doi:10.1016/S0950-4230(02)00042-6 [36] F. I. Khan and A. K. Ghoshal, “Removal of Volatile Or- ganic Compounds from Polluted Air,” Journal of Loss Prevention in the Process Industries, Vol. 13, 2000, pp. 527-545. doi:10.1016/S0950-4230(00)00007-3 [37] V. Gupta and N. Verma, “Removal of Volatile Organic Compounds by Cryogenic Condensation Followed by Adsorption,” Chemical Engineering Science, Vol. 57, 2002, pp. 2679-2696. doi:10.1016/S0009-2509(02)00158-6 [38] P. Dwivedi, V. Gaur, A. Sharma and N. Verma, “Com- parative Study of Removal of Volatile Organic Com- pounds by Cryogenic Condensation and Adsorption by Activated Carbon Fiber,” Separation and Purification Technology, Vol. 39, 2004, pp. 23-37. doi:10.1016/j.seppur.2003.12.016 [39] Das, V. Gaur and N. Verma, “Removal of Volatile Or- ganic Compound by Activated Carbon Fiber,” Carbon, Vol. 42, 2004, pp. 2949-2962. doi:10.1016/j.carbon.2004.07.008 [40] N. Mohan, G. K. Kannan, S. Upendra, R. Subha and N. S. Kumar, “Breakthrough of Toluene Vapours in Granular Activated Carbon Filled Packed Bed Reactor,” Journal of Hazardous Materials, Vol. 168, No. 1, 2009, pp. 777- 781. doi:10.1016/j.jhazmat.2009.02.079 [41] Das, A. K. Banthia and B. Adhikari, “Removal of Chlo- rinated Volatile Organic Contaminants from Water by Pervaporation Using a Novel Polyurethane Urea-Poly (Methyl Methacrylate) Interpenetrating Network Mem- brane,” Chemical Engineering Science, Vol. 61, 2006, pp. 6454-6467. doi:10.1016/j.ces.2006.06.014 [42] S. Ray, N. R. Singha and S. K. Ray, “Removal of Tetra- hydrofuran (THF) from Water by Pervaporation Using Homo and Blend Polymeric Membranes,” Chemical En- gineering Journal, Vol. 149, No. 1-3, 2009, pp. 153-161. doi:10.1016/j.cej.2008.10.013 [43] S. M. Maliyekkal, E. R. Rene, L. Philip and T. Swamina- than, “Performance of BTX Degraders under Substrate Versatility Conditions,” Journal of Hazardous Materials, Vol. B109, 2004, pp. 201-211. doi:10.1016/j.jhazmat.2004.04.001 [44] Singh and M. H. Fulekar, “Benzene Bioremediation Us- ing Cow Dung Microflora in Two Phase Partitioning Bioreactor,” Journal of Hazardous Materials, Vol. 175, No. 1-3, 2010, pp. 336-343. doi:10.1016/j.jhazmat.2009.10.008 [45] S. M. Prakash and S. K. Gupta, “Biodegradation of Tet- rachloroethylene in Upflow Anaerobic Sludge Blanket Reactor,” Bioresource Technology, Vol. 72, No. 1, 2000, pp. 47-54. doi:10.1016/S0960-8524(99)90090-1 [46] S. Mudliar, B. Giri, K. Padoley, D. Satpute, R. Dixit, P. Bhatt, R. Pandey, A. Juwarkar and A. Vaidya, “Bioreac- tors for Treatment of VOCs and Odours - a Review,” Journal of Environmental Management, Vol. 91, No. 5, 2010, pp. 1039-1054. doi:10.1016/j.jenvman.2010.01.006 [47] E. R. Rene, D. V. S. Murthy and T. Swaminathan, “Per- formance Evaluation of a Compost Biofilter Treating Toluene Vapours,” Process Biochemistry, Vol. 40, No. 8, 2005, pp. 2771-2779. doi:10.1016/j.procbio.2004.12.010 [48] R. S. Singh, S. S. Agnihotri and S. N. Upadhyay, “Re- moval of Toluene Vapour Using Agro-Waste as Biofilter Media,” Bioresource Technology, Vol. 97, No. 18, 2006, pp. 2296-2301. [49] A. K. Mathur, J. Sundaramurthy and C. Balomajumder, “Kinetics of the Removal of Mono-Chlorobenzene Va- pour from Waste Gases Using a Trickle Bed Air Biofil- ter,” Journal of Hazardous Materials, Vol. B137, 2006, pp. 1560-1568. doi:10.1016/j.jhazmat.2006.04.042 [50] A. K. Mathur, C. B. Majumdar and S. Chatterjee, “Com- bined Removal of BTEX in Air Stream by Using Mixture of Sugar Cane Bagasse, Compost and GAC as Biofilter Media,” Journal of Hazardous Materials, Vol. 148, 2007, pp. 64-74. doi:10.1016/j.jhazmat.2007.02.030 [51] T. Mishra, P. Mohapatra and K. M. Parida, “Synthesis, Characterisation and Catalytic Evaluation of Iron-Manga- nese Mixed Oxide Pillared Clay for VOC Decomposition Reaction,” Applied Catalysis B: Environmental, Vol. 79, 2008, pp. 279-285. doi:10.1016/j.apcatb.2007.10.030 [52] K. M. Parida and A. Samal, “Catalytic Combustion of Volatile Organic Compounds on Indian Ocean Manga- nese Nodules,” Applied Catalysis A: General, Vol. 182, No. 2, 1999, pp. 249-256. doi:10.1016/S0926-860X(99)00015-0 [53] S. K. Samantaray and K. M. Parida, “Modified TiO2– SiO2 Mixed Oxides: 1. Effect of Manganese Concentra- tion and Activation Temperature towards Catalytic Com- bustion of Volatile Organic Compounds,” Applied Ca- talysis B: Environment, Vol. 57, 2005, pp. 83-91. [54] C. S. Maji and A. N. Bhaskarwar, “Pollution-Preventing Anionic Lithographic Inks,” Journal of Hazardous Mate- rials, Vol. B105, 2003, pp. 103-119. doi:10.1016/j.jhazmat.2003.07.007 [55] N. Srivastava, A. Roy, N. Pant, H. Nagpal, C. R. Vohra and A. N. Bhaskarwar, “Pollution Preventing Microemul- sion Inks,” Chemical Engineering Science, Vol. 60, 2005, pp. 1725-1731. doi:10.1016/j.ces.2004.10.029 Copyright © 2011 SciRes. JEP  Ambient Air Non-Methane Volatile Organic Compound (NMVOC) Study Initiatives in India - a Review Copyright © 2011 SciRes. JEP 36 [56] K. S. Nesamani, “Estimation of Automobile Emissions and Control Strategies in India,” Science of the Total En- vironment, Vol. 408, No. 8, 2010, pp. 1800-1811. doi:10.1016/j.scitotenv.2010.01.026 [57] S. Patil, A. More and A. Srivastava, “Qualitative and Quantitative Detection of Volatile Organic Emissions from Vehicle Tyres,” Pollution Research, Vol. 23, No. 4, 2004, pp. 681-686.
|