Paper Menu >>
Journal Menu >>
 Journal of Environmental Protection, 2011, 2, 11-20 doi:10.4236/jep.2011.21002 Published Online March 2011 (http://www.SciRP.org/journal/jep) Copyright © 2011 SciRes. JEP 11 BTEX in Ambient Air of a Metropolitan City D. Majumdar (née Som)1, A. K. Mukherjeea2, S. Sen1 1Department of Chemistry, Calcutta University, Kolkata, India; 2Regional Occupational Health Centre (Eastern), Kolkata, India. Email: dipanjalisom@gmail.com Received September 29th, 2010; revised November 11th, 2010; accepted December 20th, 2010. ABSTRACT The environmental fate, global warming effect and human health risk from mono aromatic VOCs are of major concerns among many consequences of their anthropogenic emission. In more than a yearlong study (November 2003 to Febru- ary 2005) of the city air in Kolkata, India at different seasons in three different sites, the seasonal mean benzene and toluene concentrations varied between 13.8 - 72.0 μg/m3 and 21.0 - 83.2 μg/m3 respectively along all the sites. The en- vironmental distribution and load of BTEX (Benzene, Toluene, Ethylbenzene and isomers of Xylene) in different envi- ronmental compartment was estimated using a multimedia mass balance model, TaPL3. The total environmental load of BTEX together was estimated to be 9.7 × 10⁴ kg. Contribution of Kolkata metropolitan city towards global warming due to environmental emission of BTEX has been estimated as 1.9 × 10⁵ tons of carbon dioxide equivalent per year which is about 1.1% of yearly direct CO2 emission the city. The consequence of BTEX emission towards human health has been estimated in terms of non-cancer and cancer risk in population due to their inhalation exposure. The cumulative lifetime cancer risk for benzene and ethylbenzene was found to be higher than the acceptable value and range between 3.0 × 10⁵ and 8.9 × 10⁶ in three sites, although the non-cancer health risk was found to be within acceptable limit. Keywords: Multimedia Mass Balance, Seasonal Variation, Global Warming, Health Risk, Kolkata 1. Introduction The fate of a chemical in the environment is controlled by its physico-chemical properties, the nature of intro- duction of the chemical in the environment [1] and also by the environmental conditions. Volatile organic com- pounds (VOCs) are omnipresent in lower urban atmos- phere. Various typical anthropogenic activities like in- tense transportation, industrial and commercial activities prevailing in urban areas particularly in metropolitan cities [2-4] in addition to natural emissions are responsi- ble for elevated VOC levels in urban air [5]. The mono-aromatic volatile compounds like benzene, toluene, ethylbenzene, xylenes (BTEX), emitted to the ambient air, constantly take part in partitioning and dis- tribution between the major environmental compartments like water, soil, vegetation etc. or it may entail partition- ing between phases within an environmental compart- ment [6]. Multimedia mass balance models are simple mathe- matical descriptions of the natural environment designed to gain qualitative and quantitative understanding of the environmental distribution and fate of chemicals. These models can be effectively used to describe the fate of the chemicals such as VOCs in different subdivision of en- vironmental compartments having homogeneous envi- ronmental characteristics and chemical concentration by integrating information of multiple and interacting proc- ess of partitioning, transport and transformation [1,7-9]. Several models and software packages have been devel- oped and efficiently used for assessing chemical fate in the environment on a regional scale, e.g., EUSES and ChemCAN in Japan [10]; QWASI in West Yorkshire, United Kingdom [11]; TaPL3 in Mumbai, India [12]. Worldwide rapid urbanization, industrialization and consumerism are resulting in increasing emission of CO2 and other Green House Gases (GHGs) along with VOCs. The most significant increase of energy consumption and GHG emissions are taking place in metropolitan cities which have rapidly expanding populations enjoying higher living standards and material affluence than the people living in rural areas and smaller cities [13]. VOCs are considered as contributors to global warming by In- tergovernmental Panel for Climate Change (IPCC) be- cause of their chemical reactivity and their potential to produce tropospheric ozone and other photochemical oxidant. Metropolitan cities thus have significant contri- bution towards the total national as well as global emis- sion of GHGs including CO2 and VOCs. Although the yearly CO2 emission load for Kolkata is reported [13] but  BTEX in Ambient Air of a Metropolitan City 12 neither a comprehensive VOC emission inventory is available nor the global warming consequences of VOC emission of any city have ever been estimated. Besides their environmental effects, VOCs also have many harmful effects to human health even at lower concentrations, affecting different target organs e.g. cen- tral nervous systems, respiratory system, liver, kidney, reproductive systems etc. [14,15]. The VOCs, in general, have a positive correlation with severe symptoms of asthma among children [16]. Many of these especially benzene has been confirmed as human carcinogen both by International Agency on Research on Cancer (IARC) and American Conference of Governmental Industrial Hygienist (ACGIH). Risk assessments for the toxic pollutants are widely used in different countries as a regulatory decision- making processes to combat air pollution. In a risk as- sessment, the extent to which a population is or may be exposed to a certain chemical is determined, and the ex- tent of exposure is considered in relation to the kind and degree of hazard posed by the chemical, thereby permit- ting an estimate of the potential health risk due to that chemical for the population involved [17]. By perform- ing non-cancer and cancer risk assessment, the extent of the possible health damage of the general population due to environmental exposure to VOCs can be assessed. The human health risk assessment process includes exposure assessment that determines the magnitude and duration of the exposures and risk estimation. The likelihood of adverse effects on direct human exposure via inhalation is understood from risk estimation [18]. In the present study, the ambient seasonal concentra- tion of BTEX in a metropolitan city, namely Kolkata, India, have been measured to estimate the total elevated environmental load of these target VOCs utilizing TaPL3 multimedia mass balance model. Contribution of Kolkata metropolitan city towards global warming due to its en- vironmental load of BTEX has been estimated as carbon dioxide equivalent. Estimation of non-cancer health haz- ard as well as integrated lifetime cancer Risk (ILCR) due to the inhalation exposure of the general city population towards BTEX was also made. 2. Methodology 2.1. Study Area Three monitoring sites, was selected geographically for ambient air sampling. All the sites were a combination of commercial and residential area with several small-scale industries scattered intermittently. The details of the three sites, Site N in Northern Kolkata, Site C in Central Kolkata and Site S in Southern Kolkata, are as follows: Site N: Situated in North Kolkata at ~10 m away from the main arterial road connecting North and South Kol- kata at a height of 5 m. Mainly residential and some commercial activities were prevailing in the surrounding area. Site C: Situated in the Central Kolkata at about 5m height at a distance of ~5 m away from the major road connecting Central Kolkata to the city railway station. There was an open ground with greeneries in front of the sampling site at other side of the road. The surrounding areas were mainly used for commercial purposes along with some residential activities. Minor small scale indus- trial activity can also be noticed in the adjacent area. Site S: Located in South Kolkata at a height of about 7 m and ~5 m away from a major road connecting southern and eastern part of the megacity. The area around the sampling site was populated with various small and me- dium scale industries. Some commercial and residential activities were also noticed in the adjacent area. Transportation activity was prominent in all the three sites same as in the rest of the city. 2.2. Sampling Period Air sampling was performed at the selected sites (Site N, C and S) in dry seasons during the period from Decem- ber 2003 to February 2005. The monitoring were done in winter (December ’03 - February ’04 & December ’04– February ’05), summer (March ’04 - June ’04) and post monsoon (September ’04 - November ’04). The moni- toring was continued up to the next winter. 15-18 sam- ples per season (except in winter ’03 - ’04; 9 samples) were collected in each site with a total of 152 samples. 2.3. Sampling Procedure Air sampling for VOCs were conducted at the selected sites between 9:00 AM and 6:00 PM. VOCs were col- lected in sorbent tubes containing activated charcoal (60- 80 mesh), spread in two compartments (100/50mg) by drawing air through a constant flow low volume pump (SKC, USA) at a rate of 0.1 LPM or less for about 4-5 hours each. 2.4. Determination of BTEX The charcoal was desorbed in 1 ml of carbon disulfide (CS2) for 1-1.5 hour and analysed for benzene, toluene, ethylbenzene, and three isomers of xylenes. Quantifica- tion was done on a Gas Chromatograph (Perkin Elmer, Auto System XL GC) equipped with a Flame Ionization Detector. Separation of the analytes was achieved by PE 624 (Perkin Elmer) capillary column, isothermally at 100˚C. Detector and injector temperature were main- tained at 200˚C and 180˚C respectively. Copyright © 2011 SciRes. JEP  BTEX in Ambient Air of a Metropolitan City13 The samples were quantified against five-point cali- bration curve prepared from standard pure substances (Aldrich, USA) at different dilutions in CS2 containing each of the six analytes. Fluorobenzene was used as in- ternal standard to avoid injection error and error from trace benzene content in the solvent. 2.5. Quality Control Duplicate measurements were done for 10% samples using dual holders of which the analytical results were highly correlated (r2 = 0.99). Sampling flow rates of all the pumps were determined using Ultra-flo Calibrator (SKC Inc. USA) before and after sampling. Field blank test and breakthrough test were done to ensure quality control. 3. Calculations 3.1. Determination of Multimedia Partitioning, Persistence and LRT of BTEX The percentage distribution of the target pollutant in five well mixed environmental compartment namely air, wa- ter, soil, sediment and vegetation can be predicted along with their long-range transport (LRT) potential and over- all environmental persistence using TaPL3 model (soft- ware copyright 2000, version 3.0, Canadian Environ- mental Modeling Centre). This simulation tool is a fuga- city-based Level III multimedia mass balance model [16] that uses a default value for the total emission of 1000 kg/h into a single mobile medium (air or water) and re- turns the total environmental load in the system. The probable emission of the target VOCs in the system un- der examination is estimated from the actual environ- mental load as calculated from measured concentration in air assuming a linear relationship between the two. Re- quired input for the model used in the simulation for the target pollutant is given in Table 1. 3.2. Determination of Global Worming Consequences of BTEX BTEX are non methane volatile organic compounds (NMVOC) and they have two fold contributions towards climate change [25,26]. 1) The primary contribution arises from their indirect chemical effect on the atmosphere. VOCs influence cli- mate through production of organic aerosols and their involvement in photochemistry, i.e., production of O3 in presence of NOx and sunlight [27]. 2) The secondary contribution is due to the eventual production of CO2 from the atmospheric degradation of the VOC and determined by the amount of carbon pre- sent therein. The CO2 equivalent emissions arising from 1) is given by: 2 CO p rimaryvoc voc GWP m (1) Where, CO2primary is CO2 equivalent in tons, mvoc is the number of tons of the VOC emitted and GWPvoc is the indirect Global Warming Potential (GWP) for the par- ticular VOC species. The GWP of a VOC species com- pares the radiative forcing of a ton of a GHG over a given time period (say, 100 years) to a ton of CO2 [25]. Estimation of GWPs requires complicated calculation involving powerful models and the values for many VOCs have been reported by the Intergovernmental Panel on Climate Change [27]. Unfortunately, the GWPs of BTEX are not available and an indirect GWP value of 10 is assumed for each of them [26] in our calculation. The secondary CO2 equivalent emissions arising from (2) depends on the number of carbon atoms in the VOC, its molecular weight and the mass of the VOC released. 2 CO 44 s econdaryvoc vocvoc nmMW (2) Where, nvoc is the number of carbon atoms in a mole- cule of the VOC, MWvoc is its molecular weight in g/mole and CO2secondary is in tons of CO2 ‘44’ refers to the mo- lecular weight of CO2. Thus the total CO2 equivalent emissions (in tons) aris- ing from the direct release of the VOC is 22 2 CO COCO equivprimary secondary (3) 3.3. Determination of Inhalation Exposure and Risk In the current study, the non-cancer hazard and integrated life time cancer risk (ILCR) due to the exposure to a few VOCs at their prevailing level were estimated. The daily exposure (E) of an individual due to intake process (con- sidering inhalation only) was calculated from the Equa- tion (1) [18]: ECIRaEDaBWa (1) The chronic non-cancer hazard index was estimated using daily exposure E. The integrated lifetime cancer risk (ILCR) upon an individual for residing in the area for 15 years was estimated from the effective life time exposure, EL (Equation (2)). L EED 7WK 52YE YL (2) The description of the variables used here is tabulated below. Copyright © 2011 SciRes. JEP  BTEX in Ambient Air of a Metropolitan City Copyright © 2011 SciRes. JEP 14 Table 1. Chemical and environmental par ame ters for running TaPL3 simulation. Chemical parameters VOC pollutant Benzene Toluene Ethylbenzene Xylene molar mass (g mole-1) 78 92 106 106 Vapour Pressurea VP (Pa) 12672.2 3769.3 1276.7 1074.0 Octanol-carbon partition co-efficienta K oc 55.1 139 228 271 Octanol-air partition co-efficientb K oa 465 1471 3080 3245 Octanol-water partition co-efficienta K ow 150 480 1300 1300 Dimensionless Henry’s law constantc K h 0.289 0.325 0.422 0.357 Partition co-efficient (dimentionless)d water-air 4.35 3.76 3.02 3.61 soil-air 47.7 150.8 315.7 332.6 sediment-air 47.7 150.8 315.7 332.6 suspended particles-air473.5 1591.8 4699.6 5586.4 Fish-air 23.3 73.6 154.0 162.3 aerosol-air 473.5 1591.8 4699.6 5586.4 vegetation-air 6.0 12.4 23.2 27.4 Half life (h) ina Air 141.8 57.1 47.0 23.3 Water 267.6 312.0 156.0 420.0 Soil 4564.8 682.3 156.0 362.4 Sediment 5359.0 2568.0 2772.0 4404.0 vegetatione 1000 1997.12 1000 1000 Environmental parameters System Areaf 1785.0 km2 Area of waterf 59.2 km2 Vegetation fraction of total areaf 0.35 Mixing height 400 m Wind velocity 2.0 km h-1 Water velocity 0.5 km h-1 aDatabase available with CalTOX™, Version 1.5 [19]. b[20] c[21]. dCalculated [22]; except for fish-air partition coefficient (KFA), KFA = VL x Koa, where VL is the volume fraction of lipid in fish. eDue to in non-availability of data, half life of 1000 hour has been assumed for benzene, ethylbenzene and xylene in vegetation compartment. Value for toluene was calculated from Fostera et al. [23]. f[24]. Variable Description Value Units E Daily Exposure mg/kg/day C Concentration of the pollutant mg/m3 IRa Inhalation rate, adult 0.83* m3/hr EDa Exposure Duration, adult 10 hr/d Bwa Body Weight, adult 70 kg D Days per Week Exposure 7 d WK Weeks of Exposure 52 d YE Years of Exposure 15 y YL Years in Lifetime 75 y 3.3.1. Calculation of Chronic Non-Cancer Risk Non-cancer risks were expressed as Hazard Quotient (HQ), which is defined as the ratio between the yearly average daily dose received, EY and the response dose, RfD (a level below which adverse health effects are not likely to occur). This algorithm were used to calculate chronic non- cancer risk (i.e., risk associated with long-term expo- sures), using chronic RfDs. Summation of HQs for indi- vidual contaminants gave Hazard Index (HI). 3.3.2. Calcul a t i on of Cancer Ri sk Cancer risks was calculated from the Equation (3) 11 1 L RiskEmgkgdSFmgkg d (3) *Ref.: [18].  BTEX in Ambient Air of a Metropolitan City15 Where, SF is the slope factor or carcinogenic potency slope. 4. Result & Discussion 4.1. Ambient Level of BTEX and Their Seasonal Variation Mean VOC concentrations at three monitoring sites dur- ing December 2003 to February 2005 and their seasonal variation are shown in Figure 1. There is hardly any de- marcation of areas for distinct activities like residential, industrial, commercial etc. in most part of the Kolkata mega-city and the difference in concentration in all the sites are thus not statistically significant. Toluene was found to be the most abundant component followed by benzene. Seasonal mean concentrations varied between Figure 1. Seasonal levels of BTEX in three monitoring sites in Kolkata City. Copyright © 2011 SciRes. JEP  BTEX in Ambient Air of a Metropolitan City 16 13.8 - 72.0 μg/m3 for benzene, 21.0 - 83.2 μg/m3 for tolu- ene, 7.6 - 21.6 μg/m3 for ethyl benzene, 22.1 - 57.3 μg/m3 for m-& p-xylene (combined) and 7.8 - 21.2 μg/m3 for o-xylene with overall geometric mean levels of 29.2, 45.4, 13.1, 32.9 and 11.9 μg/m3 respectively. The highest values observed for benzene and toluene was 177.2 μg/m3 and 174.9 μg/m3 respectively during winter ’04 - ’05, at site S. More than a decade ago, Samanta et al. [28] re- ported enormously high values for BTX (benzene, 192 - 18,816 μg/m3; toluene, 98 - 3139 μg/m3 and xylene, 153 - 2037 μg/m3) in Kolkata atmosphere. Since then some effective measure was taken by the State Pollution Con- trol Board to wind up unauthorized small scale industries responsible for VOC emission in and around Kolkata. More over, the decrease of BTEX level is due to the di- rectives of the Government of India in lowering the per- missible limit of benzene up to 3% in metro cities in- cluding Kolkata after 2001 and also the mandatory use of Bharat Stage II (equivalent to EURO II) vehicles after year 2002. An overall fairly good correlation (r2 = 0.62 to 0.83) among the BTEX were found except between benzene and o-xylene (0.51) indicating a predominant common source, namely vehicular emission. One way analysis of variance (ANOVA) shows that except for benzene, seasonal variation is significant (p ≤ 0.01). The site-wise toluene to benzene ratio ranged from 1.3 - 2.2 with an overall average of 1.7 which is typical of urban environment. Table 2 gives a comparative account of the level and seasonal trend obtained in the current study with a few other urban areas worldwide. The city experiences a hu- mid and tropical climate. The temperature measured at different sites during the study period found to vary be- tween 13.5˚C to 29.0˚C in winter months and 29.0˚C to 39.0˚C during summer months. Wind speed recorded in all sites during winter months varied between 0.03 to 3.30 m/s and during summer months, 0.10 to 3.70 m/s. Calm conditions prevail frequently during winter months, and are more common in the evening hours. Relative humidity remains quite high throughout the year. The relative humidity varied from 34% to 89% during winter months and 44% to 86% during summer months. The target VOCs showed higher average level in most cases in winter season compared to summer or post- monsoon may be due to the lower mixing height and less dispersion during winter. The photochemical reactivity of toluene, ethylbenzene and xylenes which leads to the formation of carbonyls through reaction with hydroxyl radical plays important role in their removal during hot tropical summer with bounty of sunlight. Relatively lesser photochemical reactivity of benzene [37] may ex- plain the higher level (though not statistically significant) during winter caused by lowered mixing height and dis- persion. 4.2. Environmental Distribution of BTEX The percentage distribution and probable load of BTEX in different environmental compartments for their direct and continuous release in air was estimated using TaPL3 multimedia mass balance model (Table 3). Out of the five segments, there was negligible partitioning in vege- tation and thus not incorporated in table. Air is expect- edly the most favorable compartment of residence for principal part of all the target pollutants with dominant load. A small amount of distribution of these compounds was found in soil followed by water. Trace amount of partitioning was observed in the sediment compartment. The total environmental load is highest for toluene and xylenes (3.3 × 10⁴ kg both) followed by benzene (2.1 × 10⁴ kg) and ethylbenzene (9.5 × 10³ kg). Considering the target VOCs, the total environmental load was calculated as 9.7 × 10⁴ kg. Table 4 compares the emission rates of the pollutants and their fate in the environment. Esti- mated hourly emission rate was highest for xylenes fol- lowed by toluene, ethylbenzene and benzene. The per- sistence and long range transport (LRT) were highest for benzene and lowest for xylenes which commensurate with the relative reactivity of the mono-aromatics. The persistence of benzene was found to be 2.5, 3.0 and 6.1 times higher than toluene, ethylbenzene and xylene re- spectively. This is reflected in the observation that the concentration ratios with respect to benzene i.e., T/B, E/B and X/B emission ratio obtained from the model are 3.9, 1.4 and 9.5 respectively whereas the T/B, E/B and X/B concentration ratio in air is only 1.7, 0.4 and 1.6. The LRT denotes that at least for benzene this city acts as an area source for surrounding suburban and rural areas within 400 km radius. An estimation of yearly emission for BTEX in Kolkata metropolitan city is presented in Table 4. The total estimated emission for BTEX is as high as 1.4 × 10⁴ tons per year which is comparable to the esti- mated evaporative emission of 1.1 × 10⁵ tons per year for total hydrocarbon reported for Kolkata in emission in- ventories for VOCs in metro cities [38]. 4.3. Global Warming Consequences of BTEX Emission in City Air The global warming consequences for BTEX emission in the city environment, expressed as CO2 equivalent esti- mated using Equations 1, 2 and 3, is also given in Table 4. Our study shows that 1.9 × 10⁵ tons of CO2 equiva- lents of only BTEX are being emitted per year from Kolkata metropolitan city. The total yearly CO2 emission of Kolkata city in the year 2000 has been estimated to be 1.7 × 10⁷ tons, which is 2.2% of national CO2 emission Copyright © 2011 SciRes. JEP 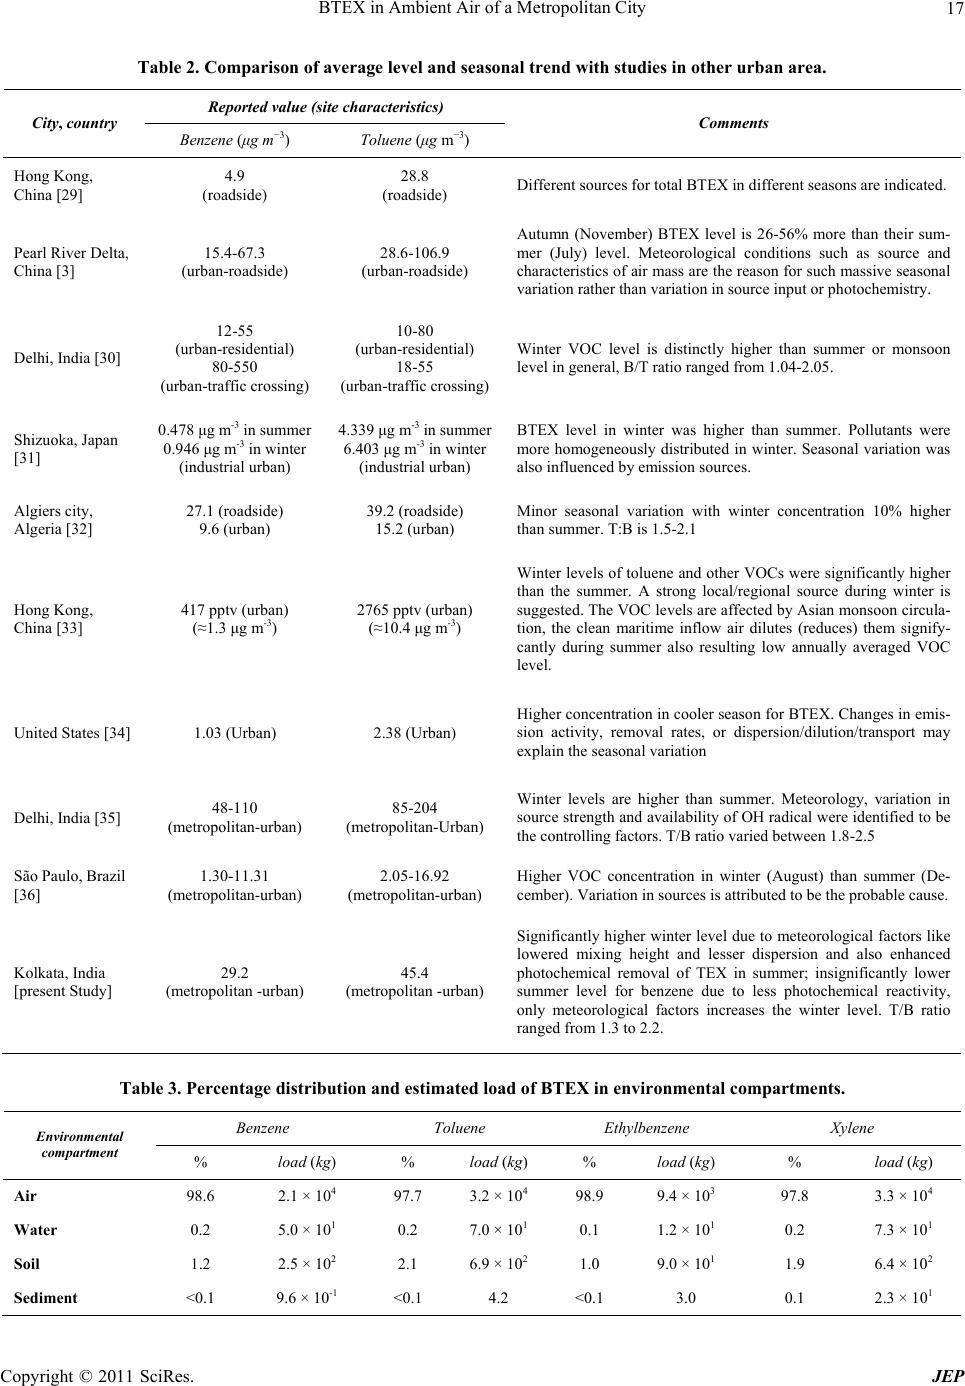 BTEX in Ambient Air of a Metropolitan City17 Table 2. Comparison of average level and seasonal trend with studies in other urban area. Reported value (site characteristics) City, country Benzene (μg m−3) Toluene (μg m−3) Comments Hong Kong, China [29] 4.9 (roadside) 28.8 (roadside) Different sources for total BTEX in different seasons are indicated. Pearl River Delta, China [3] 15.4-67.3 (urban-roadside) 28.6-106.9 (urban-roadside) Autumn (November) BTEX level is 26-56% more than their sum- mer (July) level. Meteorological conditions such as source and characteristics of air mass are the reason for such massive seasonal variation rather than variation in source input or photochemistry. Delhi, India [30] 12-55 (urban-residential) 80-550 (urban-traffic crossing) 10-80 (urban-residential) 18-55 (urban-traffic crossing) Winter VOC level is distinctly higher than summer or monsoon level in general, B/T ratio ranged from 1.04-2.05. Shizuoka, Japan [31] 0.478 μg m-3 in summer 0.946 μg m-3 in winter (industrial urban) 4.339 μg m-3 in summer 6.403 μg m-3 in winter (industrial urban) BTEX level in winter was higher than summer. Pollutants were more homogeneously distributed in winter. Seasonal variation was also influenced by emission sources. Algiers city, Algeria [32] 27.1 (roadside) 9.6 (urban) 39.2 (roadside) 15.2 (urban) Minor seasonal variation with winter concentration 10% higher than summer. T:B is 1.5-2.1 Hong Kong, China [33] 417 pptv (urban) (≈1.3 μg m-3) 2765 pptv (urban) (≈10.4 μg m-3) Winter levels of toluene and other VOCs were significantly higher than the summer. A strong local/regional source during winter is suggested. The VOC levels are affected by Asian monsoon circula- tion, the clean maritime inflow air dilutes (reduces) them signify- cantly during summer also resulting low annually averaged VOC level. United States [34] 1.03 (Urban) 2.38 (Urban) Higher concentration in cooler season for BTEX. Changes in emis- sion activity, removal rates, or dispersion/dilution/transport may explain the seasonal variation Delhi, India [35] 48-110 (metropolitan-urban) 85-204 (metropolitan-Urban) Winter levels are higher than summer. Meteorology, variation in source strength and availability of OH radical were identified to be the controlling factors. T/B ratio varied between 1.8-2.5 São Paulo, Brazil [36] 1.30-11.31 (metropolitan-urban) 2.05-16.92 (metropolitan-urban) Higher VOC concentration in winter (August) than summer (De- cember). Variation in sources is attributed to be the probable cause. Kolkata, India [present Study] 29.2 (metropolitan -urban) 45.4 (metropolitan -urban) Significantly higher winter level due to meteorological factors like lowered mixing height and lesser dispersion and also enhanced photochemical removal of TEX in summer; insignificantly lower summer level for benzene due to less photochemical reactivity, only meteorological factors increases the winter level. T/B ratio ranged from 1.3 to 2.2. Table 3. Percentage distribution and estimated load of BTEX in environmental compartments. Benzene Toluene Ethylbenzene Xylene Environmental compartment % load (kg) % load (kg) % load (kg) % load (kg) Air 98.6 2.1 × 10⁴ 97.7 3.2 × 10⁴ 98.9 9.4 × 10³ 97.8 3.3 × 10⁴ Water 0.2 5.0 × 101 0.2 7.0 × 101 0.1 1.2 × 101 0.2 7.3 × 101 Soil 1.2 2.5 × 10² 2.1 6.9 × 10² 1.0 9.0 × 101 1.9 6.4 × 10² Sediment <0.1 9.6 × 10⁻¹ <0.1 4.2 <0.1 3.0 0.1 2.3 × 101 Copyright © 2011 SciRes. JEP  BTEX in Ambient Air of a Metropolitan City 18 Table 4. LRT, persistence and emissions of BTEX in environment. Parameters Benzene Toluene Ethylbenzene Xylene LRT (km) 409 164 135 67 Persistence (day) 8.6 3.5 2.9 1.4 Emission rate (kg h-1) 102 394 138 968 Yearly emission (tons year-1) 8.94 × 10² 3.45 × 10³ 1.21 × 10³ 8.48 × 10³ Emission CO2-eqivalant (tons year-1) 1.2 × 10⁴ 4.6 × 10⁴ 1.6 × 10⁴ 1.1 × 10⁵ with only 1.6% of population [13]. Thus the CO2 equiva- lent of BTEX only represents almost 1.1% of the total emission of Kolkata and 0.002% of national CO2 emis- sion in addition to the total CO2 load. It is expected that the total hydrocarbon present in the city air has the po- tential to increase the level of CO2 even more. This indi- cates that the actual global warming consequence of emissions in city air is reasonably higher than the direct CO2 emission after considering the emission of VOCs. 4.4. Risk Assessment The concentrations of the BTEX were found to be quite high in the present study and their levels could be a real threat to the health of the city inhabitants. Table 5 gives the average daily exposure, average life time exposure, Individual Hazard Quotient (HQ) and ILTCR (for 15 years residence time for an individual). Effective life time exposure is maximum for xylene mixture and tolu- ene because of their higher ambient concentration fol- lowed by benzene and ethylbenzene. According to WHO the lifetime risk of chronic leuke- mia for benzene exposure of 1 µg/m3 is 4.4 – 7.6 × 10⁻⁶ [39] while ethylbenzene is classified as a group D car- cinogen [40]. The cancer risk calculated in the current study suggests the exposure level to be far from being safe for population residing for 15 years in the city. In all the three sites, the estimated cancer risk is more for ben- zene due its high carcinogenicity. Estimated cancer risk for all the individual components (except for ethyl ben- zene in Site N) exceeded the threshold value of 1 × 10⁻⁶ indicating significant cancer risk. In general, residents of Site S receive higher exposure from the pollutants in comparison to the other two sites and as a result the probability of cancer risk is higher in Site S. Assuming that the carcinogenic effect from different pollutant is additive, the cumulative cancer risk from benzene and ethylbenzene is maximum (3.0 × 10⁻⁵) in Site S, followed by Site C (1.9 × 10⁻⁵) and Site N (8.9 × 10⁻⁶). In spite of its lower exposure value, benzene gives the highest non-cancer HQ due to its low reference dose for adverse non-cancer health effect. Benzene is closely fol- lowed by xylenes in causing non-cancer health hazard. Table 5. Estimate of individual pollutant exposure, associ- ated non-cancer hazard and cancer risk. Daily exposure Effective life time exposure Pollutant Site (mg kg-1day-1) (mg kg-1day-1) Individual HQ ILCR Site N1.5E-03 3.0E-04 1.8E-018.3E-06 Site C3.3E-03 6.6E-04 3.9E-011.8E-05Benzene Site S5.2E-03 1.0E-03 6.0E-012.8E-05 Site N3.1E-03 6.2E-04 2.2E-03 Site C5.1E-03 1.0E-03 3.6E-03 Toluene Site S6.0E-03 1.2E-03 4.2E-03 Site N8.2E-04 1.6E-04 2.9E-036.3E-07 Site C1.5E-03 3.0E-04 5.2E-031.2E-06Ethylbenzene Site S1.7E-03 3.5E-04 6.1E-031.3E-06 Site N3.6E-03 7.1E-04 1.2E-01 Site C5.0E-03 1.0E-03 1.8E-01 Xylene mixture Site S5.7E-03 1.1E-03 2.0E-01 The individual HQs or the HI for BTEX did not exceed anywhere indicating no serious threat of chronic non- cancer health effect in pollutant specific target organs for the city population. 5. Conclusions Ambient concentration of Benzene, Toluene, Ethylben- zene and isomers of Xylene (BTEX) have been found to be appreciably high in Kolkata metropolitan city. After air compartment, BTEX was found to be residing in soil followed by water with the total environmental load of BTEX as high as 9.7 × 10⁴ kg. The prevailing benzene and ethylbenzene level is es- timated to pose significant cancer risk due to the inhala- tion exposure to the general city population. 6. Acknowledgements The authors’ sincerest thanks are due to Dr. Anjali Sri- Copyright © 2011 SciRes. JEP  BTEX in Ambient Air of a Metropolitan City19 vastava, Scientist & Head, Kolkata Zonal Laboratory, National Environmental Engineering Research Institute for her interest in the work. Thank is also due to Dr. K. Mukhopadhyay for his help during field work. REFERENCES [1] D. Mackay, W. Y. Shin and K. C. Ma, “Illustrated Hand- book of Physical Chemical Properties and Environmental Fate for Organic Chemicals,” CRC Press, Florida, 1997. [2] C. H. Lai and K. S. Chen, “Characteristics of C2-C15 Hy- drocarbons in the air of Urban Kaohsiung,” Taiwan. At- mospheric Environment, Vol. 38, No. 13, 2004, pp. 1997- 2011. [3] X. Wang, S. Guo, J. Fu, C. Chan, S. C. Lee, L. Y. Chan and Z. Wang, “Urban Roadside Aromatic Hydrocarbons in Three Cities of the Pearl River Delta, People’s Repub- lic of China,” Atmospheric Environment, Vol. 36, No. 33, 2002, pp. 5141-5148. [4] E. Ilgen, N. Karfich, K. Levsen, J. Angerer, P. Schneider, J. Heinrich, H. E. Wichmann, L. Dunemann and J. Bege- row, “Aromatic Hydrocarbons in the Atmospheric Envi- ronment: Part I. Indoor Versus Outdoor Sources, the In- fluence of Traffic,” Atmospheric Environment, Vol. 35, No. 7, 2001, pp. 1235-1252. [5] T. S. Leong, S. Muttamara and P. Laortanakul, “Influence of Benzene Emission from Motorcycles on Bangkok Air Quality,” Atmospheric Environment, Vol. 36, No. 4, 2002, pp. 651-661. [6] S. E. Manahan, “Environmental Chemistry,” CRC Press, Florida, 2004. [7] TRIMFaTE, USEPA, “Office of Air Quality Planning and Standards, TRIMFaTE Technical Support Document,” Description of Module, EPA-453/D-99-002A, Vol. I, Re- search Triangle Park, NC, 1999. [8] TRIMFaTE, USEPA, “Trimfate Technical Support Docu- ment, Description of Chemical Transport and Transfor- mation Algorithm,” Office of Air Quality Planning and Standards, Research Triangle Park, NC, EPA - 453/D-99- 002B, Vol. II, 1999. [9] E. Webster, J. Hubbarde, D. Mackay, L. Swanston and A. Hodge, “Development of Tools to Improve Exposure Es- timation for Use in Ecological Risk Assessment: The Tapl3 Upgrade,” Report to environment Canada, CEMC Report 2003xx, Trent University, Peterborough, 2003. [10] K. Kawamoto, M. MacLeod and D. Mackay, “Evaluation and Comparison of Multimedia Mass Balance Models of Chemical Fate: Application of Euses and Chemcan to 68 Chemicals in Japan,” Chemosphere, Vol. 44, No. 4, 2001, pp. 599-612. [11] A. Srivastava and D. Som, “Hazardous Air Pollutants in Industrial Area of Mumbai - India,” Chemosphere, Vol. 69, No. 3, 2007, pp. 458-468. [12] C. Warren, D. Mackay, M. Whelan, K. Fox and Mass, “Balance Modeling of Contaminants in River Basins: Application of The Flexible Matrix Approach,” Chemos- phere, Vol. 68, No. 7, 2007, pp. 1232-1244. [13] H. Imura, “The Budgets of GHGs, Urban Air Pollutants and Their Future Emission Scenarios in Selected Mega-Cities in Asia (APN 2002-04),” Final Activity Re- port, Air Pollution Network, 28 February 2003. [14] R. Duarte-Davidsona, C. Courage, L. Rushton and L. Levy, “Benzene in the Environment: An Assessment of the Potential Risks to the Health of the Population,” Oc- cupational and Environmental Medicine, Vol. 58, No. 1, 2001, pp. 2-13. [15] V. Muzyka, S. Bogovski, A. Viitak and T. Veidebaum, “Alteration of Heme Metabolism in Lymphocytes and Metal Content in Blood Plasma as Markers of Diesel Fu- els Effects on Human Organism,” The Science of Total Environment, Vol. 286, No. 1-3, 2002, pp. 73-81 [16] R. J. Delfino, H. Gong Jr., W. S. Linn, E. D. Pllizzari and Y. Hu, “Asthma Symptoms in Hispanic Children and Daily Ambient Exposures to Toxic and Criteria Air Pol- lutants,” Environmental Health perspective, Vol. 111, No. 4, 2003, pp. 647-656. [17] “Principles of risk assessment: a non-technical review,” risk assessment workshop, USEPA, Easton, 17-18 March1985. [18] “Air Risk Assessment Work Plan,” Air and Radiation Division, Tristate, Risk Assessment Project, USEPA, 1997. [19] CalTOX™ Version 1.5, “A Multimedia Total Exposure Model for Hazardous-Waste Sites,” Prepared by The University of California, Davis in Cooperation with Lawrence Livermore National Laboratory for the Office of Scientific Affairs Department of Toxic Substances Control California Environmental Protection Agency, Sacramento, California, 1994. [20] H. Salem and S. A. Kartz, “Inhalation Toxicology,” CRC pres, 2001, pp. 443 [21] DA 2002, “Soil Vapor Extraction and Bioventing,” Man- ual No. 1110-1-4001,” Department of the army, US army corps of engineers Washington, DC., EM 1110-1-4001, Engineering and Design, Available at-url: http://www.usace.army.mil/publications/eng-manuals/em 1110-1-4001/entire.pdf last accessed on 30th May 2008. [22] MSC-E, “POP Model Intercomparison Study. Stage I. Comparison of Descriptions of Main Processes Deter- mining POP Behavior in Various Environmental Com- partments,” Edited by MSC-E, Technical Report, January 2004, [23] K. L. Foster, S. Sharpe, E. Webster, D. Mackay and R. Maddalen, “The Role of Multimedia Mass Balance Mod- els for Assessing the Effects of Volatile Organic Com- pound Emissions on Urban Air Quality,” Atmospheric Environment, Vol. 40, No. 16, 2000, pp. 2986-2994. [24] VISION 2025, “Perspective Plan of KMA: 2025,” Kol- kata Metropolitan Development Authority, April 2005. [25] IPCC 2006, “IPCC Guidelines for National Greenhouse Gas Inventories,” Prepared by the National Greenhouse Gas Inventories Programme, H. S. Eggleston, L. Buendia, Copyright © 2011 SciRes. JEP  BTEX in Ambient Air of a Metropolitan City Copyright © 2011 SciRes. JEP 20 K. Miwa, T. Ngara and K. Tanabe, Eds., IGES, 2006. [26] DoE, 2007. Climate Change Consequences Of VOC Emission Controls. AEAT/ENV/R/2475. Report to The Department for Environment, Food and Rural Affairs, Welsh Assembly Government, the Scottish Executive and the Department of the Environment for Northern Ireland ED48749102, Issue 3, September 2007. [27] IPCC, “Climate Change 2001: The Scientific Basis,” Third Assessment Report of the Intergovernmental Panel on Climate Change Published for the Intergovernmental Panel on Climate Change, Cambridge University Press, Cambridge, 2001. [28] G. Samanta, G. Chattopadhyay, B. K. Mondal, T. Roy- chowdhuri, P. P. Chowdhury, C. R. Chanda, P. Banarjee, D. Lodh, D. Das and D. Chakraborty, “Air Pollution in Calcutta During Winter - a Three Year Study,” Current Science, Vol. 75, No. 2, 1998, pp. 123-138. [29] K. F. Ho, S. C. Lee, M. Gloria and Y. Chiu, “Characteri- zation of Selected Volatile Organic Compounds, Poly- cyclic Aromatic Hydrocarbons and Carbonyl Compounds at a Roadside Monitoring Station,” Atmospheric Envi- ronment, Vol. 39, 2002, pp. 57-65. [30] A. Srivastava, A. E. Joseph, S. Patil, A. More, R. C. Dixit and M. Prakash, “Air Toxics in Ambient Air of Delhi,” Atmospheric Environment, Vol. 39, No. 1, 2005, pp. 59-71. [31] T. Ohura, T. Amagai and M. Fusaya, “Regional Assess- ment of Ambient Volatile Organic Compounds in an In- dustrial Harbor Area, Shizuoka, Japan,” Atmospheric En- vironment, Vol. 40, No. 15, 2006, pp. 238-248. [32] R. Kerbachi, M. Boughedaoui, L. Bounoua and M. Ked- dam, “Ambient Air Pollution by Aromatic Hydrocarbons in Algiers,” Atmospheric Environment, Vol. 40, 2006, pp. 3995-4003. [33] H. Guo, K. L. So, I. J. Simpson, B. Barletta, S. Meinardi and D.R. Blake, “C1–C8 Volatile Organic Compounds in the Atmosphere of Hong Kong: Overview of Atmos- pheric Processing and Source Apportionment,” Atmos- pheric Environment, Vol. 41, No. 7, 2007, pp. 1456-1472. [34] M. C. McCarthy, H. R. Hafner, L. R. Chinkin and J. G. Charrier, “Temporal Variability of Selected Air Toxics in the United States,” Atmospheric Environment, Vol. 41, No. 34, 2007, pp. 7180-7194. [35] R. R. Hoque, P. S. Khillare, T. Agarwal, V. Shridhar and S. Balachandran, “Spatial and Temporal Variation of Btex in the Urban Atmosphere of Delhi, India,” Science of the Total Environment, Vol. 392, No. 1, 2008, pp. 30- 40. [36] R. Miranda and E. Tomaz, “Characterization of Urban Aerosol in Campinas, São Paulo, Brazil,” Atmospheric Research, Vol. 87, No. 2, 2008, pp. 147-157. [37] C. Dutta, D. Som, A. Chatterjee, A. K. Mukherjee, T. K. Jana and S. Sen, “Mixing Ratios of Carbonyls and Btex in Ambient Air of Kolkata, India and Their Associated Health Risk,” Environ Monit Assess, Vol. 147, 2009, pp. 97-107. [38] “Inventory of Evaporative Emissions of Hydreocarbons from Vatious Sources in Delhi, Mumbai, Chennai and Kolkata,” National Environmental Engineering Research Institute, NEERI, 2005. [39] WHO, Air Quality Guidelines for Europe, 2nd ed., World Health Organization, Regional Office for Europe, Co- penhagen, WHO Regional Publications, European Series, No. 91, 2000. Available at url: http://www.euro.who.int/ [40] IARC, International Agency for Research on Cancer, 2002; IARC Monographs Programme on the Evaluation of Carcinogenic Risks to Humans, 2002. |