Open Journal of Civil Engineering, 2013, 3, 242-250
Published Online December 2013 (http://www.scirp.org/journal/ojce)
http://dx.doi.org/10.4236/ojce.2013.34029
Open Access OJCE
TransCAD and GIS Technique for Estimating Traffic
Demand and Its Application in Gaza City
Essam Almasri, Mohammed Al-Jazzar
Department of Civil Engineering, Islamic University of Gaza, Gaza, Palestine
Email: emasry@iugaza.edu.ps
Received September 11, 2013; revised October 11, 2013; accepted October 18, 2013
Copyright © 2013 Essam Almasri, Mohammed Al-Jazzar. This is an open access article distributed under the Creative Commons
Attribution License, which permits unrestricted use, distribution, and reproduction in any medium, provided the original work is
properly cited.
ABSTRACT
In the early nineties of the last century, the transportatio n system in Gaza Strip was born and new infrastructure projects,
especially road networks, were constructed. However, the construction lacked efficient application of a transportation
planning process. Transportation planning relies on traffic demand forecasting process. The conventional process is
impeded by extensive amount of socioeconomic data. One of the most widely-used models which mitigate this problem
is the TransCAD Model. This model is rarely used in Gaza Strip for traffic demand forecasting, and most of the prac-
tices depend mainly on a constant growth rate of traffic. Therefore, the main objective of this research is to apply this
model in Gaza City for traffic estimation. This model estimates the origin-destination matrix based on traffic count. The
traffic count was carried out at 36 intersections distributed around Gaza City. The results of traffic flow estimation ob-
tained from TransCAD are assigned to the Gaza maps using the GIS techniques for spatial analysis. It is shown that the
most congested area at present is the middle of the city especially at Aljala-Omer Almokhtar intersection. Therefore,
improvement scenarios of this area should be carried out. The results of calibration of traffic flow estimation show that
the differences between the estimated and the actual flows were less than 10%. In addition, network evaluation results
show that the network is expected to be more congested in 2015. This work can be used by transportation planners for
testing any network improvement scenarios and for studying their network performance.
Keywords: Transportation Planning; Traffic Demand Forecasting; Origin-Destination Estimation; Gaza; GIS
1. Introduction
Gaza Strip is situated at the southern part of the Palestin-
ian Territories. As shown in Figure 1, it includes five
governorates namely, Rafah, Khan-Younis, Middle, Gaza
and North Governorates [1]. The area of Gaza Strip is
about 365 k m2. It is a narrow coastal strip of land with a
length of 40 km along the Mediterranean Sea in the
Northwest di rection. It has 58 km borders with An-Naqa v
Desert to the East and South and 12 km with Egypt to the
Southwest. It takes its name from its main city Gaza [2].
According to the census conducted by the Palestinian
Central Bureau of Statistics (PCBS), the total number of
population of Gaza Strip at mid 2011 was 1.59 millions.
Gaza is the most densely populated governorate in Gaza
Strip with a density of 0.75 inhabitants/hectare. The area
of Gaza City is 7259.3 hectares and the number of popu-
lation at mid 2011 is 552,0 00 [3].
Gaza Strip transportation system is limited by small
and poorly developed road network. Before 1967, it had
a single railway line running from North to South of
Gaza Strip along its centre. However, currently it disap-
pears and little trackage remains. There is only a small
port which is limited to fishermen. Gaza International
Airport was opened in November 1998; however, it was
closed in October 2000. After the arrival of the Palestin-
ian National Authority from Diasporas in the early nine-
ties of the last century, the transportation system in Gaza
Strip was born and a dramatic and unprecedented in-
crease in the possession of the vehicles was observed. In
consequence of that, new infrastructure projects, espe-
cially road networks, were constructed. However, the
construction lacked efficient application of a transporta-
tion planning process. This led to deficiency in adopting
the suitable transport policies to mitigate the transporta-
tion problems resulting from urbanization and rapid in-
crease of population [4].
Transportation planning relies on travel demand fore-
E. ALMASRI, M. AL-JAZZAR 243
Figure 1. Governorates of Gaza Strip [1].
casting which involves prediction of the number of vehi-
cles or travellers that will use a particular transportation
facility in future. Since 1950’s, many travel demand
forecasting processes were developed, including conven-
tional four-stage travel demand forecasting process. This
process begins with collection of extensive data on land
use, socioeconomic, demographic, and network charac-
teristics [5]. The four steps of the process are sequenced
as trip generation, trip distribution, mode choice, and
traffic assignment. Trip generation determines the num-
ber of trips starting or ending at an area (zone) within a
given time such as per day or per hour. It is based on
determining a relationship between trip making and land
uses, household demographics, and other socioeconomic
factors. Trip distribution is the process by which the
planner calculates the pattern of trips between the zones.
It describes the number or proportion of trips from an
origin zone spread amongst all destination zones. Mode
choice computes the patterns of trips between origin and
destination zones that use a particular transportation
mode. Traffic assignment determines the volume of
travel for each individual movement at intersections of
the transportation network [6].
From the time when the convention al four-stage travel
demand forecasting was developed, a number of highly
critical reviews to the model have been seen. In response
to criticisms, improvements have been made on the four-
stage modeling approach and new modeling approaches
have come out [7]. According to [7], few of the devel-
oped models have already been tried in cities of devel-
oping countries. An example of work is shown in [8] in
which different Work-Trip Mode-Choice Models for
South Africa were tested. A second example is shown in
[9] in which different trip generation models in develop-
ing countries were analyzed and calibrated. A third ex-
ample is shown in [10] in which two types of gravity
model for trip distribution in India were calibrated. A
fourth is [11] which is a transport study of Amman, Jor-
dan.
One of the criticisms of th e sequential four-step model
is the extensive amount of land use, socioeconomic, and
demographic data needed for the first step of trip genera-
tion. Because of that, many models have been developed
which skipped this step and started directly from step 2.
They estimate the origin-destination (O-D) matrix based
on traffic counts. Traffic counts are much easier to obtain
and are often already available for other traffic related
purposes. Therefore, many computer models have been
proposed and applied for O-D matrix estimation to inves-
tigate the relationship between traffic counts and O-D
matrix. One of the most widely-used models is the
TransCAD Model [12].
This model is rarely used in Gaza Strip for traffic de-
mand forecasting, and most of the practices depend
mainly on a constant growth rate of traffic. Therefore, the
main objective o f this research is to apply the Tran sCAD
model for traffic estimation. The results will be assigned
to the Gaza maps using the GIS techniques available in
TransCAD for spatial analysis to be used as guidelines
for transportation planner to determine the congested
locations in Gaza, and hence to help in developing poli-
cies for congestion mitigation .
2. Methodology
In order to achieve the objectives of this study the work
is divided into six phases. The first phase is data collec-
tion. The data includes network road characteristics and
traffic data for the base year. The traffic count was car-
ried out in 18/4/2010 by more than one hundred observ-
ers under the supervision of the researchers. The count
was conducted to from 7:00 am to 12:00 am to deter-
mine the exact network peak hour. It was done at 36 in-
tersections distributed around Gaza City as shown in
Figure 2.
Figure 2. Locations of traffic counts in Gaza City.
Open Access OJCE
E. ALMASRI, M. AL-JAZZAR
244
The second phase is network building and data enter-
ing. An aerial photo of Gaza was geo-referenced and
digitized using ArcGIS. The resulted ESRI shape file was
transferred into TransCAD and used as a background to
draw the network and the zones. Zoning system for Gaza
City was very essential for the O-D matrix estimation
and traffic assignment. For that purpose, the land use
characteristics of the City was studied.
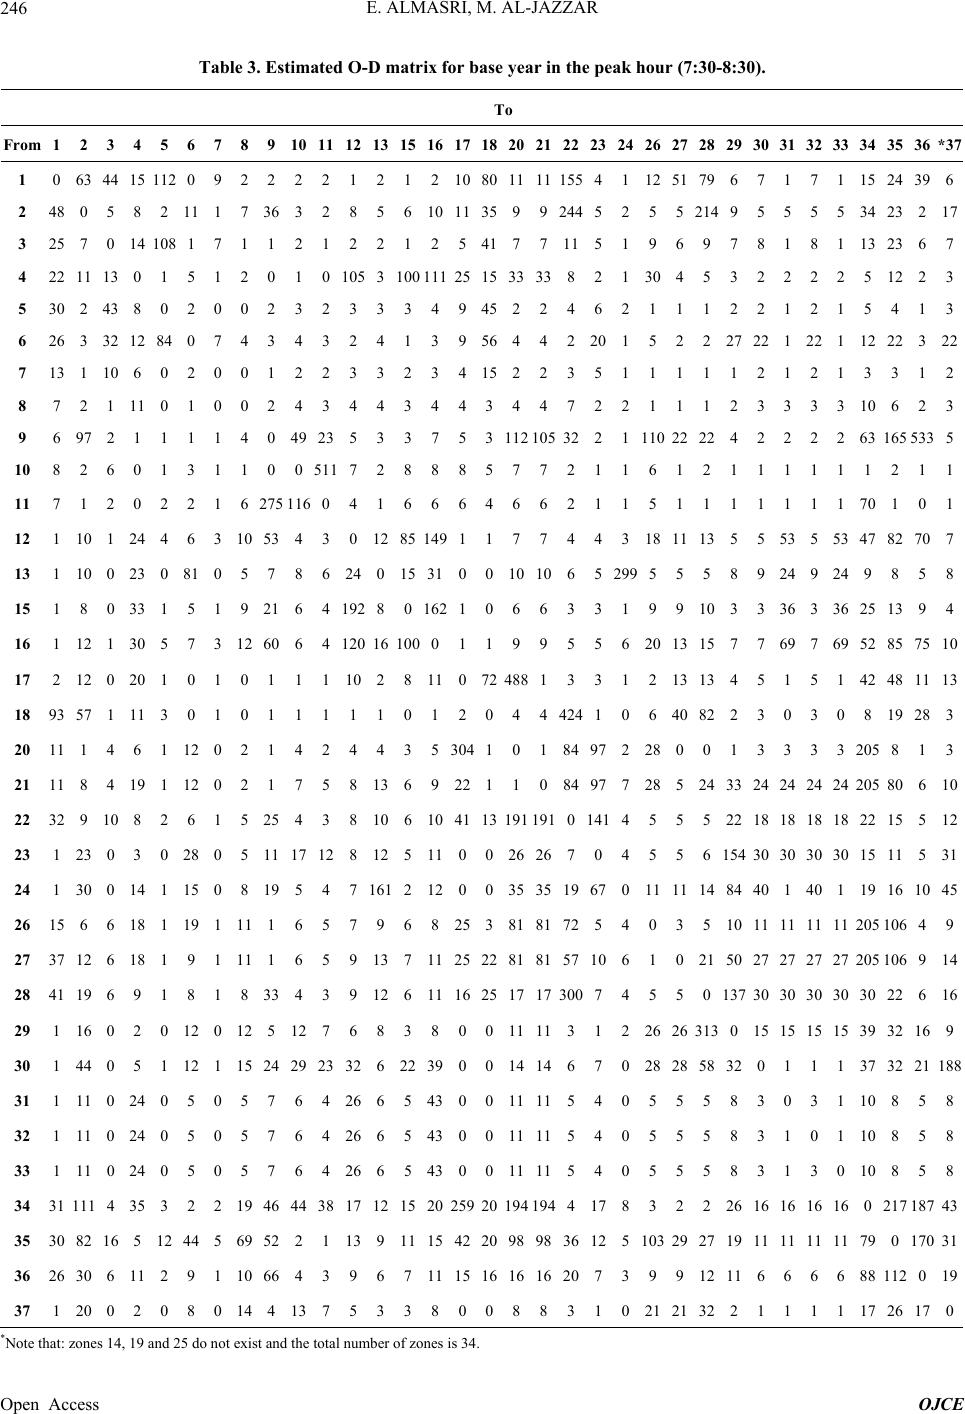
The third phase is matrix estimation for the base year.
It is done using TransCAD Model which is based on
Nielsen’s Model [13], who independently developed it as
a procedure for TransCAD 2.1. The model has the ad-
vantages of handling counts as stochastic variables, as
well as working with any traffic assignment method.
Thus, it is appealing for use with the Stochastic User
Equilibrium Assignment method, as well as with User
Equilibrium Assignment. Nielsen’s model is an iterative
(or bi-level) process that switches back and forth be-
tween a traffic assignment stage and a matrix estimation
stage [14]. To use the O-D Matrix Estimation procedure,
the base O-D matrix and a geographic file of both area
and line laye rs are prepar ed. In line geographic file, each
link data should be input, and a network for the line layer
should be created. It should include all the relevant at-
tributes. In area geographic file, connectors of zones’
centroids must be created to connect line and area geo-
graphic layer. Because there is no available prior O-D
matrix, a unit matrix (each O-D pair has a value of 1)
was used as initial matrix. Based on traffic counts at the
intersections, the O-D matrix was estimated and vali-
dated. A base O-D matrix serves two purposes. The first
purpose is to set the dimensions for the output matrix.
The second purpose is to provide initial values for the
estimated O-D matrix.
The fourth phase is model calibration to ensure good
representation of the traffic network. The aim is to esti-
mate O-D matrix that should be as real as possible.
Model calibration was conducted by adjusting locations
of zones’ connectors, locations of zones’ centroids and
turn penalties. The observed traffic flow and the modeled
traffic flow at the intersections using the traffic assign-
ment should be close to each other. Traffic flow differ-
ence of 10% could be acceptable.
The fifth phase is future O-D matrix estimation. For
that purpose, it is recommended to use uniform growth
factor method by multiplying all O-D pairs by the same
amount as shown in Equation (1) [6]:
ijf ijppf
TTM (1)
where, ijf is trips for O-D pair ij in future year f; ijp
is trips for O-D pair ij in present year p; and
T T
p
f
M
is
expected growth in trips between year f and p.
When information about the expected growth in trips
produced in each zone is available, the singly constrained
growth factor method might be used ([6,15]). This is
performed by multiplying different growth factors to
different rows (or columns) in the O-D matrix. Accord-
ing to [6,16], the growth factors might be determined
based on land use or socioeconomic data. Because of
little amount of socioeconomic and land use data, fore-
casting in this research is simply based on uniform
growth factor method. The estimates of rate of growth in
vehicle ownership over the forecasting period are used to
develop the end product of passenger traffic trip matrix.
They are directly input to the modelling process as a
value by which existing base year vehicle trip matrices
are factored to develop future year trip matrices.
The sixth phase is network evaluation. TransCAD
model offers three network performance measures. The
first one is vehicles hours of travel which is the summa-
tion of travel time spent by all vehicles in the network.
The second one is the total vehicle kilometers travelled
which is the summation of the total distance travelled by
all the vehicles over the network in one hour. These two
measures can be used in different scenario evaluation and
comparison, where the best scenario should have the
lowest values. The third performance measure is volume
over capacity ratio which is a direct indication of the
network level of service.
3. Results and Analysis
This section presents the results obtained when applying
the methodology discussed in the previous section. It
includes five parts. The first one presents geometric and
traffic data. The second part concerns the network build-
ing. The third part discusses the obtained results of base
year O-D matrix estimation and model calibration, while
the fourth part discusses the results of future O-D matrix
estimation. The last part presents the results of network
evaluation.
3.1. Data
The geometric data collection focused on the main streets
and intersections which were involved in th e traffic count.
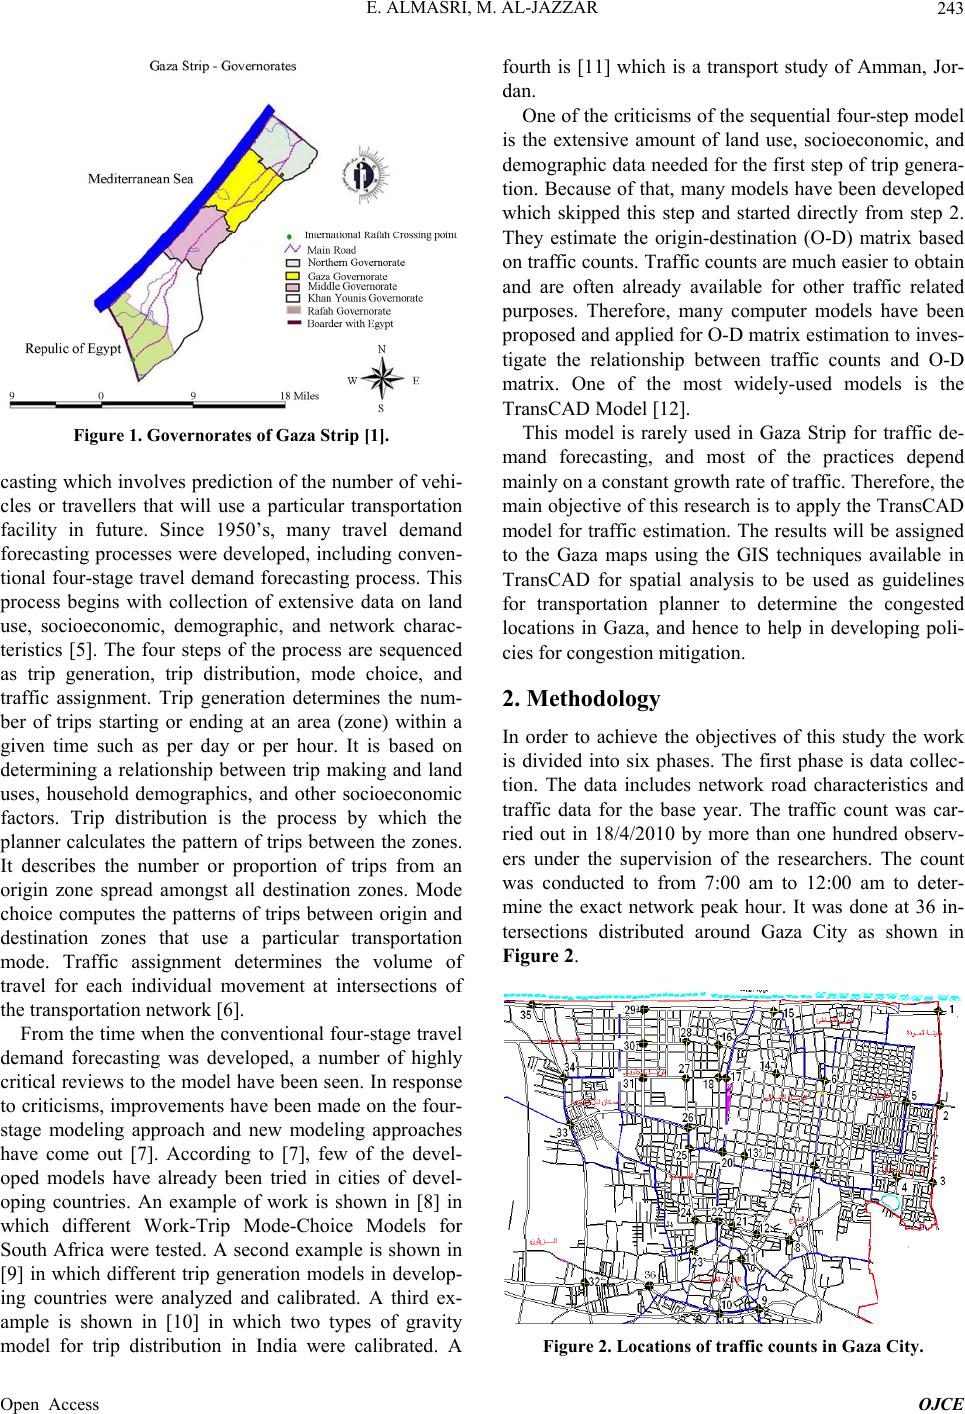
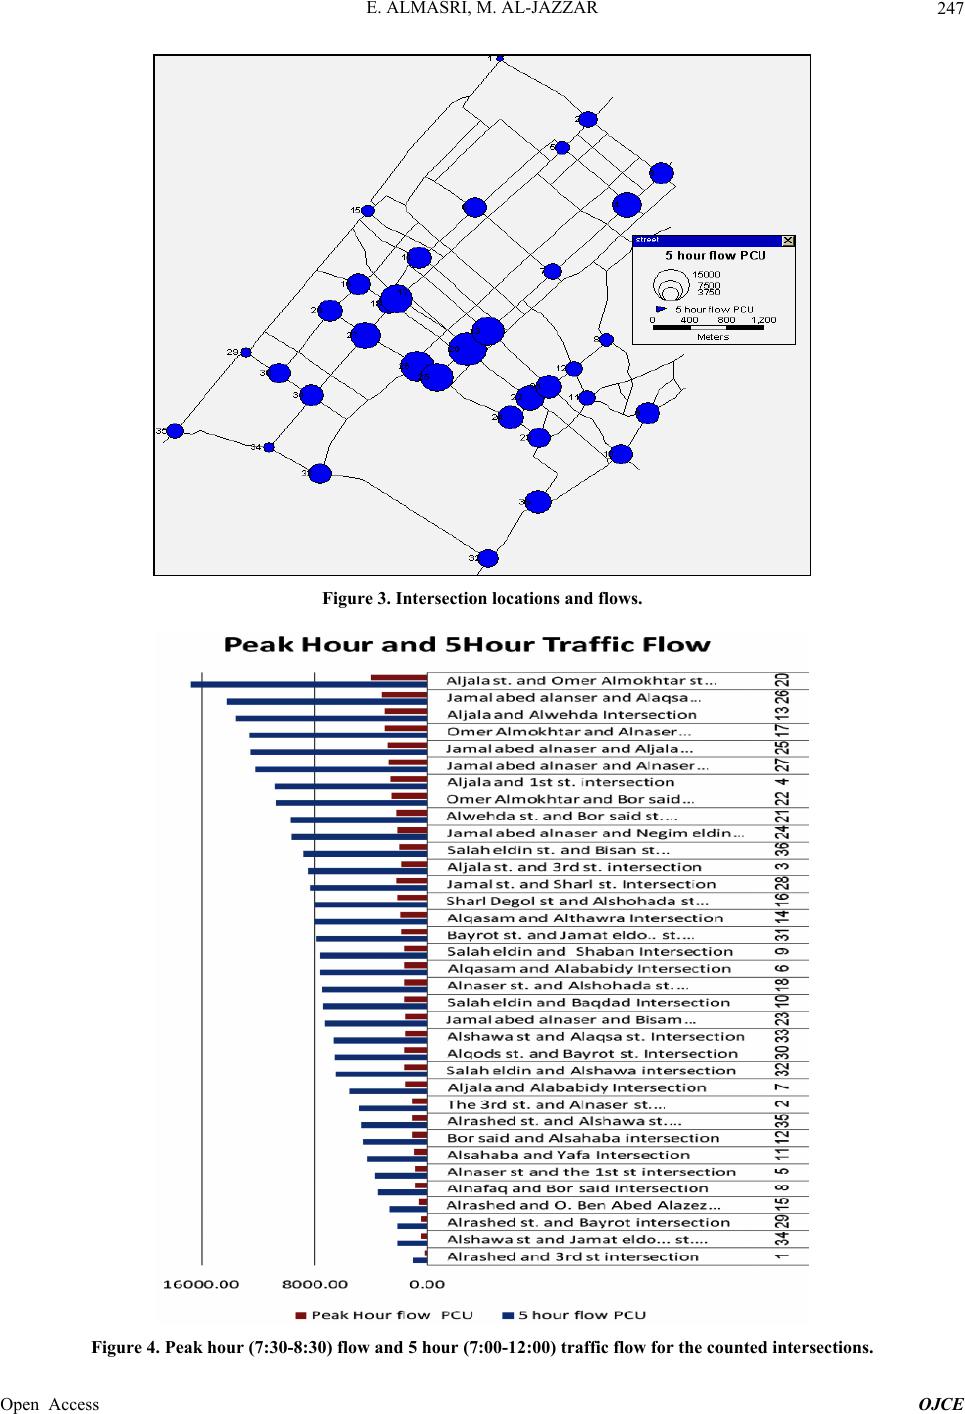
Figure 2 presents the intersectio ns’ names and locations.
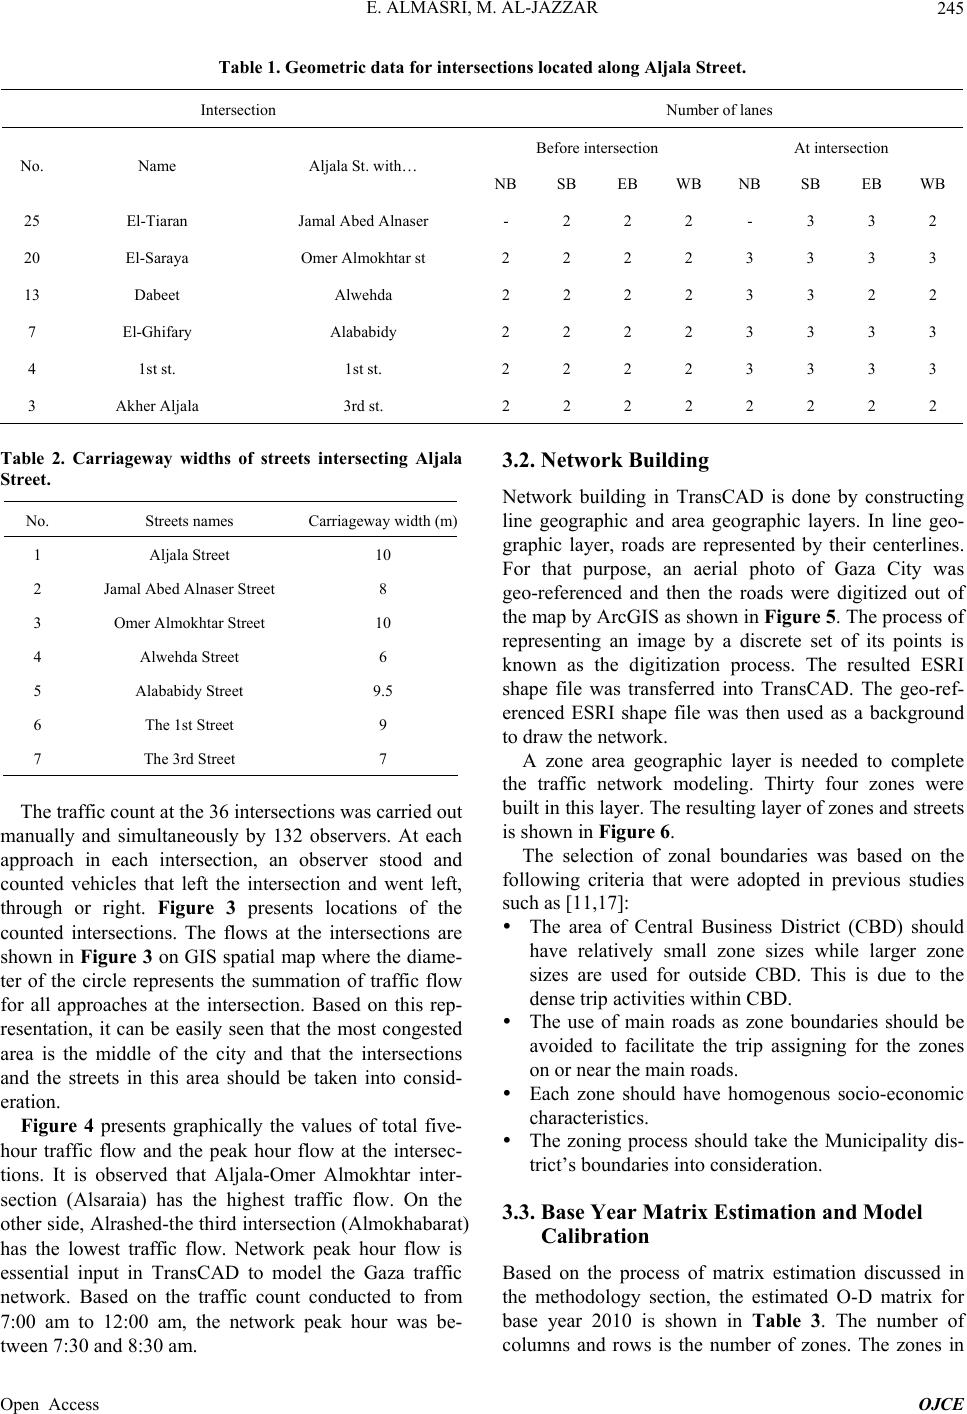
Geometric data for some of the intersections are pre-
sented in Table 1 which are the intersections located
along Aljala Street. The first column is intersection serial
number. The second column shows the names of the in-
tersections while the third shows the names of the streets
intersecting Aljala Street. The next columns present the
number of lanes in each approach before arriving at each
intersection. It is noted that the lanes before arriving in-
tersections is less than at intersections because of either
widening of the intersections or using nearside lane for
parking between intersections. Table 2 presents the car-
riageway widths of the streets.
Open Access OJCE
E. ALMASRI, M. AL-JAZZAR
Open Access OJCE
245
Table 1. Geometric data for intersections located along Aljala Street.
Intersection Number of lanes
Before intersection At intersection
No. Name Aljala St. with… NB SB EB WB NB SB EB WB
25 El-Tiaran Jamal Abed Alnaser - 2 2 2 - 3 3 2
20 El-Saraya Omer Almokhtar st 2 2 2 2 3 3 3 3
13 Dabeet Alwehda 2 2 2 2 3 3 2 2
7 El-Ghifary Alababidy 2 2 2 2 3 3 3 3
4 1st st. 1st st. 2 2 2 2 3 3 3 3
3 Akher Aljala 3rd st. 2 2 2 2 2 2 2 2
Table 2. Carriageway widths of streets intersecting Aljala
Street.
No. Streets names Carriageway width (m)
1 Aljala Street 10
2 Jamal Abed Alnaser Street 8
3 Omer Almokhtar Street 10
4 Alwehda Street 6
5 Alababidy Street 9.5
6 The 1st Street 9
7 The 3rd Street 7
The traffic count at the 36 intersections was carried out
manually and simultaneously by 132 observers. At each
approach in each intersection, an observer stood and
counted vehicles that left the intersection and went left,
through or right. Figure 3 presents locations of the
counted intersections. The flows at the intersections are
shown in Figure 3 on GIS spatial map where the diame-
ter of the circle represents the summation of traffic flow
for all approaches at the intersection. Based on this rep-
resentation, it can be easily seen that the most congested
area is the middle of the city and that the intersections
and the streets in this area should be taken into consid-
eration.
Figure 4 presents graphically the values of total five-
hour traffic flow and the peak hour flow at the intersec-
tions. It is observed that Aljala-Omer Almokhtar inter-
section (Alsaraia) has the highest traffic flow. On the
other side, Alrashed-the third intersection (Almokhabarat)
has the lowest traffic flow. Network peak hour flow is
essential input in TransCAD to model the Gaza traffic
network. Based on the traffic count conducted to from
7:00 am to 12:00 am, the network peak hour was be-
tween 7:30 and 8:30 am.
3.2. Network Building
Network building in TransCAD is done by constructing
line geographic and area geographic layers. In line geo-
graphic layer, roads are represented by their centerlines.
For that purpose, an aerial photo of Gaza City was
geo-referenced and then the roads were digitized out of
the map by ArcGIS as shown in Figure 5. The process of
representing an image by a discrete set of its points is
known as the digitization process. The resulted ESRI
shape file was transferred into TransCAD. The geo-ref-
erenced ESRI shape file was then used as a background
to draw the network.
A zone area geographic layer is needed to complete
the traffic network modeling. Thirty four zones were
built in this layer. The resulting layer of zones and streets
is shown in Figure 6.
The selection of zonal boundaries was based on the
following criteria that were adopted in previous studies
such as [11,17]:
The area of Central Business District (CBD) should
have relatively small zone sizes while larger zone
sizes are used for outside CBD. This is due to the
dense trip activities within CBD.
The use of main roads as zone boundaries should be
avoided to facilitate the trip assigning for the zones
on or near the main roads.
Each zone should have homogenous socio-economic
characteristics.
The zoning process should take the Municipality dis-
trict’s boundaries into consideration.
3.3. Base Year Matrix Estimation and Model
Calibration
Based on the process of matrix estimation discussed in
the methodology section, the estimated O-D matrix for
base year 2010 is shown in Table 3. The number of
columns and rows is the number of zones. The zones in
E. ALMASRI, M. AL-JAZZAR
246
Table 3. Estimated O-D matrix for base year in the peak hour (7:30-8:30).
To
From 1 2 3 4 5 6 7 89 10 11 12 1315161718202122232426272829 30 31 32 33 343536*37
1 0 63 44 15 112 0 9 22 2 2 1 21210801111155411251796 7 1 7 1 1524396
2 48 0 5 8 2 11 1 7 36 3 2 8 56 101135 9924452552149 5 5 5 5 3423217
3 25 7 0 14 108 1 7 11 2 1 2 212541 7711519697 8 1 8 1 132367
4 22 11 13 0 1 5 1 20 1 0 105 31001112515333382130 453 2 2 2 2 51223
5 30 2 43 8 0 2 0 02 3 2 3 334945 224621112 2 1 2 1 5413
6 26 3 32 12 84 0 7 43 4 3 2 413956 44220152227 22 1 22 1 1222322
7 13 1 10 6 0 2 0 01 2 2 3 323415 223511111 2 1 2 1 3312
8 7 2 1 11 0 1 0 02 4 3 4 43443447221112 3 3 3 3 10623
9 6 97 2 1 1 1 1 40 49 23 5 3375311210532 2111022224 2 2 2 2 631655335
10 8 2 6 0 1 3 1 10 0 511 7 28885772116121 1 1 1 1 1211
11 7 1 2 0 2 2 1 6275 116 0 4 16664662115111 1 1 1 1 70101
12 1 10 1 24 4 6 3 1053 4 3 0 1285149117744318 11135 5 53 5 53 4782707
13 1 10 0 23 0 81 0 57 8 6 24 015 310010 1065 299 5558 9 24 9 24 9858
15 1 8 0 33 1 5 1 9 21 6 4 192 80162106633199 10 3 3 36 3 36 2513 94
16 1 12 1 30 5 7 3 1260 6 4 120 16100 0119955620 13 157 7 69 7 69 52 857510
17 2 12 0 20 1 0 1 01 1 1 10 28 110 72488133121313 4 5 1 5 1 42481113
18 93 57 1 11 3 0 1 01 1 1 1 10120444241064082 2 3 0 3 0 819283
20 11 1 4 6 1 12 0 21 4 2 4 435304101 8497228 001 3 3 3 3 205813
21 11 8 4 19 1 12 0 21 7 5 8 1369221108497728524 33 24 24 24 24 20580610
22 32 9 10 8 2 6 1 5 25 4 3 8 10 61041131911910141455522 18 18 18 18 2215512
23 1 23 0 3 0 28 0 5 11 17 12 8 1251100 2626704556154 30 30 30 30 15115 31
24 1 30 0 14 1 15 0 819 5 4 7 161212003535196701111 1484 40 1 40 1 19161045
26 15 6 6 18 1 19 1 111 6 5 7 96825381 81 725403510 11 11 11 11 205106 49
27 37 12 6 18 1 9 1 111 6 5 9 13711 25 228181571061021 50 27 27 27 27 205106914
28 41 19 6 9 1 8 1 8 33 4 3 9 12 6111625171730074550137 30 30 30 30 30226 16
29 1 16 0 2 0 12 0 125 12 7 6 8380011113122626313 0 15 15 15 15 3932169
30 1 44 0 5 1 12 1 1524 29 23 32 62239 001414 67028285832 0 1 1 1 373221188
31 1 11 0 24 0 5 0 57 6 4 26 65 4300 11115405558 3 0 3 1 10858
32 1 11 0 24 0 5 0 57 6 4 26 65 4300 11115405558 3 1 0 1 10858
33 1 11 0 24 0 5 0 57 6 4 26 65 4300 11115405558 3 1 3 0 10858
34 31 111 4 35 3 2 2 1946 44 38 17 12 152025920194194417832226 16 16 16 16 021718743
35 30 82 16 5 12 44 5 6952 2 1 13 911154220989836125103 292719 11 11 11 11 790170 31
36 26 30 6 11 2 9 1 1066 4 3 9 67 1115161616207399 1211 6 6 6 6 88112019
37 1 20 0 2 0 8 0 144 13 7 5 3380088310 212132 2 1 1 1 1 1726170
*Note that: z ones 14, 19 and 25 do not exist and the total number of zones is 34.
Open Access OJCE
E. ALMASRI, M. AL-JAZZAR 247
Figure 3. Intersection locations and flows.
Figure 4. Peak hour (7:30-8:30) flow and 5 hour (7:00-12:00) traffic flow for the counted intersections.
Open Access OJCE
E. ALMASRI, M. AL-JAZZAR
Open Access OJCE
248
Figure 5. Street layer digitizing by ArcGIS.
Figure 6. Layers of streets and zones.
the first column are the origins and the zones in the first
row are the destinations.
The model should be calibrated to ensure good repre-
sentation of the traffic network. Calibratio n is the process
of adjusting network items to bring the modeled traffic
flow and the actual traffic flow to match each other as
much as possible. Many trials were done to reach the best
results. The flow differences for one direction and an
opposite direction were 9.15% and 7.51% respectively;
which is acceptable as it is less than 10%. Figure 7
shows the modeled traffic flow for the base year in each
link in GIS spatial map where the traffic flow is repre-
sented by line width.
3.4. Future O-D Matrix Estimation
In using the uniform growth factor method for future
O-D matrix estimation, it was assumed that the number
of vehicle trips made is a function of the number of vehi-
cles available. Figure 8 summarizes the available statis-
tics of the number of registered vehicles in Gaza Strip.
The statistics show that there was a very sharp and sud-
den increase of more than 20% in the number of regis-
tered vehicles between 1993 and 1994. In 1995, the in-
crease in the number of registered vehicles was the
greatest, where it was abou t 35%. This dramatic increase
in the number of registered vehicles is due to the eco-
nomical and political inv igoration during the period from
1993 to 1995, associated with the start of the Palestinian
Authority.
It is noticed that the increase in the number of regis-
tered vehicles slowed down substantially after 1995 re-
turning to a rate of change similar to that before 1987.
The growth rate of the number of motor vehicles is in-
creased uniformly at the beginning and highly fluctuated
between the years 1985 to 1995. Then, it seems to be
steady at the last six years between 1999 and 2004.
Figure 7. Modeled traffic flow for links in Gaza City net-
work for base year in the peak hour (7:30-8:30).
No. of Regestered vehicles In Gaza Strip
0
10,0 0 0
20,0 0 0
30,0 0 0
40,0 0 0
50,0 0 0
60,0 0 0
1970
1972
1974
1976
1978
1980
1982
1984
1986
1988
1990
1992
1994
1996
1998
2000
2002
2004
Year
Vehicles
Figure 8. Number of registered vehicles in Gaza Strip [3].
E. ALMASRI, M. AL-JAZZAR 249
Therefore, this region is used for calculating the growth
rate. The average yearly growth rate in this period is
equal to 2.2%. The future O-D matrix is obtained by
multiplying each base year (2010) O-D matrix cell by the
growth rate for the year 2015 using Equation (1).
Where:

5
1 0.0221.12
pf
M 
Network traffic assignment was done based on future
O-D matrix for the year 2015 to estimate the future traf-
fic flow of this year. Figure 9 shows modeled future
traffic flow in each link in GIS spatial map where the
flow is represented by line width.
3.5. Network Evaluation
The results of total vehicle hours and the total vehicle
kilometers traveled for both base year and the year 2015
is summarized in Table 4. The results show an increase
in the network performance measures of about 10%
when doing nothing in the network. Thus, the network is
becoming more congested. The results of the third net-
work performance measures (volume/capacity ratio) are
presented in Table 5. The same finding of more con-
gested network could be obtained, as higher percentage
of links that have high volume/capacity ratio of the year
2015 is seen. Therefore, network improvement scenarios
should be carried out.
4. Conclusions and Recommendations
Based on the findings of this research, it is observed that
the peak hour is from 7:30 to 8:30; thus, this hour is used
Figure 9. Modeled traffic flow for links in Gaza City net-
work for year 2015 in the peak hour (7:30-8:30).
Table 4. Total vehicle hours and the total vehicle kilometers
for base year and 2015.
Base year 2015 % Increase
Total vehicle hours
(hours) 76,899 85,659 10.2
Total vehicles
kilometers (km) 49,488,073 54,993,616 10.0
Table 5. Volume over capacity ranges for base year and
2015.
AB-Direction
Percentage of links (%) BA-Direction
Percentage of links (%)
Volume over
capacity ranges Base year2015 Base year2015
0 to 0.2 45 44 47 42
0.2 to 0.4 30 27 24 31
0.4 to 0.6 19 21 27 21
0.6 to 0.8 5 5 1 5
0.8 to 1 2 2 0 0
>1 0 0 0 0
Total 100 100 100 100
for analysis in this study. The results of da ta analysis and
GIS spatial maps show that the most congested area is
the middle of the city and the most congested intersection
is Aljala-Omer Almokhtar intersection. Therefore, im-
provement scenarios of this area and for these intersec-
tions should be carried out for the responsible authorities.
The calibration of network building and traffic flow es-
timation based on TransCAD show good results of esti-
mation. The flow differences for one direction and an
opposite direction are 9.15% and 7.51% respectively;
which are acceptable as they are less than 10%. The re-
sults of network evaluation show that the network is be-
coming more congested in 2015. In total, the outcomes of
this work can be used by transportation planners for test-
ing any network improvement scenarios and studying
their network performance.
Several recommendations have emerged from this re-
search. First, this work is recommended to be carried out
for daily evening peak hour and for daily traffic. Second
it is recommended to apply the suggested process to
other governorates in Gaza Strip in addition to the inter-
city Trips. Third, the O-D matrix and the traffic assign-
ment should be updated every few years based on new
traffic count.
5. Acknowledgements
We would like to express our sincere and heartfelt grati-
tude to more than 130 students in the civil engineering
department at the Islamic University of Gaza for their
Open Access OJCE
E. ALMASRI, M. AL-JAZZAR
Open Access OJCE
250
help in collecting data.
REFERENCES
[1] Euro-Mediterranean Human Rights Network, 2013.
http://www.euromedrights.org/eng/
[2] E. Almasri, “Factors Affecting Travel Choice of Shared
Taxi versus Bus for Palestinian University Student Trips,”
International Review of Civil Engineering, Vol. 2, No. 1,
2011, pp. 35-45.
[3] Palestinian Central Bureau of Statistics, 2011.
http://www.pcbs.gov.ps/site/lang__en/1/default.aspx
[4] E. Almasri, “Improving Traffic Performance by Coordi-
nating Traffic Signals Using Transyt-7f Model—Eljalaa
Arterial Road in Gaza City as a Case Study,” Proceedings
of the 4th International Engineering Conference, Gaza,
15-16 October 2012.
[5] N. J. Garber and L. A. Hoel, “Traffic and Highway Engi-
neering,” 4th Edition, SI Cengage Learning, USA, 2010.
[6] C. A. O’Flaherty, “Traffic Planning & Engineering,” Ar-
nold, London, 1997, pp. 118-128.
[7] H. Bwire, “A Unified Framework for Selecting a Travel
Demand Forecasting Model for Developing Countries,”
Transportation Planning and Technology, Vol. 31, No. 3,
2008, pp. 347-368.
http://dx.doi.org/10.1080/03081060802087809
[8] P. R. Stopher and C. G Wilmot, “Work-Trip Mode Choice
Models for South Africa,” Transportation Engineering
Journal of ASCE, Vol. 105, No. TE6, 1979, pp. 595-608.
[9] K. Takyi, “Trip Generation Analysis in a Developing
Country Context,” Transportation Research Record, 1285,
pp. 9-21, 1990.
[10] V. T. Arasan, M. Wermuth and B. S. Srinivas, “Model-
ling of Stratified Urban Trip Distribution,” ASCE Journal
of Transportation Engineering, Vol. 122, No. 5, 1996, pp.
342-349.
http://dx.doi.org/10.1061/(ASCE)0733-947X(1996)122:5
(342)
[11] Dar Al Handasa, “the Greater Amman Urban Transport
Study,” Jordan, 1999.
[12] Caliper, “TransCAD Transportation Planning Software,”
2011. http://www.caliper.com/TCTravelDemand.htm.
[13] O. A. Nielsen, “A New Method for Estimating Trip Ma-
trices from Counts,” Institute of Roads, Traffic and Town
Planning, The Technical University of Denmark, 1993.
[14] Caliper Corporation, “TransCAD 4.5 Help for Planning,”
2002.
[15] J. D. D. Ortúzar and L. G. Willum, “Modeling Trans-
port,” John Wiley & Sons, LTD, England, 2001.
[16] K. Hamad and A. Faghri, “An Innovative Methodology
for Vehicular Demand Forecasting in Developing Coun-
tries,” TRB Annual Meeting, 2003.
[17] R. D. Douleh, “The Use Of Traffic Assignment Model-
ling Technique in Evaluating & Testing Transportation
Policies and Projects Nablus City: Case Study,” Master
Thesis, An-Najah National University, Nablus, 2000.