Journal of Environmental Protection, 2013, 4, 1488-1494
Published Online December 2013 (http://www.scirp.org/journal/jep)
http://dx.doi.org/10.4236/jep.2013.412170
Open Access JEP
A Study of Heavy Metals in the Dust Fall around Assiut
Fertilizer Plant
Thabet A. Mohamed1, Mohamed Abuel-Kassem Mohamed2, Ragab Rabeiy2, Mahmoud A. Ghandour3
1National Institute of Occupational Safety and Health (NIOSH), Assiut, Egypt; 2Mining and Metallurgical Engineering Department,
Faculty of Engineering, Assiut University, Assiut, Egypt; 3Chemistry Department, Faculty of Science, Assiut University, Assiut, Egypt.
Email: mfye64@gmail.com
Received June 19th, 2013; revised July 23rd, 2013; accepted August 21st, 2013
Copyright © 2013 Thabet A. Mohamed et al. This is an open access article distributed under the Creative Commons Attribution Li-
cense, which permits unrestricted use, distribution, and reproduction in any medium, provided the original work is properly cited. In
accordance of the Creative Commons Attribution License all Copyrights © 2013 are reserved for SCIRP and the owner of the intel-
lectual property Thabet A. Mohamed et al. All Copyright © 2013 are guarded by law and by SCIRP as a guardian.
ABSTRACT
A study of an environmental assessment of dust fall and the associated heavy metal contents was conducted during the
period from the first of March 2011 to the end of February 2012 at adjoining area of a phosphate fertilizer plant. Around
the industrial area 8 dust fall stations were established and one of them was built upwind far from pollution activities to
be taken as a control sample. Dust fall samples collected monthly weighed and then prepared to be analyzed through
Inductively Coupled Plasma-Mass Spectroscopy (ICP-MS) to obtain heavy metal concentration. Meteorological pa-
rameters influencing the distribution of dust fall such as wind speed and direction, temperature, humidity, rain fall and
pressure were determined. Results showed that deposition flow rates were 38.2. 47.5, 57.7, 44.3, 39.4, 38.2, 42.7 and
5.9 g/m2·month for the sites No., 1, 2, 3, 4, 5, 6, 7 and 8 respectively, and were compared with the findings of other in-
vestigators of like industrial areas worldwide. Levels of heavy metal As, Cu, Pb, Zn, Cd, and Hg in the deposited dust
fall were 3.30, 26.46, 22.33, 235.00, 4.53 and 3.80 µg/g respectively. Enrichment coefficients of the heavy metals in the
dust fall were found to be significant and reached the values 1.81, 0.90, 0.85, 0.65, 0.41 and 0.35 for zinc, lead, cad-
mium, copper, mercury and arsenic respectively. The paper ends with results and recommendations suggesting a meth-
odology to remediate the investigated area polluted with heavy metals and control measures for the fertilizer plant to
reduce pollution into the surrounding environment.
Keywords: Heavy Metal; Dust Fall Station; Deposition Flow Rate; Phosphate Fertilizer Plant; Meteorological
Parameters
1. Introduction
The anthropogenic impact on the adjoining environments
of industrial complexes has been documented in many
parts of the world [1-3]. Heavy metals such as As, Cu, Pb,
Z, Cd and Hg have been evaluated in an agricultural area
nearby the phosphate fertilizer plant, Assiut, Egypt.
Heavy metals resulted from industrial activities are con-
sidered seriously if they exist in the environment with
excess concentration than background values. A large
number of studies have been conducted in urban and ru-
ral environments and reported that particulate matter
surface has a greater tendency of binding up soil derived
elements and larger surface area of small particle size has
affinity of higher accumulation of elemental concentra-
tion [4,5].
Dust fall is depleted continuously from the atmos-
phere through two major routes: dry and/or wet deposi-
tion. The influencing factors of dust fall path depend
upon meteorological conditions such as the intensity and
distribution of rain fall, wind direction and velocity, hu-
midity, temperature and pressure [6,7]. Heavy metal pol-
lution of the atmosphere can be estimated by determining
the concentration of these heavy metals in settleable par-
ticles, because the heavy metals are associated with the
solid particulate matter in many forms. Lead is one of the
metals of most interest in environmental samples. In their
studies, many investigators have concentrated on the
determination of lead alone in particulate matter [8,9] but
other heavy metals have also been extensively studied
[10-13].
A Study of Heavy Metals in the Dust Fall around Assiut Fertilizer Plant
Open Access JEP
1489
Eight dust fall stations were distributed downwind the
phosphate fertilizer plant to determine heavy metal con-
centration in atmospheric deposition where station No. 8
was placed upwind in unpolluted area to be taken as a
control sample [14]. Dust fall samples were collected
monthly and analyzed using Inductively Coupled Plas-
ma-Microscopy (ICP-MS). Concentrations of heavy me-
tals (µg/g) collected from dust fall stations were obtained
as well as dust fall rates (µg·m2·mon1) and their related
statistical data and were compared with other results re-
ported in the literature. Obtained reports of dust fall
measurements showed that the area was enriched with
heavy metals and their concentrations were above the
threshold limit values stated by the environment law
4/1994.
The aim of this study was to estimate dust fall released
in the vicinity of the phosphate fertilizer plant and deter-
mination of heavy metal concentrations associated with
these dusts. These dusts furnished with heavy metals are
deposited in soil raising its mineralogical composition
and give rise to soil pollution. In fact, this is the first data
published in terms of freely available literature on the
levels of heavy metals in the atmosphere since the estab-
lishment of the phosphate fertilizer plant in 1978.
2. Materials and Methods
2.1. Study Area
The study was conducted during 2010-2011 around
Manqabad phosphate fertilizer factory (27˚11'47"N,
31˚6'59"E) situated at 9 km north of city of Assiut, Egypt.
The phosphate factory of Assiut, established in 1978 with
an installed capacity of 14,600 mt, to reach the total plant
capacity of 205,000 mt/year. The plant is located be-
tween the western bank of the River Nile and El-Ibra-
heimia navigation canal and joined with the main Ex-
press roads of Assiut-Cairo, Assiut-Aswan and the Rail-
way station. The climate of the area ranges from tropical
to mild where the year is divisible into a hot and dry
summer season (May-August) and a cold winter season
(November-February). October and March are transition
months. Mean monthly maximum temperature ranges
between 20.3˚C in January and 45˚C June and mean
minimum temperature between 15˚C in January and 30
˚C in May. Mean annual rain fall is 180 mm, about 90%
of which occurs during winter season. During the study
period however, the annual rain fall remained below this
level. Wind directions shifts from predominantly north-
westerly during November through March and north-west-
erly to northerly for most of the remaining months.
The soil of the area is alfisols from parent materials
medium in limestone and soil texture ranges from sand to
loamy sand. The area under investigation is an agricul-
tural of 400 feddans, lived by about 6000 individuals
inhabiting in different communities. The original vegeta-
tion comprises of wheat, faba bean, and clover in winter
and in summer plants are sorghum, maize and cotton. In
addition, some fruit orchards like grapes, banana, jawava
and figs. Figure 1 shows the composition of the area
related to the location of the fertilizer plant.
Figure 1. A map showing the fertilizer plant and related samples.
A Study of Heavy Metals in the Dust Fall around Assiut Fertilizer Plant
Open Access JEP
1490
2.2. Dust Fall Stations
First of all, studies that conducted in evaluating dust fall
around surrounding areas of industrial complexes were
studied [15-21]. Then based on recommendation of the
American Society for Testing and Materials Standard
Method for collection of dust fall ASTM Method D-1739
and analysis books, 8 home dust fall stations were de-
signed and selected as shown in Figure 2. The following
criteria were used to select the stations. The distance be-
tween stations 3 km and sampling must be done in an
open area, far from tall buildings, the distance from
buildings should be at least 20 m, stations should be
away from local sources of pollution, easily accessible
and away from being damaged (Fang, et al., 2004). Col-
lection of dust fall was accomplished using a home dust
fall station as shown in Figure 3. The collector is con-
sisted of a glass box 30 × 30 × 30 cm fixed on a vertical
stand of about 2 m to prevent terrestrial dust to pollute
the sample. The sample was collected in Petri deposition
dish placed above a meter balance interior the glass box
which may give the weight of dust fall directly at any
time. Also the station is provided with an electric circuit
giving alarm to prevent bird’s droppings. The station is
provided with a shield to prevent wind fluctuations. Petri
dishes are replaced at the end of each month to collect
dust fall samples.
Meteorological records indicated that north-west di-
rection is prevailing wind direction hence, it was taken as
downwind direction for the present study. The device of
Global Positioning Systems GPS (Garmen 62s) was used
to demonstrate the locations of dust fall stations. Table 1
gives the global position coordinates of distributed dust
fall stations in the area nearby the fertilizer plant.
2.3. Sample Collection and Preparation
Dust fall stations were mounted 1.5 m high tripods to
Figure 2. Dust fall station in the area near the phosphate
fertilizer plant.
Table 1. Location of dust fall stations and co-ordinates.
E N Station
31 9 7 27 11 48 1
31 8 13 27 11 9 2
31 7 41 27 11 17 3
31 7 13 27 11 38 4
31 7 6 27 11 22 5
31 7 43 27 11 1 6
31 8 30 27 10 58 7
31 6 48 27 12 34 8
avoid the collection of dust picked up by wind eddies.
There was a bird ring on each holder to avoid material
from birds. The collectors were exposed to the atmos-
phere for a sampling period of 30 days. It should be
noted that the measurements represent dry deposition
only, as there were no rainfall during the sampling pe-
riod.
The dry deposits (settleable particulates) were trans-
ferred from the collectors and placed in an iced container
and transported to the analysis laboratory. The content of
dust fall was dried at 105˚C to a constant mass, and then
it was weighed and the quantity of dust fall was com-
puted in µg/m2 month. About 0.10 g of the dried samples
was accurately weighed and extracted with concentrated
ultra-pure nitric acid, sonicated for 30 min in a test tube
heater for one hour, left overnight, and then the solutions
were filtered and diluted with 1% HNO3 in 25 ml poly-
ethylene volumetric flask to the mark [23] As, Cu, Pb, Zn,
Cd and Hg in the dustfall were analytically determined
using Inductively Coupled Plasma-Mass Spectroscopy
(ICP-MS-Perkin Elmer).
3. Results and Discussion
3.1. Determination of Dust Fall
The annual mean rates of deposited dust collected in an
agricultural area from March 2011 to the end of February
2012 around the phosphate fertilizer plant have the val-
ues of 38.2. 47.5, 57.7, 44.3, 39.4, 38.2, 42.7 and 5.9
g/m2 month for the sites no. 1, 2, 3, 4, 5, 6, 7 and 8 re-
spectively. Sites no 1, 2, 3 are located down wind of the
factory, so they received higher deposition rates of par-
ticulate than that of other sites and this is due to the im-
pact of the fertilizer plant on the surrounding area. Fugi-
tive dust and stack emissions especially during charging
and discharging of rock mills are the main sources of
particulate emissions. This rate of deposition is con-
sidered very heavy compared to Pennsylvania guide-
lines for dust fall [24], moreover, these rates of deposi-
tion exceed in terrible amount of standards for dust
A Study of Heavy Metals in the Dust Fall around Assiut Fertilizer Plant
Open Access JEP
1491
Figure 3. Sketch showing the compartments of the dust fall station [22].
deposits in many countries, for instance, the air quality
standards in USA is 5.7 g/m2·month and is 1.93 g/m2.
month as a background value (Stern, 1986), while it is 14
g/m2·month for industrial areas according to Egyptian
law 470/1970. The Environmental Information and
Monitoring Program of Egypt (EIMP) reported that, re-
ports from developed countries referred that if dust fall
values are less than 10 g/m2·month, the area may be con-
sidered clean. According to [25] SANs (2005) the new
dust fall standard has been established and widely used to
determine the potential of dust fall in residential and in-
dustrial areas. Sans (2005) standard threshold stated that
deposited dust in industrial area lies between 18 and 36
g/m2·month as it shown in Table 2.
Sites no 2, 3 showed the vigorous increase of dust fall
than other sites and exceeding other sites the alert limit to
take action of 72 g/m2·month to immediate action and
remediation required following the first incidence of dust
fall rate being exceeded. Dust fall deposition in Site No.
4 is affected by the emissions of the power plant which
present to the north east of this site, so the dust fall rate
of this site is influenced by the emissions of the fertilizer
factory and the power plant emissions. Site 5 is affected
by the emissions of the fertilizer plant and vehicular
emissions of the high way linking Assiut-Cairo. Site 8 is
a reference where deposition rate is 5.9 g/m·month and it
located upwind and far from pollution. In Sites 2, 3 rate
depositions are 6 times and 7 times to that of the back-
ground site. But rates sites 4, 5, 6, 7 equals 4 times ap-
proximately that of the reference site. This gives evi-
dence that the industrial mechanical operations and
chemical processes take part in the factory is responsible
for the increased rates of dust fall in the adjacent area.
3.2. Heavy Metal Contest in Dust Fall
Heavy metal concentration are represented in dust fall
are given in Table 3 and their related statistical data is
illustrated in Table 4. It is revealed that there is variation
of heavy metal concentration in dust fall collected from
different dust fall stations. The highest concentration
value of Cd reached 11.65 mg/kg in site No. 7 affected
by pollution sources of fertilizer emissions beside ve-
hicular emission from high Express way and railway.
The annual deposition of Cd is 4.53 µg/g and the higher
value of Pb is 51.71 µg/g mainly affected from phosphate
fertilizer manufacturing.
The annual mean value of Pb is 22.33 µg/g that ex-
ceeds much the control value of Site 8 that equals 5.33
µg/g. As for Cu and Zn the maximum values were 46.25,
522.9 µg/g and minimum values are 13.27, 105.8 µg/g
and the mean values are 29.46, 235 µg/g respectively,
and this exceed much the control values of Pb and Zn in
site 8. For Hg and As, the range is about 0.23 to 3.98
µg/g, and 0.41 to 3.46 µg/g for Hg and As respectively.
The maximum values of Hg and As were 7.06 and 4.88
µg/g respectively, where the minimum values 0.25, 0.4
A Study of Heavy Metals in the Dust Fall around Assiut Fertilizer Plant
Open Access JEP
1492
\ Table 2. Threshold limit values of dust fall [24].
Band No. Label Dust fall rate, D g/m2·month Action taken
1 Residential D < 18 Permissible for residential and light commercial
2 Industrial 24 < D < 36 Permissible for heavy commercial and industrial
3 Action 36 < D < 72 Requires investigation and remediation if two sequential months lie in
this band or more than three occur in a year
4 Alert 72 < D Immediate action and remediation required following the first incidence of dust
fall rate being exceeded, incident report to be submitted to relevant authority.
Table 3. Represents concentrations of heavy metals (µg/g) in dust fall.
St. No. Cd Pb Cu Zn Hg As
1 2.25 12.15 30.72 209.39 0.38 0.41
2 6.68 3.16 16.23 133.43 3.05 3.84
3 3.83 51.72 26.09 175.95 2.52 4.88
4 4.55 24.20 37.33 312.00 2.37 1.58
5 5.08 38.82 46.75 105.08 0.23 3.42
6 2.13 11.02 13.27 399.30 7.06 0.53
7 11.56 33.50 29.57 522.60 8.98 8.46
Control ST 8 1.15 5.22 8.33 27.15 1.53 1.75
Annual Average 4.53 22.33 29.46 235.00 3.80 3.30
Table 4. Represents the statistical data of heavy metals in dust fall samples.
St. No. Cd Pb Cu Zn Hg As
Mean 4.53 22.33 29.46 235.00 3.80 3.30
Max 11.65 51.72 46.75 522.90 8.98 8.46
Min 2.12 3.16 13.27 105.80 0.23 0.24
SD 3.26 17.57 11.58 152.98 3.31 2.84
Median 4.55 24.20 29.57 209.39 2.52 3.24
Quart_1 3.05 11.58 21.18 154.69 1.35 1.05
Quart_3 5.86 37.16 43.07 355.65 5.05 4.36
Range 2.1 - 11.7 3.2 - 51.7 13.5 - 46.8 105.8 - 522.9 0.2-8.9 0.2 - 8.5
µg/g for Hg and As respectively. The annual mean values
0.03, 0.02 µg/g for Hg and As respectively, and these
values exceeds much the control samples of Hg and As
recorded in reference site No. 8.
The fluctuations of wind speed and direction from
north east in summer to the North West in winter af-
fected depositions of these metals and give variation in
the annual concentrations of heavy metal tested in this
area. The annual mean concentrations of dust fall re-
coded in the investigated area were compared with con-
centrations of the same metals measured in other world
countries (Table 5).
A comparison of the results of this study with other
data worldwide (Table 5) indicates that the rate deposi-
tion of our study are generally less than those recorded in
North Sea, Jamaica, Amman and others . Cadmium in the
present study exceeds the value of the same element in
Bombay and W. Mediterranean. All above, the results of
the present study exceed the threshold limit values (TLV)
stated with the Egyptian Environment law 4/1994.
3.3. Enrichment Coefficient
The enrichment coefficients of the heavy metals were
estimated and these are summarized in Table 6. The en-
A Study of Heavy Metals in the Dust Fall around Assiut Fertilizer Plant
Open Access JEP
1493
Table 5. Deposition rates of heavy metals (µg/m2·month1
compared with other results reported in the literature.
Location Zn Cu Pb Cd
Bombay, India 3097.0 785.8 269.9 3.28
North Sea 920.5 167.7 453.7 19.4
Jamaica 1525.5 332.1 450.4 184.8
W. Mediterranean 361.6 31.6 345.2 4.3
Amman 2474.4 462.8 349.8 12.5
Assiut, Egypt 235 29.46 22.33 4.53
Table 6. Enrichment factor of heavy metals deposits at the 8
dust fall stations near the phosphate fertilizer plant.
Element Average Enrichment Factor Range
As 1.9 0.2 - 4.8
Cu 3.5 0.3 - 5.6
Pb 4.3 0.6 - 9.9
Zn 8.7 3.9 - 19.2
Cd 3.9 1.9 - 10.0
Hg 2.5 0.2 - 4.6
richment coefficient was computed as the ratio of the
heavy metal concentration in the settleable particulates
(dust fall) to the concentration in the soil collected and
analyzed at the same time [10].
The values in the table indicate high enrichment of the
dust fall and follow the order Zn > Pb > Cd > Cu > Hg >
As. The high values of enrichment coefficients suggest
that these elements are anthropogenic in origin as a result
of fugitive and stack emissions from phosphate fertilizer
plant. Figure 4 shows enrichment factors related to dust
fall stations.
3.4. Correlation Coefficient
The correlation coefficient (r) was calculated from ele-
ment concentrations in order to predict the possibility of
a common source. The (r) values are generally high re-
cording extreme correlation of heavy metals where r =
0.89 for Cd-As and r = 0.88 for Zn-Hg. Table 7 indicated
that there was strong significant correlation for Cd-Hg (r
= 0.54), Pb-Cu(r = 0.53), Pb-As(r = 0.52) and Cu-Hg(r =
0.50). Also Hg correlated Zn with r = 0.48 and Cd corre-
lated Zn with r = 0.44. This may indicate that these met-
als have a common anthropogenic source; possibly fer-
tilizer plant emissions.
4. Conclusions
General observations on the investigated area showed
Figure 4. Enrichment factors of heavy metals in dust fall
samples.
Table 7. The correlation coefficient r calculated of heavy
metals in dust fall samples.
As Hg Zn Cu Pb Cd
0.89 0.54 0.44 0.10 0.18 1 Cd
0.52 0.10 0.04 0.53 1 Pb
0.10 0.50 0.24 1 Cu
0.31 0.88 1 Zn
0.48 1 Hg
1 As
that vegetation environment has been adversely affected
by factory emissions. Changes in plant height, canopy
area, leaf area, total plant biomass, chlorophyll and ne-
crosis may indicate the adverse affects of toxic gases
such as fluoride, SO2 and allocation of dry matter at the
polluted sites [17,23], reported that accumulation of
heavy metals in soil hinders plants from the absorption of
nutrients, affects microbial activity and causes changes
of vegetation characteristics.
The study revealed that the area suffering high rates of
dust fall which deteriorates plants, water, soils and make
confusion for residents. Determination of heavy metals in
dust fall showed that the area is heavily enriched with Pb,
Zn, Cu, Hg, Cd and As and correlation factors indicated
that these heavy metals have anthropogenic origin. Con-
trol measures may be applied to the fertilizer plant and
soils may be provided with remediation technology.
5. Acknowledgements
The authors would like to acknowledge Dr. Atif Abo
Elwafa, Dean of Sugar Research Technology Institute,
SRTI for his support during this work. Also thanks to
Engineer Saleh the General Manager of Environment and
Safety Division in the Phosphate Fertilizer Plant for in-
A Study of Heavy Metals in the Dust Fall around Assiut Fertilizer Plant
Open Access JEP
1494
formation he provided and support during conduction of
this research.
REFERENCES
[1] R. L. Solomon and W. Hartford, “Lead and Cadmium in
Dusts and Soils in a Small Urban Community,” Environ-
mental Science & Technology, Vol. 10, No. 8, 1979, pp.
773-777. http://dx.doi.org/10.1021/es60119a010
[2] S. A. Raoof and M. Al-Shahhaf, “Study of Particulate
Pollutants in the Air of Riyadh by Energy Dispersive
x-Ray Fluorescence Spectrometry,” Atmospheric Envi-
ronment, Vol. 26, No. 3, 1992, pp. 421-423.
[3] K. T. Hindy and S. A. Farag, “Composition of Suspended
and Settled Particulate Matter from the Atmosphere: A
Comparative Study,” Environmental Pollution Series B,
Chemical and Physical, Vol. 5, No. 4, 1983, pp. 247-254.
http://dx.doi.org/10.1016/0143-148X(83)90020-4
[4] V. Valkovic, “Trace Elements in Coal,” CCRC Press,
Florida, 1983.
[5] P. K. Goel and R. K. Trivedy, “An Introduction to Air
Pollution,” Technoscience Publication, Jaipur, 1998.
[6] A. Savant, “Study of Some Toxic Metals in Surface Soils
in Relation to Environmental Factors,” Ph.D. Thesis, Pt.
Ravishankar Shukla University, Raipur, 1990.
[7] X. Querol, A. Aastuey, J. A. Puicercus, E. Mantilla, F.
Plana and R. Juan, “Seasonal Evaluation of Suspended
Particles around a Large Coal-Fired Power Station: Che-
mical Characterization,” Atmospheric Environment, Vol.
32, No. 11, 1998, pp. 719-731.
http://dx.doi.org/10.1016/S1352-2310(97)00340-3
[8] E. A. Ali, M. N. Nasralla and A. A. Skakour, “Spatial and
Seasonal Variation of Lead in Cairo Atmosphere,” Envi-
ronmental Pollution Series B, Chemical and Physical,
Vol. 11, No. 3, 1986, pp. 205-210.
http://dx.doi.org/10.1016/0143-148X(86)90024-8
[9] M. N. Nasralla, “Lead in Jeddah Urban Dust,” Environ-
mental Pollution Series B, Chemical and Physical, Vol. 8,
No. 2, 1984, pp. 133-141.
http://dx.doi.org/10.1016/0143-148X(84)90023-5
[10] Z. Kozak, J. Nieko and D. Kozak, “Precipitation of Heavy
Metals in the Lȩzna-Wlodawa Lake Region,” Science of
the Total Environment, Vol. 133, No. 1-2, 1993, pp. 183-
192. http://dx.doi.org/10.1016/0048-9697(93)90120-U
[11] K. T. Hindyn, “Silicon, Aluminum, Iron, Copper and Zinc
Levels in Desert Soil-Related Dust Deposits in Cairo,”
Atmospheric Environment, Vol. 25, No. 2, 1991, pp. 213-
217.
[12] R. A. Tripath, S. C. Ashawa and R. N. Khandekar, “At-
mospheric Deposition of pb, cd, cu and zinc in Bombay,
India,” Atmospheric Environment, Vol. 27, No. 2, 1993,
pp. 269-273.
[13] M. F. El-Gandour, M. S. Adel Salam, K. T. Hindy and M.
M. Kamel, “Studies on Air Pollution from Construction
Plants in the Helwan Industrial Area. III. Alkali, Earth
Alkali and Heavy Metal Constituents of Dust-Fall,En-
vironmental Pollution Series B, Vol. 4, No. 4, 1982, pp.
303-313.
[14] Th. A. Taha, A. K. M. Mohamed and M. A. Gandour,
“Environmental Assessment and Control of Air Emis-
sions Related in Sugar Industry,” M.Sc. Thesis, Envi-
ronmental Sciences and Technology, Sugar Technology
Research Institute, Assiut University, Assiut, 2009.
[15] American Society for Testing and Materials (ASTM
US-EPA), “Test Method for Collection and Measurement
of Dust Fall,” Conshohocken, 2004.
[16] R. O. Glibert, “Statistical Pollution Monitoring,” John
Wiley Publication, New York, 1987.
[17] N. Dubey and S. Pervez, “Investigation of Variation on
Ambient PM10 Levels within Urban-Industrial Envi-
ronment,” Aerosol and Air Quality Research, Vol. 8, No.
1, 2008, pp. 54-64.
[18] R. K. Sharma and S. Pervez, “A Case Study of Spatial
Variation and Enrichment of Selected Elements in Am-
bient Particulate Matter around a Large Coal-Fired Power
Station in Central India,” Environmental Geochemistry
and Health, Vol. 26, No. 3-4, 2004, pp. 373-381.
http://dx.doi.org/10.1007/s10653-005-6369-1
[19] Y. F. Quraishi and G. S. Pandy, “Exposure of Steel Plant
Related Dusts in Domestic Environments in Bhilai Resi-
dential Area,” Indian Journal of Environmental Protec-
tion, Vol. 13, No. 8, 1993, pp. 580-583.
[20] J. Injuk, R. Van Grieken and G. de Leeuw, “Deposition of
Atmospheric Trace Elements into the North Sea: Coasta,
Ship, Platform Measurements and Model Predictions,”
Atmospheric Environment, Vol. 32, No. 17, 1998, pp.
3011-3025.
http://dx.doi.org/10.1016/S1352-2310(97)00497-4
[21] A. Jiries, T. El-Hasan and W. Manasrah, “Qualitative
Evaluation of the Mineralogical and Chemical Composi-
tion of Dry Deposition in the Central and Southern High-
lands of Jordan,” Chemosphere, Vol. 48, No. 9, 2002, pp.
933-938.
http://dx.doi.org/10.1016/S0045-6535(02)00177-7
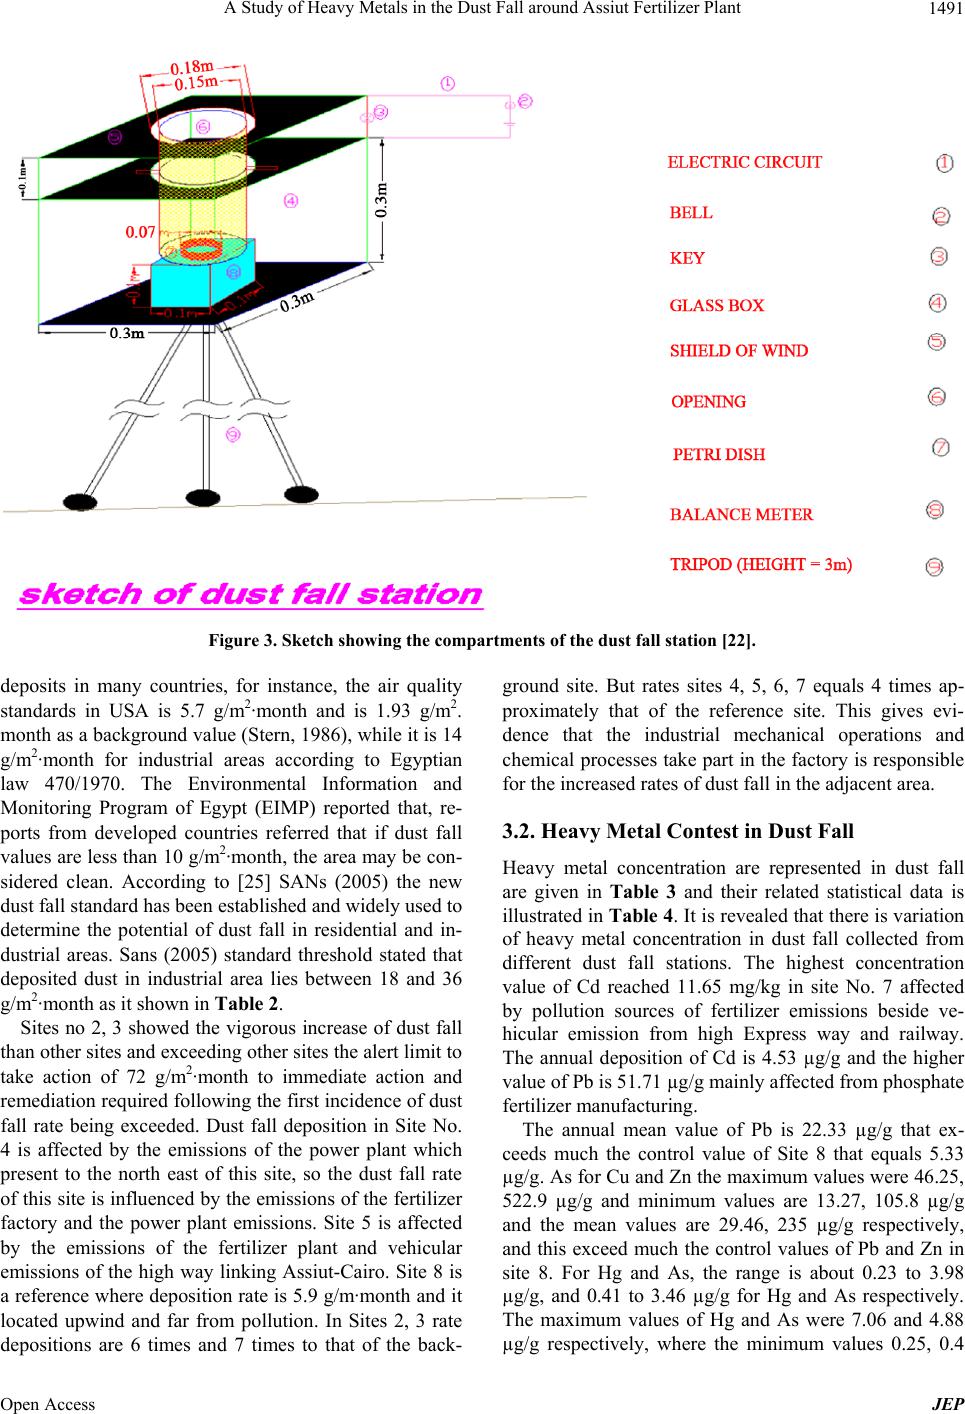
[22] A. M. Thabet, A. R. Rabeiy, A.-K. M. Mohamed and M.
A. Ghandour, “Environmental Assessment of Heavy Me-
tal Pollution from Phosphate Fertilizer Plants,” Ph.D.
Dissertation, Sugar Technology Research Institute, Assiut
University, Assiut, 2013.
[23] A. D. Bhanarkar, P. S. Rao, D. G. Gajghate and P. Nema,
“Inventory of SO2, PM and Toxic Metal Emissions from
Industrial Sources in Greater Mumbai, India,” Atmos-
pheric Environment, Vol. 39, No. 21, 2005, pp. 3851-
3864. http://dx.doi.org/10.1016/j.atmosenv.2005.02.052
[24] D. Narayan, M. Agrawal, J. Pandy and J. Singh, “Changes in
Vegetation Characteristics Downwind of an Aluminium
Factory in India,” Annals of Botany, Vol. 73, No. 5, 1994,
pp. 557-565.
[25] South African National Standards (SANS), “South Afri-
can National Standard, Ambient Air Quality-Limits for
Common Pollutants,” Standards South Africa, Pretoria.