Open Journal of Civil Engineering, 2013, 3, 234-241
Published Online December 2013 (http://www.scirp.org/journal/ojce)
http://dx.doi.org/10.4236/ojce.2013.34028
Open Access OJCE
Seismic Response and Stability Analysis of Single Hinged
Articulated Tower
Prashant Atreya1, Nazrul Islam2, Mehtab Alam1, Syed Danish Hasan3
1Department of Civil Engineering, Jamia Millia Islamia University, New Delhi, India
2Civil Engineering Department, Islamic University, Madina, KSA
3University Polytechnic, Aligarh Muslim University, Aligarh, India
Email: prashantatrey@yahoo.com
Received November 3, 2013; revised December 3, 2013; accepted December 10, 2013
Copyright © 2013 Prashant Atreya et al. This is an open access article distributed under the Creative Commons Attribution License,
which permits unrestricted use, distribution, and reproduction in any medium, provided the original work is properly cited.
ABSTRACT
Study of dynamic stability phenomenon in transient systems has always created interest amongst the researchers be-
cause of its inherent non-linearities. Offshore structures subjected to wave, earthquake or wind loads or a combination
of these loads show non-linear transient behaviour. As oceanic waves are better modelled as stochastic process, there
is a need to investigate the stochastic stability of flexible offshore structures as well. Present study has been carried out
to determine seismic response of Single Hinged Articulated Tower (SHAT) under different categories of wave loads
and earthquake followed by its dynamic stability analysis. Different phases of wave/earthquake loading on SHAT have
been explored to investigate dynamic instabilities existing during each phase. Two dimensional phase plots have been
used to identify phases of dynamic instability existing within the responses of SHAT under various conditions of load-
ing.
Keywords: Single Hinged Articulated Tower; Earthquake; Time History; Phase Plot
1. Introduction
Compliant offshore structures are favoured for deep sea
water operations since they avoid unacceptably high hy-
dro-dynamic loads by yielding to wave and current ac-
tions leading to economic designs. These structures have
large displacements with inherent non-linearities, so pre-
diction of behaviour of these structures in oceanic envi-
ronment is difficult and is met with many challenges.
Efforts are made to use simplified realistic mathematical
models to gain important insight into the response be-
haviour of these structures and to explore the possibility
of their dynamic instability and chaotic motion. The pres-
ence of strong geometric non-linearity and non-linearity
arising due to fluid structure interaction leads to the pos-
sibility of dynamic instability of the systems. On account
of these non-linearities, numerical investigations of com-
pliant offshore structures have revealed complex behav-
iour involving sub-harmonic, super-harmonic and aperi-
odic solutions (Banik and others) [1-3]. Although, during
last more than a decade, researchers have carried out
seismic response of compliant offshore structures (Lina,
H., Youngang, T. and Cong, Y.I., (2006) [4], Chandra-
sekaran et al. 2008 [5]; Hasan, S.D., 2011 [6]), more
efforts are required for stability analysis in non-linear
environment. The stability analysis may consist of per-
turbating an approximate solution. Various methods of
dynamic stability analysis of non-linear system in closed
form by using analytical, semi-analytical and numerical
techniques have been developed (Friedmann et al., 1977
[7]; Chua and Ushida, 1981 [8]; Burton, 1982 [9], Cai,
G.Q. (1995) [10], Lin, Y.K. and Cai, G.Q., 1995 [11]).
Application of these techniques covers a wide range of
application problems including standard problems of
Van-Der-Pol oscillator, Duffing Oscillator, Double Pen-
dulum etc. (Hamdan and Burton, 1993 [12]; Ravindra
and Mallik, 1994 [13]; Blair et al., 1997 [14]; Yu and Bi,
1998 [15]). The main focus of application problems was
to study and investigate capabilities of the methods to
bring out all possible instability phenomenon latent in the
system. Islam Saiful, A.B.M (2013) [16] used two di-
mensional Phase Plots to determine dynamic stability
phenomenon in SPAR platforms.
Single Hinged Articulated Tower Platform is one of
the compliant structures (Figure 1) which is economi-
cally attractive especially as loading and mooring termi-
P. ATREYA ET AL. 235
nal in deep waters. These platforms are comparatively
light compared to the conventional fixed platforms. The
tower itself is a linear structure, flexibly connected to the
sea bed through a cardon/universal joint and held verti-
cally by the buoyancy force acting on it. The part of the
tower emerging from the water supports the super struc-
ture designed to suit the particular application e.g. a
tanker to be loaded, flaring of waste gases, etc. As the
connection to the sea bed is through the articulation, the
structure is free to oscillate in any direction and does not
transfer any bending moment to the base. The articulated
tower which can be used at larger water depth may also
have one or more number of joints at the intermediate
level. Such towers having joints at the intermediate level
are called multi hinged articulated tower.
As the articulated tower is compliant in nature, it
moves with the waves and thus the wave force and
bending moment along the tower will be less compared
to a fixed structure. Usually the natural period of the
towers is of the order of 40 to 90 seconds and hence dy-
namic amplification-factor is small.
2. Scope of Present Study
Effects of seismic excitation/stochastic response of tower
in the presence of regular/random wave forces have been
examined.
Figure 1. Single hinged articulated tow e r.
Dynamic Stability has been examined/analysed for ef-
fect of regular/random waves and earthquake duration on
serviceability and survivability of tower.
Concepts of minimum potential energy and Phase
Plots have been used to determine the regions/range of
dynamically stable periods during the affected motion of
the tower.
Variation of stabilizing and destabilizing forces and
their impacts on Shear Force, Axial Force, Bending mo-
ments along the axis of Tower and stress on hinge have
been calculated.
3. Methodology
In the present work firstly a nonlinear dynamic analysis
of the said structure has been carried out for its time do-
main responses using Langrangian approach. The ran-
dom waves have been simulated by Monte-Carlo tech-
nique represented by Modified PM Spectra. Modified
Morison’s equation has been used for estimation of hy-
dro-dynamic loading. Water particle kinematics has been
governed by Airy’s linear wave theory. To incorporate
variable submergence, Chakraborty’s correction [17,18]
has been applied. Seismic inputs have been applied using
Northridge spectra. Stability assessment has been carried
out using two dimensional phase plots.
Assumptions and Structural Idealizations
In the present study, the solution has been obtained using
Finite Element approach, so the following assumptions
and structural idealizations have been made for formula-
tion of the problem in respect of Single Hinged Articu-
lated Tower (Figure 2):
1) Articulated tower is modelled as a stick with masses
lumped at the nodes. The universal joint at base is
modelled as mass-less rotational spring of zero stiff-
ness. Flexural deformations of the tower have been
assumed to be negligible as compared to its dis-
placements as a rigid body.
2) The entire tower has been discretized into “np” num-
ber of elements of uniform length for the estima-
tion of conservative and non-conservative forces,
while diameter, mass and buoyancy may vary. The
submerged elements of the tower have been subjected
to time dependent hydro-dynamic loading. Due to
non-linear forces acting on the tower, the number of
submerged elements shall also vary with respect to
time.
3) Drag force is assumed to be proportional to the rela-
tive water particle velocity w.r.t. the structure, oscil-
lating under wave and ground motion. The structural
damping of the system is specified as a fraction of the
critical damping corresponding to the un-deflected
coration of the tower. nfigu
Open Access OJCE
P. ATREYA ET AL.
Open Access OJCE
236
Figure 2. SHAT model.
4) Earthquake is assumed to be a broad band random
stationary process described with the help of an acce-
logram. The behaviour of the fluid surrounding the
structure shall not be affected by the slow motion of
the compliant tower.
5) Analysis due to earthquake excitation and due to
wave forces are carried out independently, and there-
fore water particle kinematics is taken to be negligible
for the seismic forces. Only two dimensional motion
of the tower in the plane of the environment loading
have been considered in the analysis.
(Geometrical and Mechanical Properties of SHAT
Model are given in Table 1 and Solution Flow chart is
given at Figure 3).
4. Estimation of Load on Structure
4.1. Wave Loads
A variety regular waves as suggested by Jameel & Ah-
mad (2011) [19] have been considered. In order to inves-
tigate the combined effect of current and earthquake,
current velocities of 1.0 m/s, uniform throughout the
depth have also been considered. The influence of vari-
ous parameters such as variable buoyancy, added mass,
instantaneous towers orientation, variable submergence
and effect of current, on the response of SHAT and its
stability aspects has been investigated in detail. To cal-
culate the wave force on latticed articulated tower, the
latticed tower has been replaced with cylindrical shaft of
equivalent diameter. Wave forces on the submerged part
of the latticed tower (cylindrical shaft) have been esti-
mated by the modified Morison’s equations, which duly
takes into account the relative motion of the structure and
water. The water particle velocities and accelerations
have been stipulated by Airy’s wave theory. To incorpo-
rate the effect of variable submergence, Chakrabarti’s
approach has been adopted. The transformation matrix
has been used to compute the normal and tangential
component of the hydrodynamic forces on each element
of the tower corresponding to instantaneous deformed
configuration of the tower. The updated mass-moment of
inertia of the tower has been incorporated in the consis-
tent mass and damping matrices. Newmark’s Beta inte-
gration scheme has been deployed to solve the equation
of motion taking into account all non-linearities involved
in the system.
4.2. Seismic Loading
Northridge accelogram has been used to provide input
for 39.98 seconds for ground acceleration time history
(Figure 4) for calculating seismic response of the tower
by random vibration analysis. The wave loading are not
correlated with seismic loadings. The two analysis are
carried out independently. The analysis under earthquake
alone is carried out using water particle kinematics as
zero. Therefore, it is assumed that in the seismic analysis
alone, the water particle kinematics are zero.
To observe the behaviour due to the combined wave
and earthquake forces, Numerical studies are conducted
to investigate the effects of initial conditions, current and
wave on the seismic response of the tower. Without wave,
the tower is assumed to have zero displacement and zero
velocity at time t = 0. When wave and earthquake are
considered to act together, different initial conditions of
the tower are assumed depending upon the oscillating
state of the tower at the inst nt when the structure en- a
P. ATREYA ET AL. 237
Figure 3. Flow chart for problem solution.
Table 1. Geometrical and mechanical properties of SHAT under study.
Geometric characteristics Mechanical properties
Height of tower (l) 400 m Deck mass (MD) 2.5 × 10⁶ Kg
Water depth (d) 350 m Structural mass (SMT) of tower 2.0 × 10⁴ Kg
Height of ballast (HBL) 120 m Mass of ballast (MBT) 44,840 Kg
Height of buoyancy chamber (H) 70 m Mechanical oscillations
Position of buoyancy chamber (PBC) 310 m Time period 38 sec.
For chamber Hydrodynamic specifications
Effective diameter for buoyancy (DB) 20 m Drag coefficient (CD) 0.6
Effective diameter for added mass 7.5 m Inertia coefficient (CM) 2.0
Effective diameter for drag 14.5 m Mass density of sea water 1024 Kg/cu-m
Effective diameter for inertia 7.5 m Random sea spectrum PM SPECTRUM
For tower shaft
Effective diameter for buoyancy (DB) 7.5 m
Effective diameter for added mass 4.5 m
Effective diameter for drag 13 m
Effective diameter for inertia 4.5 m
Open Access OJCE
P. ATREYA ET AL.
238
Figure 4. Northridge eart hquake .
counters the earthquake. Further, it is assumed that the
earthquake forces act on the structure when it oscillates
in a steady state under the regular sea.
The responses induced due to earthquake are further
compared with the responses due to strong sea-state/
waves/waves in order to establish relative severity of the
two independent events. The commencement of the
earthquake has been considered such that the first prom-
inent peak of accelogram matches with the crest of the
wave in order to get the maximum impact of wave and
Earthquake load. The seismic responses of tower are
further compared with the response due to strong sea
states.
5. Discussion of Results on Seismic Response
and Dynamic Stability
Single Hinged Articulated Tower in sea exhibits non-
linear behaviour because of inherent non-linearities in the
system. These non-linearties are produced by non-linear
excitation and restoring forces, damping non-linearity,
etc. which may lead to complex response behaviour of
SHAT. Non-linear restoring force is from the geometric
non-linearity of the structure. Non-linear responses of the
system are analysed to investigate different kinds of dy-
namic instability phenomenon. During the present study,
SHAT was subjected to a variety of regular wave load
along with Northridge Earthquake excitation at different
time.
The responses are obtained in terms of heel angle rota-
tion, tip displacement, shear force, bending moment, ax-
ial force, base shear force, Stabilizing/Destabilizing mo-
ments etc. Here, we shall discuss in details a case depict-
ing behaviour of Tower under regular wave load and
earthquake. The response and dynamic stability analysis
has been done using Time history and two dimensional
Phase Plots (Mallik, A.K. and Bhattacharjee, J.K. (2005)
[20].
Strong Regular Wave (H-17.15 m, T-13.26 s)
with Northridge Earthquake at 308.7 Second
The analysis was performed to evaluate the response of
Strong Regular Wave having wave height as 17.15 m,
Time period as 13.26 sec. and Northridge Earthquake
applied at 308.7 second. Wave load was initially applied
at 0 second. Upto 100 seconds the motion was unstable,
then due to hydrodynamic dampening, the impact of reg-
ular wave on Tower got gradually reduced and the Tower
motion became stable by 250 second. There after, North-
ridge Earthquake was applied at 308.7 second i.e. at the
crest of wave. Time history plot for Hinge angle rotation,
is given at Figure 5, which provides information about
magnitude of hinge angle responses generated due to
Wave and Earthquake loads. The phase plots as shown
from Figures 6-10 have been generated for the com-
1.0E01
8.0E02
6.0E02
4.0E02
2.0E02
0.0E+00
2.0E02
4.0E02
6.0E02
8.0E02
0100 200 300 400 500 600 700 800
TIME(sec.)
ANGULARANGULARROTATION(rad.)
Time HistoryforRegularWaveH17.15m,T13.26s,EQ‐HingeAngleR otation
Figure 5. Time history for hinge rotation.
1.5E02
1.0E02
5.0E03
0.0E+00
5.0E03
1.0E02
1.5E02
2.0E02
1.00E018.00E02 6.00E02 4.00E02 2.00E02 0.00E+002.00E02 4.00E02 6.00E02 8.00E02
PHASEPLOTFORCOMPLETEDURATIONOF2000s
HEELANGLE(rad.)
ANGULARVELOCITY(rad/s)
HEELANGLE(rad.)
ANGULARVELOCITY(rad/s)
Figure 6. Phase plot for complete duration of 2000s.
1.2E02
1.0E02
8.0E03
6.0E03
4.0E03
2.0E03
0.0E+00
2.0E03
4.0E03
6.0E03
8.0E03
1.00E01 8.00E026.00E02 4.00E022.00E02 0.00E+002.00E02 4.00E02 6.00E028.00E02
PHASEPLOTFROM308.7to348.68sDURINGEQ
HEELANGLE(rad.)
ANGULARVELOCITY(rad/s)
HEELANGLE(rad.)
ANGULARVELOCITY(rad/s)
HEELANGLE(rad.)
ANGULARVELOCITY(rad/s)
HEELANGLE(rad.)
ANGULARVELOCITY(rad/s)
Figure 7. Phase plot from 308.7 - 348.68 s during North-
ridge earthquake.
Open Access OJCE
P. ATREYA ET AL. 239
1.0E02
5.0E03
0.0E+00
5.0E03
1.0E02
1.5E02
6.00E02 4.00E02 2.00E02 0.00E+002.00E02 4.00E02 6.00E0
2
PHASEPLOTFROM348.68to449sINTERVAL
HEELANGLE(rad.)
ANGULARVELOCITY(rad/s)
HEELANGLE(rad.)
ANGULARVELOCITY(rad/s)
HEELANGLE(rad.)
ANGULARVELOCITY(rad/s)
HEELANGLE(rad.)
ANGULARVELOCITY(rad/s)
Figure 8. Phase plot from 348.68 to 449 s interval after
Earthquake.
8.0E03
6.0E03
4.0E03
2.0E03
0.0E+00
2.0E03
4.0E03
6.0E03
8.0E03
2.00E02 1.50E02 1.00E02 5.00E03 0.00E+005.00E03 1.00E02 1.50E02 2.00E02
PHASEPLOTFROM449to650sINTERVAL
HEELANGLE(rad.)
ANGULARVELOCITY
(rad/s)
HEELANGLE(rad.)
ANGULARVELOCITY
(rad/s)
HEELANGLE(rad.)
ANGULARVELOCITY
(rad/s)
HEELANGLE(rad.)
ANGULARVELOCITY
(rad/s)
Figure 9. Phase plot from 449 - 650 s interval depicting sta-
bilization process.
8.0E03
6.0E03
4.0E03
2.0E03
0.0E+00
2.0E03
4.0E03
6.0E03
8.0E03
1.50E02 1.00E025.00E03 0.00E+005.00E03 1.00E02 1.50E02
PHASEPLOTFROM650to2000s
HEELANGLE(rad.)
ANGULARVELOCITY
(rad/s)
HEELANGLE(rad.)
ANGULARVELOCITY
(rad/s)
HEELANGLE(rad.)
ANGULARVELOCITY
(rad/s)
HEELANGLE(rad.)
ANGULARVELOCITY
(rad/s)
Figure 10. Phase plot from 650 - 2000 s duration showing
Stabilized SHAT motion.
plete period of 2000 seconds, from 308.7 to 348.68 sec-
onds, from 348.68 to 449 seconds, from 449 to 650 sec-
onds and from 650 to 2000 seconds. From phase plots, it
was observed that motion from 308.7 to 348.68 seconds
was under earthquake impact and showed bifurcations
and chaos. During Earthquake, absolute Maximum heel
angle was 5.0 degrees, which was well outside the per-
mitted serviceable limits of the Tower. As the earthquake
was applied for 39.98 seconds duration, after 348.68 sec-
onds the hydrodynamic dampening started reducing re-
sponses and trajectories started moving towards stable
limit. However, from 348.68 to 449 seconds period, the
motion has been non-harmonic, aperiodic and asymmet-
ric. It took another 200 seconds for responses to settle
down and stabilize. By 650 seconds, the responses be-
came harmonic, symmetric and periodic and perfectly
stable. From above discussion it is clear that with the
onset of wave load, although the tower is in serviceable
limits but shows slight instability for period of approx.
250 second. After onset of earthquake at 308.7 seconds it
becomes unserviceable as well as unstable for a period of
approximately another 350 seconds. Then it showed the
stable behaviour. The hydrodynamic dampening effects
are more prominent in stronger waves and the system
reaches stability much early. During the entire motion,
the tower has been safe due to net positive stabilizing
moments acting on the tower. The Tower during initial
wave period of 100 seconds can be used with some dis-
comfort. Use of tower should be further avoided during
Earthquake period, especially from 308.7 to 650 seconds.
6. Conclusions
SHAT model was subjected to a variety of waves with
and without earthquake loads. The observations for seis-
mic responses and stability determination were analyzed
and following conclusions have been drawn:
6.1. Conclusive Remarks on Seismic Response of
SHAT
1) The initial condition described by the instant of time
of the steady state tower motion at which the earth-
quake strikes has significant effects on the tower re-
sponse. Peak values differed upto 7% - 8% due to
change in initial conditions i.e. when the earthquake
is applied at axis or applied at crest of wave in regular
sea. These values may further differ appreciably if
earthquake occurs at the time corresponding to trough
or crest of the regular wave.
2) Responses induced by earthquake in regular/random
sea are further compared with the responses due to
independent Strong large size wave in regular/random
sea to obtain the relative severity. Hinge angle rota-
tion of SHAT due to strong regular wave (H-30m,
T-15 sec.) alone is 4.21 × 10² radian while it in-
creased to 1.43 × 101 radian (3.39 times) when the
tower is hit by only Northridge earthquake. Similarly
in random sea, hinge angle rotation with only Strong
large size wave (H-30m, T-15s) is 3.72 × 10² radian,
while it increased to 1.28 × 101 radian (3.44 times)
with small wave (H-2.15, T-4.69s) and Northridge
Earthquake. This proves that even small duration
earthquake gives big jolt to the structure leading to
higher values of hinge angle rotation.
3) Maximum Hinge angle rotation due to small size reg-
ular wave (H-2.15 m, T-4.69s) and Northridge earth-
quake is 8.73 times more than that due to regular
Open Access OJCE
P. ATREYA ET AL.
240
wave alone. Maximum Hinge angle rotation for large
size wave (H-17.15m, T-13.26s) and earthquake is
3.17 times more than that due to regular wave. This is
because larger size waves produce sufficient magni-
tude of hydrodynamic dampening so as to attenuate
peaks in responses.
4) The maximum tower response for Northridge earth-
quake alone in regular sea has been observed to be
2.68 times more than that due to the combined load-
ing of wave (H-2.15m, T-4.69s) and Northridge
earthquake. This again indicates that introduction
wave increases hydrodynamic dampening and thus
size of peak generated due to Earthquake impact is
reduced.
5) With the inclusion of the current in random/regular
sea wave, there is 2.58% - 2.82% increase in Hinge
angle response.
6) The absolute maximum values of Hinge angle rota-
tions have been found to be in line with nature/size of
waves. For each load case, values of RMS and Stan-
dard Deviation for Hinge angle rotation are in the
same range.
7) The base shear in case of only Northridge earthquake
is 19.69 times the base shear value due to Strong
large size regular wave. This shows that Base shear
value in this load case has increased more rapidly as
compared to increase in heel angle values. In each
load case, values of RMS and Standard Deviation for
Base Shear are in the same range.
8) When current is introduced in regular sea with or
without Northridge Earthquake, the Maximum value
of Base shear reduces.
9) For different loadings, Base Axial Force values,
Mean and RMS values have common coefficient as
108. The changes in these values due to different
combinations of loadings are very small.
10) Maximum bending moment due to small size regular
wave (H-2.15m, T-4.69s) and Northridge earthquake
is 2.46 times more than that due to regular wave alone.
Maximum Bending moment for large size wave
(H-17.15m, T-13.26s) and earthquake is 1.51 times
more than that due to regular wave. This is because
larger size waves provide hydrodynamic damping and
thus reduce the seismic response.
6.2. Conclusive Remarks on Dynamic Stability
Analysis of SHAT
1) During the earthquake, the tower tends to vibrate at
its own natural frequency while the steady state re-
sponse again takes place in wave frequency when the
earthquake is over.
2) The time required to achieve the steady state response
after the duration of earthquake depends upon the sea
environment at that time. High sea state dampens the
seismic response quickly.
3) Although short duration intensive earthquake load
gives a big jolt to the tower but it survives due to in-
herent restoring capacity. The responses due to short
duration Earthquake die out quickly when the waves
are also present. In the absence of earthquake and
other environmental loads tower oscillations are
checked by hydrodynamic dampening due to waves
and due to tower oscillation and inherent tower
buoyancy.
4) Subsequent to application of Wave/Earthquake loads,
the time taken for Stabilization depends upon the na-
ture/Size of the wave. The larger the size of wave, the
smaller is the Stabilization period. For Small size
wave (H-2.15, T-4.69s) with or without Earthquake,
the time taken to achieve dynamic stability was 610
seconds. For middle sized wave (H-11.15, T-10.69s),
the time taken for dynamic stability is 350 seconds.
For another higher size wave (H-17.15, T-13.26s), the
time taken for dynamic stability is 250 seconds. For
Strong large size wave (H-30m, T-15s), the time tak-
en for dynamic stability is 200 seconds.
5) When only Northridge Earthquake is applied in calm
sea (with minimal size regular wave), the time taken
for dynamic Stability was 1000 sec. Waves/current
provide hydrodynamic dampening to the structure, in
the absence of dampening the structure takes more
time to stabilize.
6) With the introduction of current in wave load with or
without Earthquake, the time taken for dynamic sta-
bility slightly reduces which shows that the current
adds up to the hydrodynamic damping effects.
7) SHAT model subjected to small regular wave
(H-4.8m, T-10.4s) and 4 varieties of Earthquake
loadings (1994 Northridge-NWH360, 1979 Imperial
Valley H-E11140, 1979 Imperial Valley H-E13140 &
1999 Duzce, Turkey-1062-N) showed that absolute
Maximum values of responses arising out of impact
of all the four types of Earthquakes are having similar
magnitude(except for some minor variation). North-
ridge Earthquake is found to be severest of all four.
The stabilization period after each earthquake is 640
sec., which once again emphasize the fact that stabi-
lization period is a property of nature/size of wave.
Nature of Earthquake, however governed the shape of
Time History/Phase plot of responses.
8) In all the regular wave cases analysed during study, it
was observed that during the initial period pertaining
to onset of waves or period pertaining to Earthquake,
the dynamic instability is visible in Phase plots. The
motion is non-harmonic, aperiodic and asymmetric.
Bifurcations are easily visible in the phase plots con-
firming dynamic instability. With the passage of time,
the hydrodynamic dampening effects reduce responses.
Open Access OJCE
P. ATREYA ET AL.
Open Access OJCE
241
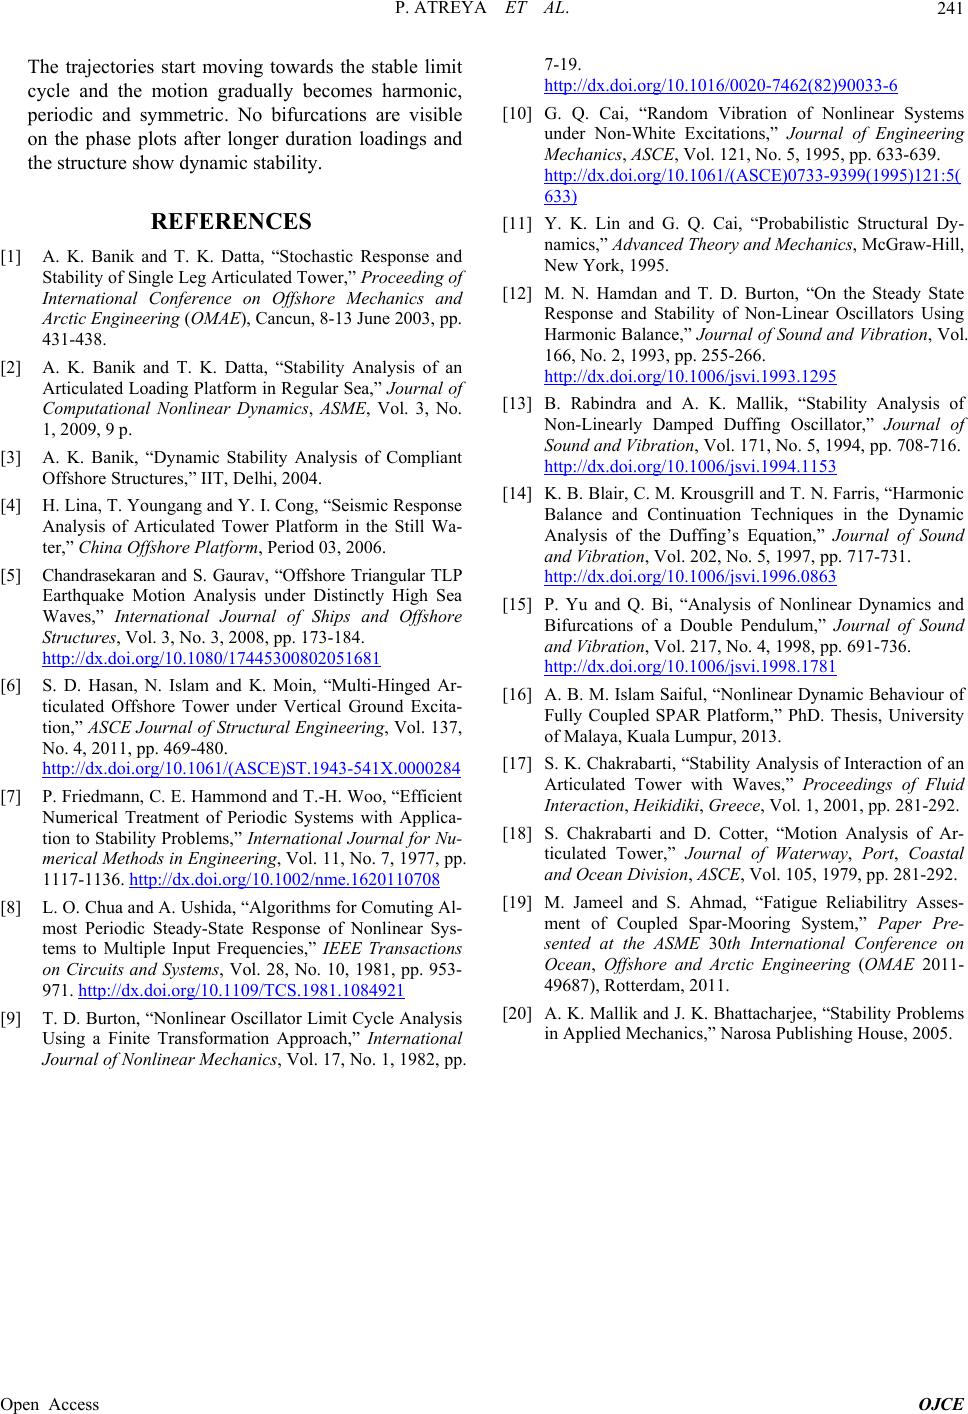
The trajectories start moving towards the stable limit
cycle and the motion gradually becomes harmonic,
periodic and symmetric. No bifurcations are visible
on the phase plots after longer duration loadings and
the structure show dynamic stability.
REFERENCES
[1] A. K. Banik and T. K. Datta, “Stochastic Response and
Stability of Single Leg Articulated Tower,” Proceeding of
International Conference on Offshore Mechanics and
Arctic Engineering (OMAE), Cancun, 8-13 June 2003, pp.
431-438.
[2] A. K. Banik and T. K. Datta, “Stability Analysis of an
Articulated Loading Platform in Regular Sea,” Journal of
Computational Nonlinear Dynamics, ASME, Vol. 3, No.
1, 2009, 9 p.
[3] A. K. Banik, “Dynamic Stability Analysis of Compliant
Offshore Structures,” IIT, Delhi, 2004.
[4] H. Lina, T. Youngang and Y. I. Cong, “Seismic Response
Analysis of Articulated Tower Platform in the Still Wa-
ter,” China Offshore Platform, Period 03, 2006.
[5] Chandrasekaran and S. Gaurav, “Offshore Triangular TLP
Earthquake Motion Analysis under Distinctly High Sea
Waves,” International Journal of Ships and Offshore
Structures, Vol. 3, No. 3, 2008, pp. 173-184.
http://dx.doi.org/10.1080/17445300802051681
[6] S. D. Hasan, N. Islam and K. Moin, “Multi-Hinged Ar-
ticulated Offshore Tower under Vertical Ground Excita-
tion,” ASCE Journal of Structural Engineering, Vol. 137,
No. 4, 2011, pp. 469-480.
http://dx.doi.org/10.1061/(ASCE)ST.1943-541X.0000284
[7] P. Friedmann, C. E. Hammond and T.-H. Woo, “Efficient
Numerical Treatment of Periodic Systems with Applica-
tion to Stability Problems,” International Journal for Nu-
merical Methods in Engineering, Vol. 11, No. 7, 1977, pp.
1117-1136. http://dx.doi.org/10.1002/nme.1620110708
[8] L. O. Chua and A. Ushida, “Algorithms for Comuting Al-
most Periodic Steady-State Response of Nonlinear Sys-
tems to Multiple Input Frequencies,” IEEE Transactions
on Circuits and Systems, Vol. 28, No. 10, 1981, pp. 953-
971. http://dx.doi.org/10.1109/TCS.1981.1084921
[9] T. D. Burton, “Nonlinear Oscillator Limit Cycle Analysis
Using a Finite Transformation Approach,” International
Journal of Nonlinear Mechanics, Vol. 17, No. 1, 1982, pp.
7-19.
http://dx.doi.org/10.1016/0020-7462(82)90033-6
[10] G. Q. Cai, “Random Vibration of Nonlinear Systems
under Non-White Excitations,” Journal of Engineering
Mechanics, ASCE, Vol. 121, No. 5, 1995, pp. 633-639.
http://dx.doi.org/10.1061/(ASCE)0733-9399(1995)121:5(
633)
[11] Y. K. Lin and G. Q. Cai, “Probabilistic Structural Dy-
namics,” Advanced Theory and Mechanics, McGraw-Hill,
New York, 1995.
[12] M. N. Hamdan and T. D. Burton, “On the Steady State
Response and Stability of Non-Linear Oscillators Using
Harmonic Balance,” Journal of Sound and Vibration, Vol.
166, No. 2, 1993, pp. 255-266.
http://dx.doi.org/10.1006/jsvi.1993.1295
[13] B. Rabindra and A. K. Mallik, “Stability Analysis of
Non-Linearly Damped Duffing Oscillator,” Journal of
Sound and Vibration, Vol. 171, No. 5, 1994, pp. 708-716.
http://dx.doi.org/10.1006/jsvi.1994.1153
[14] K. B. Blair, C. M. Krousgrill and T. N. Farris, “Harmonic
Balance and Continuation Techniques in the Dynamic
Analysis of the Duffing’s Equation,” Journal of Sound
and Vibration, Vol. 202, No. 5, 1997, pp. 717-731.
http://dx.doi.org/10.1006/jsvi.1996.0863
[15] P. Yu and Q. Bi, “Analysis of Nonlinear Dynamics and
Bifurcations of a Double Pendulum,” Journal of Sound
and Vibration, Vol. 217, No. 4, 1998, pp. 691-736.
http://dx.doi.org/10.1006/jsvi.1998.1781
[16] A. B. M. Islam Saiful, “Nonlinear Dynamic Behaviour of
Fully Coupled SPAR Platform,” PhD. Thesis, University
of Malaya, Kuala Lumpur, 2013.
[17] S. K. Chakrabarti, “Stability Analysis of Interaction of an
Articulated Tower with Waves,” Proceedings of Fluid
Interaction, Heikidik i, Greece, Vol. 1, 2001, pp. 281-292.
[18] S. Chakrabarti and D. Cotter, “Motion Analysis of Ar-
ticulated Tower,” Journal of Waterway, Port, Coastal
and Ocean Division, ASCE, Vol. 105, 1979, pp. 281-292.
[19] M. Jameel and S. Ahmad, “Fatigue Reliabilitry Asses-
ment of Coupled Spar-Mooring System,” Paper Pre-
sented at the ASME 30th International Conference on
Ocean, Offshore and Arctic Engineering (OMAE 2011-
49687), Rotterdam, 2011.
[20] A. K. Mallik and J. K. Bhattacharjee, “Stability Problems
in Applied Mechanics,” Narosa Publishing House, 2005.