 American Journal of Industrial and Business Management, 2013, 3, 687-699 Published Online December 2013 (http://www.scirp.org/journal/ajibm) http://dx.doi.org/10.4236/ajibm.2013.38078 Open Access AJIBM 687 Using Relative Utility Pricing to Explain Multibuy Prices in Supermarkets and on the Internet Philip Thomas1, Alec Chrystal2 1School of Engineering and Mathematical Sciences, City University London, London, UK; 2Cass Business School, City University London, London, UK. Email: pjt3.michaelmas@gmail.com Received October 20th, 2013; revised November 20th, 2013; accepted November 27th, 2013 Copyright © 2013 Philip Thomas, Alec Chrystal. This is an open access article distributed under the Creative Commons Attribution License, which permits unrestricted use, distribution, and reproduction in any medium, provided the original work is properly cited. In accordance of the Creative Commons Attribution License all Copyrights © 2013 are reserved for SCIRP and the owner of the intellectual property Philip Thomas, Alec Chrystal. All Copyright © 2013 are guarded by law and by SCIRP as a guardian. ABSTRACT The Relative Utility Pricing (RUP) model is used to explain the prices for commodities being sold in supermarkets and on the internet. Grocery prices offered by the supermarkets, Tesco, Sainsbury and Waitrose in December 2009 and Au- gust 2013, are considered, as well as the prices of electronic items offered by Amazon on the internet at the same dates. The obser v ed pr ice for a pack can be give n an ex planation in te rms of its size relative to the smallest pack considered by the customer (the baseline pack), the price and variable cost associated with the baseline pack and the demand density. The optimal price may be predicted using a profit maximising calculation if these data are available. Even if the ven- dor’s knowledge of the demand density is poor or non-existent, it is still possible for a vendor knowing his unit variable cost to calculate a useful approximation to the profit-maximising price by using a uniform or Rectangular demand den- sity to represent customer demand. Alternatively, if there are no independent data on the demand density but the prices of the packs are available, it is possible to determine the approximate shape of the demand density leading to those prices. This demand density will then indicate whether the demand is soft or hard, with the Rectangular distribution indicating a neutral market. We consider the vendor to be a large retailer, such as a supermarket, who can obtain the product that he wishes to sell from a variety of suppliers at constant per-unit variable cost and hence marginal cost. Any sales at a price above marginal cost will contribute to profit. The RUP model provides an approximate match to the prices observed for supermarket milk and eggs by adjusting the demand density. A softening of the market for farm retail commodities is revealed between December 2009 and August 2013, fully consistent with the co incident long pe- riod of low growth and falling real wages in the UK economy. It is sh own how the vendor may use product differentia- tion to buck this trend. The RUP model explains also the current prices of USB memory sticks, how those prices have evolved and how they are likely to evolve over time. Keywords: Relative Utility Pricing; RUP; Packs of Different Sizes; Pricing Strategies; Product Differentiation; Utility Theory 1. Introduction The Relative Utility Pricing (RUP) model, devised to explain quantity promotions such as Buy One Get One Free [1], will be used to predict the prices for commodi- ties being sold in supermarkets and on the internet. The paper will consider milk and egg prices offered by the UK supermarkets, Tesco, Sainsbury and Waitrose in De- cember 2009 and August 2013. The prices of electronic components will also be analyzed, specifically universal serial bus (USB) memory sticks of different capacity. The method used to examine these prices will differ from that presented in Section 8 of [1], which was con- cerned with the “design” problem of choosing the size and price of pack 2 from the three options: 1) “buy one get one free”; 2) “2 for the price of 1” or 3) Golden Ratio. Customers’ behaviour was then modelled using the Sin- gle Comparison Relative Utility Pricing (SCRUP) model. The task addressed in this paper is the “operational” problem of deciding on the best prices for a set of packs once their size has been fixed. This brings in the need to respond with price changes to alterations in consumer  Using Relative Utility Pricing to Explain Multibuy Prices in Supermarkets and on the Internet 688 attitudes over time. The structure of the RUP model allows a determina- tion to be made of both the minimum price and the maximum price, maxn, that potential purchasers may assign to a pack of a given size, pack n. It is shown in [1], Appendix B, that the MAP for every individual in the cohort of consumers targeted by the retailer will fall within the range to p 1n p 1 Lnp, where n is the price of pack n and is the “largeness” of pack n, the ratio of its size to the size of the entry-lev el p ack 1, so that . p Ln 11L Once the range of possible prices has been identified, as well as a mechanism for different individuals assign- ing different values within that range to their maximum acceptable price (MAP), as identified in Section 6 of [1], the final unknown is the probability d istribution for MAP, the “demand density” (see [2] and [3] for a discussion of this concept). If the demand density for each pack size, , can be found independently, perhaps by a cus- tomer survey, then the RUP model will be able to give good price predictions for all the pack sizes larger than the entry-level pack, pack 1, g i ven the pri ce of pac k 1. 1n In the absence of independent data on demand density, it is nevertheless possible to calculate, at least approxi- mately, the form of the demand den sity that is needed for the observed prices to generate the optimal profit for the vendor. The shape of the demand density curve then pro- vides an easily understood explanation for the observed prices—for example, is the market hard or soft? This gives the RUP model the power to explain pack prices, which is the principal aim of this paper. The restriction on a probability distribution, namely that the area under the curve must be unity, proves help- ful in restricting the number of possible demand scenar- ios needing exploration before a reasonable set of results can be obtained. It is thus possible to vary the parameters of the generalised Double Power demand density, the properties of which are derived in [3], to find the profit- maximising prices that give the best match to the ob- served prices. 2. The Probability Distribution for MAP for Pack n As just noted, the upper and lower limits are defined for the probability distribution for MAP for pack n, but the form of the demand density within those limits remains open, subject to the general but important condition that its integral will be unity. This problem is addressed in this paper throu gh the u se of two prob ability distribution s with claims to generality. The first is the Uniform or Rectangular distribution, often used in statistics wh en it is known that some random distribution will be valid but lack of data makes it impossible to specify the actual form. The second is the generalised, Double Power den- sity, discussed at length in [3], where the mode can be placed anywhere within the range by the appropriate variation of parameters. In fact, the Double Power density can be ar- ranged to give a good approximation to the Rectangular distribution by choosing its parameters appropriately. One might reasonably expect that the fraction of the potential consumers of pack n prepared to pay a price of 1 Lnp or close to it will become rather small as n and hence Ln increase. Moreover, the market for large packs may lose its strong link to the market for small packs. Hence when n is large, it may be sensible to as- sume that the prospective purchaser of pack n will make comparisons only with packs that are reasonably close to pack n in size. This will involve rebasing, so that the smallest non-empty pack with which the customer makes a comparison is pack r. 1r implies that pack n is be- ing compared with each and every non-empty pack be- low it, while implies that the prospective pur- chaser is now ignoring the existence of all packs between pack 0, the empty pack corresponding to no purchase, and pack r, the first non-empty pack that he might be interested in purchasing. Hence packs 1, 1r 2,,1r are disregarded. 3. Setting the Price of Pack n so as to Maximise Profit By contrast with Section 9 of [1], which was concerned with selecting both the size and the price of pack 2 given the size and price of pack 1, now the sizes of the various packs, , are fixed, and the problem is to select optimal prices for the larger packs, given the price of pack 1. The vendor will be faced with customers with expectations conforming to the RUP model, and will need to adjust his prices to take account of those expecta- tions. 2,3, ,n It is assumed that the total variable cost of the good will be proportional to the amount of the good sold, irre- spective of the size of the pack or packs in which the sale is made. Let 1v be the variable cost per pack for pack 1, assumed constant. Hence selling a single pack 1 will in- cur a total variable cost, 1v, selling two packs 1 will incur a total variable cost of 1 and so on. Moreover, if pack 2 h as a largeness of 2, viz. , then it will incur a total variable cost of 1v, while if it has a large- ness of 3, viz. c c 2 2v c c 22L 23L , then pack 2 will incur a total variable cost of 1, and so on. Hence, in general, the variable cost per pack, , for pack n will be 3v c vn c 1vn v cLnc (1) With the contents of pack 1 seen as the fundamental unit of measurement, viz. , the variable cost per pack, , for pack 1 may be seen as the variable cost 1L1 1v c Open Access AJIBM  Using Relative Utility Pricing to Explain Multibuy Prices in Supermarkets and on the Internet 689 incurred in selling each one of these fundamental units. The achieved price, 1, of pack 1 is ex ogenous to the RUP model, and this makes it convenient to express in terms of : p 1v c 1 p 11vvf ccp1 (2) Here 1vf is the fraction of the achieved price, 1, of pack 1 absorbed by variable costs. Substituting from Equation (2) into Equation (1) gives the variable cost per pack for pack n, expressed in terms of pack 1 price, : cp 1 p 11vn vf cLncp (3) Let the probability density for the MAP, n, for pack n be p n p p . Using the concept of the “uniconsumer” introduced without loss of generality in [2] to character- ise a person prepared to buy one but only one item if the price is right, the fraction of the uniconsumers prepared to pay n or more for a single pack n will be n Sp , given most generally by 0 d1 d n n p np Spgv vgv v (4) Since the target group consists of consumers prepared to pay between 1n and ma for pack n, pxn p 0 n gp for 1nn (as well as for ). Hence Equa- tion (4) may be rewritten: pp maxnn pp 1 1 n n p np Spgv v d (5) We may define an “offset MAP”, , for pack n by: n q 1nnn qpp (6) which will conform to a probability distribution, n hq , over the interval max , where, since from Appendix B of [1], the maximum value of the offset MAP, , for pack n, is given by 0nn qq n q max 1n pLnp n max1 1n qLnpp (7) We may also note that differentiating Equation (6) gives d1 dn n q p (8) The probability dens ity for MAP, n p, and that for offset MAP, , which may be termed “demand densities”, are then linked by: n hq d dn nn n q n phqhq p (9) in which Equation (8) is used. Substituting from Equa- tion (9) into Equation (5) gives: 0 1d n q nn Sphv vSq (10) Let there be N uniconsumers in the target group. The vendor’s total pro fit, , from selling packs n will be his total income from packs n less both the total variable costs and the fixed costs, n C, associated with packs n: nnnvn F NS ppNS pcC n (11) This may be converted using Equations (3), (6) and (10) into the form: 111nn nnvfF NSqqpNSqcLnpC n (12) The retailer will seek to maximise this profit, which, for a constant size of target population, N, is equivalent to choosing the offset MAP, , so as to maximise the av- erage profit per consumer, n q : 111 0 1d n q n nvf n N C qcLnpp hvvN (13) in which Equation (10) has been used in the second step. The term, Fn CN, being a constant, is unaffected by changes in n, and so, given a demand density, q n hq , it is possible by direct computation to find the value of that will maximise n q , where 111 0 1 n q nvf n qcLnpp hvv d (14) which will also maximise . Alternatively, the maximising value of MAP may be found by differentiating Equation (13) with respect to the offset MAP, , and then setting to zero the resultant expression, n q dd 0qn . This gives the optimal price for pack n as 1nnn pqp , where is the solution of n q 111 0 1d n q nvfn n hvvqc Lnpphq 0 (15) 4. Explaining the Price of Pack n Data are available in the supermarket or on the internet for the achieved prices, 12 , of packs of vari- ous sizes, and we selected for examination the pricing of fresh milk and eggs in supermarkets and USB memory sticks on the internet, specifically those offered for sale on Amazon.co.uk. ,,, n pp p The supermarkets considered were Tesco, Sainsbury and Waitrose. Tesco is the UK’s leading supermarket, with a market share of about 30%. Sainsbury has about 16% of the market, while Waitrose, a part of the pri- Open Access AJIBM  Using Relative Utility Pricing to Explain Multibuy Prices in Supermarkets and on the Internet 690 vately owned John Lewis Partnership, has about 4% of the market. John Lewis, together with its subsidiary, Waitrose, is widely regarded as an up-market retailer. Data were available on the variable cost per pack for pack 1, 1v, in the case of both milk and egg s, but not on the demand density. No information was available on the variable cost of a USB memory stick, nor on its demand density. c The Rectangular demand density, if it were to be valid, confers the advantage that it is defined by the RUP model as soon as data are available on the pack largenesses and the prices of packs below pack n, 12 1 ,,, n pp p : 11 11 1 if 0 otherwise nn n n ppLn Lnp p gp p (16) Thus, if the variable cost per pack for pack 1, 1v, is known (it can be presumed that the vendor will know this figure), then it is possible to use the Uniform or Rectan- gular demand density to calculate successively the opti- mal prices for packs . This distribution de- pends only on the prices of lower packs and on the largeness of pack n. It can be applied successively as soon as the price, 1, of the entry-level pack is known. Hence it is useful in its own right for a vendor laun ching a new product to be packaged in a variety of pack sizes at a time when experience of the market is necessarily lacking and when whatever market research is available may be insufficient to establish reliable estimates of the actual demand densities. More generally, it may provide useful central estimates for quoted prices when it is not known whether the market is soft, when the demand den- sity is biased towards lower prices, or hard, when the demand density is skewed towards higher prices. c 2,3, ,n p However, the Rectangular demand density is just one of the possible densities that might be valid. In this study, therefore, the versatile Double Power demand density was used to examine a large range of possible offset de- mand densities. The Double Power demand density, , characterising the offset MAP, , for pack n is given by [3]: n hq n q max max for 0 0 for cd nnn nn nn hqaqbqqq qq (17) where a, b, c and d are non-negative constants. The mode will be strictly interior if all of a, b, c and d are non-zero; it will occur at the lower boundary, , when 0 n q0c , while it will be located at the upper boundary, maxnn , when . The constants, a and b may be defined in terms of c and d as detailed in [3]. qq0b For any product sold in packs of different sizes, it has been assumed that the parameters, c and d, defining the demand densities will be the same for all of the packs greater than the effective baseline (pack r + 1 and upwards). The optimising results from [3] may be used after put- ting n pq (18) and 11vvf n ccLnpp 1 (19) which have the effect of converting Equation (13) into Equation (3) of [2]. Thus, for example, if the mode is strictly interior to the interval, , then the opti- mal value, will be the solution of: max 0, n q * n q 11 ** max max ** 111 maxmax max 12 12 11 0 dc nn nn cd vf nnn nn qq cd dc qq cLnp pqq cd qq dc n q (20) (cf. Equation (67) of [3]). 5. Using the RUP Model to Examine the Price of Milk in the Tesco Supermarket Milk is retailed in the UK in 3 main categories: whole milk, which has a butter-fat content of about 4% [4], semi-skimmed milk (1.7% butter-fat) and skimmed milk, with a fat content of about 0.1% [5]. Just about half of the milk retailed in the UK is whole milk [6], with the re- maining sales coming from reduced-fat milk. Price data were taken from the My Supermarket website in De- cember 2009 [7] and August 2013 [8]. It is usual for supermarkets to offer milk in four dif- ferent sizes or “packs” in the terminology of this paper: 1 pint (= 0.57 litre), 2 pints, 4 pints and 6 pints. Tesco prices packs of the same size the same for each category of milk: whole, semi-skimmed and skimmed. Estimates of the variable cost per pint may be made from the information on farm gate prices released by Tesco and covered in the farming press. These may be checked using average farm gate prices [4] provided by the UK Department of Environment, Farming and Rural Affairs (DEFRA). The price paid to farmers supplying Tesco was £0.1565 per pint in December 2009 [9] and £0.1861 per pint in August 2013 [10]. Although super- markets may offer special promotions on milk, they claim that this does not affect the price paid to farmers, which are for long-term contracts [6]. To this must be added the milk processing cost (col- lection, pasteurization and packaging) estimated at £0.0675 per pint for semi-skimmed milk [6]. In the ab- sence of information on how the milk processors incur- porate into their business model the benefit of selling the Open Access AJIBM 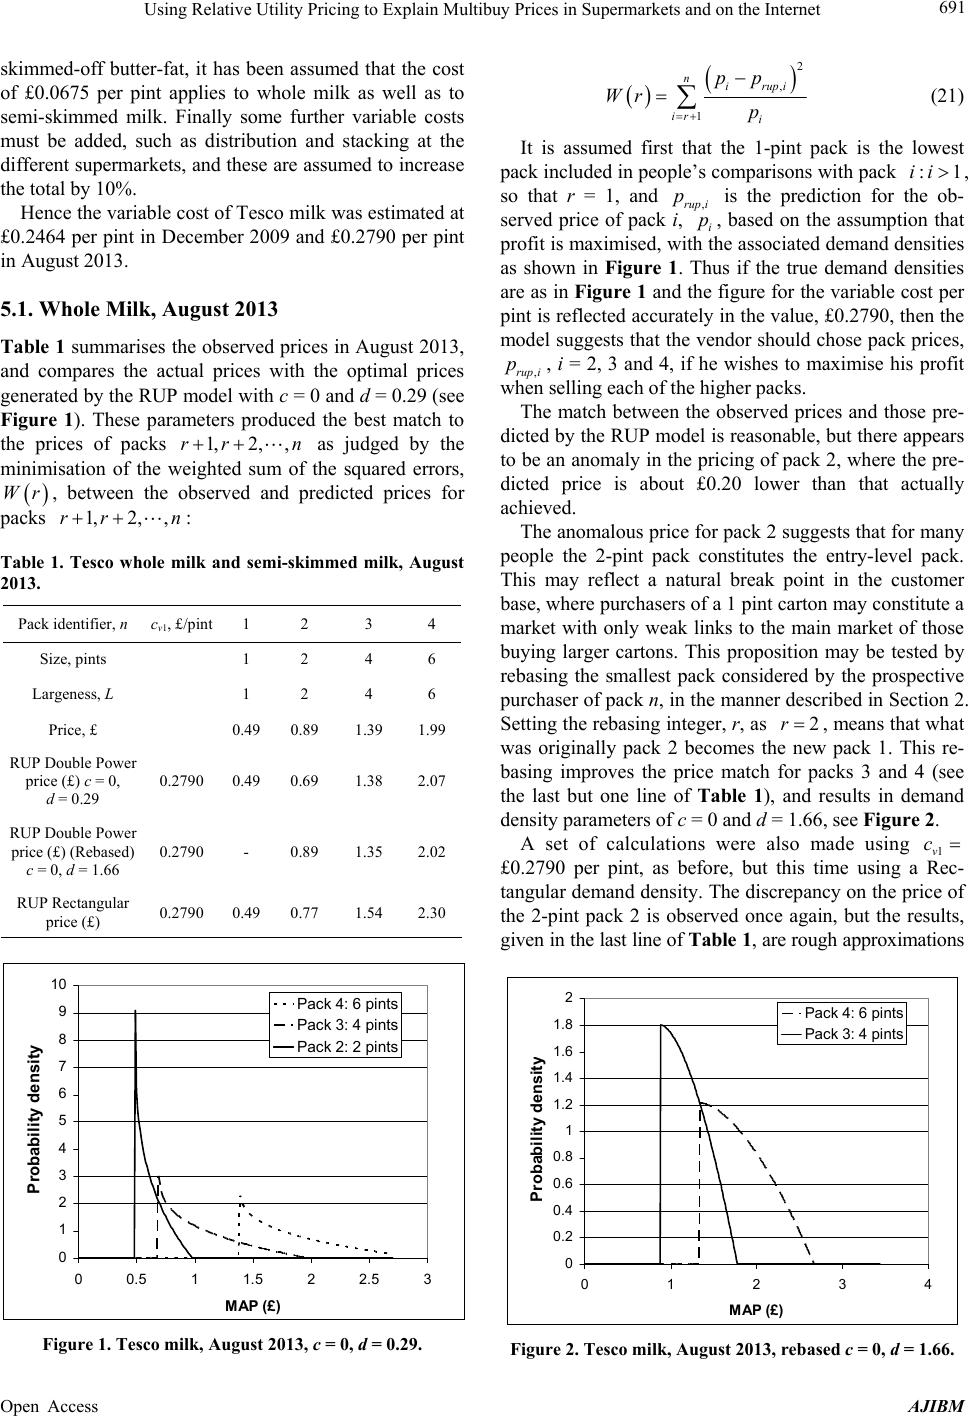 Using Relative Utility Pricing to Explain Multibuy Prices in Supermarkets and on the Internet 691 skimmed-off butter-fat, it has been assumed that the cost of £0.0675 per pint applies to whole milk as well as to semi-skimmed milk. Finally some further variable costs must be added, such as distribution and stacking at the different supermarkets, and these are assumed to increase the total by 10%. Hence the variable cost of Tesco milk was estimated at £0.2464 per pint in December 2009 and £0.2790 per pint in Augus t 2013. 5.1. Whole Milk, August 2013 Table 1 summarises the observed prices in August 2013, and compares the actual prices with the optimal prices generated by the RUP model with c = 0 and d = 0.29 (see Figure 1). These parameters produced the best match to the prices of packs as judged by the minimisation of the weighted sum of the squared errors, , between the observed and predicted prices for packs : 1,2,,rr n n Wr 1,2,,rr Table 1. Tesco whole milk and semi-skimmed milk, August 2013. Pack identifier, n cv1, £/pin t 1 2 3 4 Size, pints 1 2 4 6 Largeness, L 1 2 4 6 Price, £ 0.49 0.89 1.3 9 1.99 RUP Double Power price (£) c = 0, d = 0.29 0.2790 0.49 0.69 1.38 2.07 RUP Double Power price (£) (Rebased) c = 0, d = 1.66 0.2790 - 0.89 1.35 2.02 RUP Rectangular price (£) 0.2790 0.49 0.77 1.54 2.30 0 1 2 3 4 5 6 7 8 9 10 00.5 11.522.5 3 MAP (£) Probability densit Pack 4: 6 pints Pack 3: 4 pints Pack 2: 2 pints Figure 1. Tesco milk, August 2013, c = 0, d = 0.29. 2 , 1 nirupi ir i pp Wr p (21) It is assumed first that the 1-pint pack is the lowest pack included in people’s comparisons with pack , so that r = 1, and is the prediction for the ob- served price of pack i, i, based on the assumption that profit is maximised, with the associated demand densities as shown in Figure 1. Thus if the true demand densities are as in Figure 1 and the figure for the variable cost per pint is reflected accurately in the value, £0.2790, then the model suggests that the vendor should chose pack prices, ,rup i, i = 2, 3 and 4, if he wishes to maximise his profit when selling each of the higher packs. :1ii ,rup i pp p The match between the observed prices and those pre- dicted by the RUP model is reason able, but there ap pears to be an anomaly in the pricing of pack 2, where the pre- dicted price is about £0.20 lower than that actually achieved. The anomalous price for pack 2 suggests that for many people the 2-pint pack constitutes the entry-level pack. This may reflect a natural break point in the customer base, where purchasers of a 1 pint carton may constitute a market with only weak links to the main market of those buying larger cartons. This proposition may be tested by rebasing the smallest pack considered by the prospective purchaser of pack n, in the manner described in Section 2. Setting the rebasing integer, r, as 2 , means that what was originally pack 2 becomes the new pack 1. This re- basing improves the price match for packs 3 and 4 (see the last but one line of Table 1), and results in demand density parameters of c = 0 and d = 1.66, see Figure 2. A set of calculations were also made using 1v c £0.2790 per pint, as before, but this time using a Rec- tangular demand density. The discrepancy on the price of the 2-pint pack 2 is observed once again, but the results, given in the last line of Table 1, are rough approximations 0 0.2 0.4 0.6 0.8 1 1.2 1.4 1.6 1.8 2 0123 MAP (£) Probability densit 4 Pack 4: 6 pints Pack 3: 4 pints Figure 2. Tesco milk, August 2013, rebased c = 0, d = 1.66. Open Access AJIBM 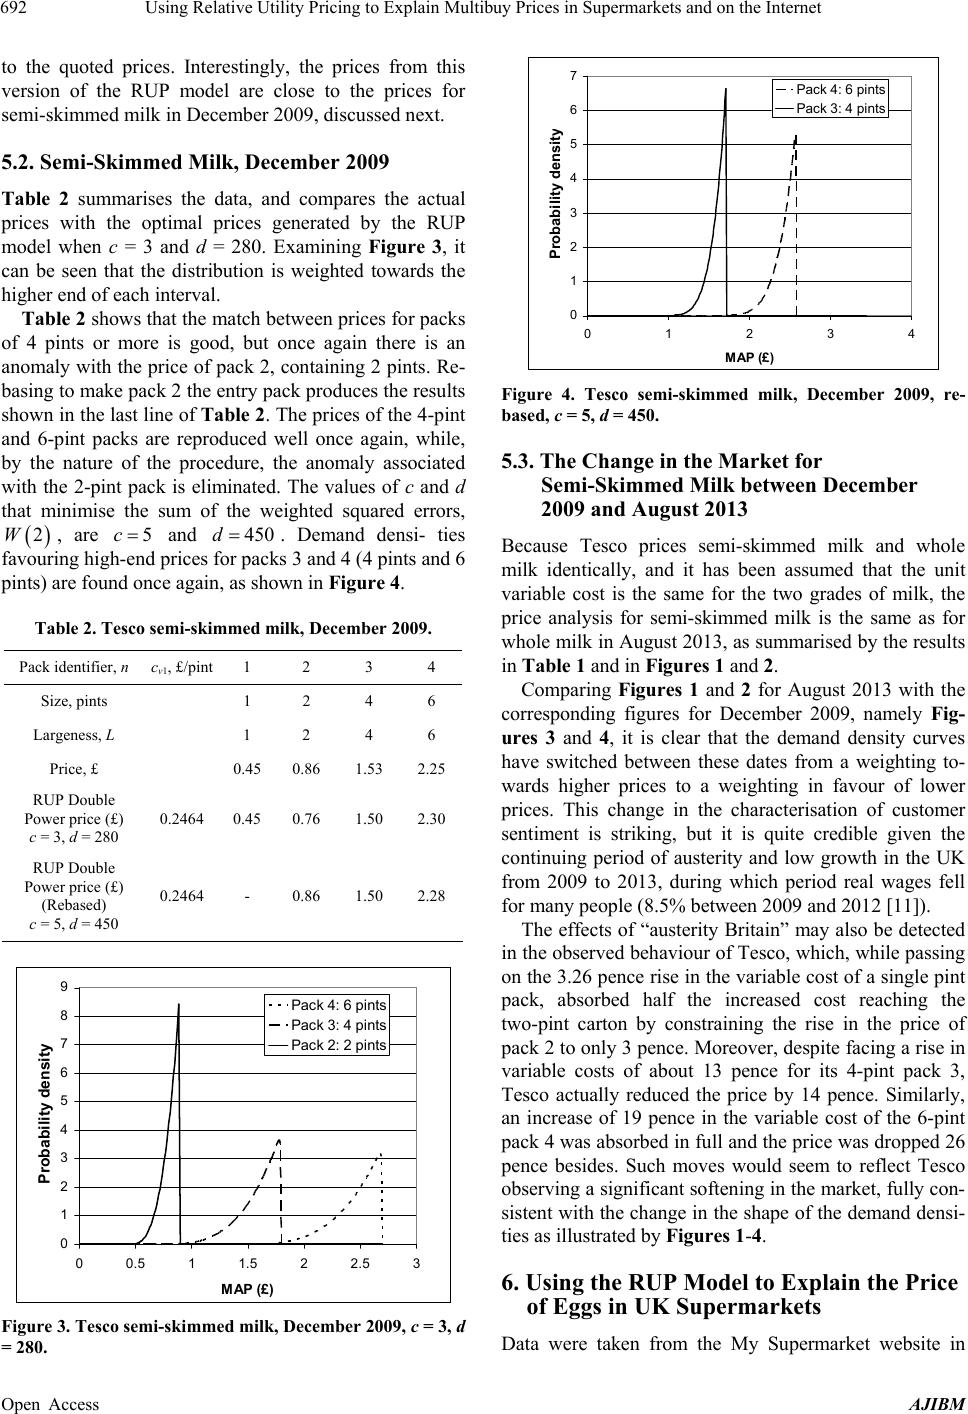 Using Relative Utility Pricing to Explain Multibuy Prices in Supermarkets and on the Internet 692 to the quoted prices. Interestingly, the prices from this version of the RUP model are close to the prices for semi-skimmed milk in December 2009, discussed next. 5.2. Semi-Skimmed Milk, December 2009 Table 2 summarises the data, and compares the actual prices with the optimal prices generated by the RUP model when c = 3 and d = 280. Examining Figure 3, it can be seen that the distribution is weighted towards the higher end of each interval. Table 2 shows that the match between prices for packs of 4 pints or more is good, but once again there is an anomaly with the price of pack 2, containing 2 pints. Re- basing to make pack 2 the entry p ack produces th e resu lts shown in the last line of Table 2. Th e prices of the 4-p int and 6-pint packs are reproduced well once again, while, by the nature of the procedure, the anomaly associated with the 2-pint pack is eliminated. The values of c and d that minimise the sum of the weighted squared errors, , are and . Demand densi- ties favouring high-end prices for pack s 3 and 4 (4 pints and 6 pints) are found once again, as shown in Figure 4. 2W5c450d Table 2. Tesco semi-skimmed milk, December 2009. Pack identifier, n cv1, £/pin t 1 2 3 4 Size, pints 1 2 4 6 Largeness, L 1 2 4 6 Price, £ 0.45 0.86 1.53 2.25 RUP Double Power price (£) c = 3, d = 280 0.2464 0.45 0.76 1.50 2.30 RUP Double Power price (£) (Rebased) c = 5, d = 450 0.2464 - 0.86 1.50 2.28 0 1 2 3 4 5 6 7 8 9 00.511.522.53 MAP (£) Probability densit Pack 4: 6 pints Pack 3: 4 pints Pack 2: 2 pints Figure 3. Tesco semi-skimmed milk, December 2009, c = 3, d = 280. 0 1 2 3 4 5 6 7 01234 MAP (£) Probability densit Pack 4: 6 pints Pack 3: 4 pints Figure 4. Tesco semi-skimmed milk, December 2009, re- based, c = 5, d = 450. 5.3. The Change in the Market for Semi-Skimmed Milk between December 2009 and August 2013 Because Tesco prices semi-skimmed milk and whole milk identically, and it has been assumed that the unit variable cost is the same for the two grades of milk, the price analysis for semi-skimmed milk is the same as for whole milk in August 2013, as summarised by the results in Table 1 and in Figures 1 and 2. Comparing Figures 1 and 2 for August 2013 with the corresponding figures for December 2009, namely Fig- ures 3 and 4, it is clear that the demand density curves have switched between these dates from a weighting to- wards higher prices to a weighting in favour of lower prices. This change in the characterisation of customer sentiment is striking, but it is quite credible given the continuing period of austerity and low growth in the UK from 2009 to 2013, during which period real wages fell for many peop le (8.5% between 2009 and 2012 [11]). The effects of “austerity Britain” may also be detected in the observed behaviou r of Tesco, which, while passing on the 3.26 pence rise in the variable cost of a single pint pack, absorbed half the increased cost reaching the two-pint carton by constraining the rise in the price of pack 2 to only 3 pence. Moreover, despite facing a rise in variable costs of about 13 pence for its 4-pint pack 3, Tesco actually reduced the price by 14 pence. Similarly, an increase of 19 pence in the variable cost of the 6-pint pack 4 was absorbed in full and the price was dropped 26 pence besides. Such moves would seem to reflect Tesco observing a significant softening in the market, fully con- sistent with the change in the shape of the demand densi- ties as illustrated by Figures 1-4. 6. Using the RUP Model to Explain the Price of Eggs in UK Supermarkets Data were taken from the My Supermarket website in Open Access AJIBM  Using Relative Utility Pricing to Explain Multibuy Prices in Supermarkets and on the Internet 693 December 2009 [7] and in August 2013 [8] for “value” eggs at Tesco, barn and free-range eggs at Sainsbury’s and organic free range eggs at Waitrose. Estimates of the variable costs per dozen eggs were made from the average price per dozen paid to egg pro- ducers, as provided by DEFRA [12] on a quarterly basis. Data are supplied for eggs categorized as intensive, barn, free range and organic, with an overall average also given. The data were incomplete for barn and organic eggs from the first quarter of 2012 onwards, and so extrapolations were made using the price of free range eggs as a guide: free range eggs were intermediate in price between barn eggs and organic eggs for the years for which data were essentially complete, from 2007 to 2011 inclusive. In addition, data for the 3rd quarter of 2013 were not avail- able at the time of the calculations, and so 2nd quarter data were used instead. It is important to make clear that the benefits of bulk sales are not linked to any production or distribution economies of scale (or scope). Indeed, we consider the vendor to be a retailer who is faced with something close to a constant marginal cost of the product (and thus also a constant per-unit variable cost and a constant average variable cost). The retailer is not greatly affected by any possible economies or diseconomies in production costs as he can gain access to supplies from many different producers each of whom is operating close to his opti- mum scale but all of whom can supply the product at the competitive (or contracted) wholesale price. The retailer will thus increase profit by increasing sales whenever he can do so at a price that is above his marginal costs. The variable costs associated with egg packaging were judged to be less than those associated with milk process- sors, so that the additional variable costs were repre- sented simply by adding 25% to the price paid to the producer, roughly half the mark-up on milk. The esti- mated variable costs per half dozen for the various egg types are shown in Table 3. Table 3. Estimated variable cost per half dozen eggs (all prices in £). Date Intensive Barn Free RangeOrganic Paid to producer per dozen 0.5630.74 0.901 1.373 December 2009 Estimated variable cost per ½ dozen 0.35190.4625 0.563 0.858 Paid to producer per dozen 0.7540.904 1.055 1.737 August 2013 Estimated variable cost per ½ dozen 0.47130.5652 0.6594 1.086 6.1. Tesco Value Mixed Eggs The Double Power demand density matches exactly the observed price for pack 2 (15 eggs) of Tesco’s Value Mixed Eggs in December 2009 given in Tabl e 4 when c = 0 and d = 7.8. See Figure 5. However, the Double Power demand density is unable to match the observed price for pack 2 in August 2013. It gets closest when c = 0 and d = 0.01, see Figure 6, when the profit-maximizing price for pack 2 is £1.48 rather than £1.35. This may be a result of the inexact nature of the data. It is necessary to reduce the variable cost per half dozen given in Table 3 by about 7 pence to £0.4019 to enable the model to re- produce the observed price of £1.35 for pack 2 with c = 0 and d = 0.01. The general trend of market tightening observed in the milk market would seem to be mirrored in the case of these commodity eggs. Comparing Figures 5 and 6, it is clear that people in the target market are taking a much less relaxed view of price, with significant clustering at the lower end of the price range. Table 4. “Value” eggs at Tesco and “Basics” eggs at Sains- bury (December 2009 and August 2013). Supermarket Tesco Sainsbury Product name Tesco Value Mixed Eggs Sainsbury’s Basics Barn Eggs Pack identifier, n1 2 1 2 Number in pack6 15 6 18 Largeness, L 1 2.5 1 3 Price, £, Dec. 2009 0.91 1.50 0.91 1.85 Price, £, Aug. 2013 0.87 1.35 1.00 2.10 0 0.1 0.2 0.3 0.4 0.5 0.6 0.7 0.8 0.9 00.511.522.53 MAP Pro bability dens ity Figure 5. Tesco value mixed eggs, December 2009, c = 0, d = 7.8. Open Access AJIBM  Using Relative Utility Pricing to Explain Multibuy Prices in Supermarkets and on the Internet 694 0 5 10 15 20 25 00.511.522.53 MAP Probability density Figure 6. Tesco value mixed eggs, August 2013, c = 0, d = 0.01. 6.2. Sainsbury Basics Barn Eggs The Double Power demand density matches exactly the observed prices given in Table 4 for Sainsbury’s Basics Barn Eggs, both in December 2009 when c = 0 and d = 1.49 and in August 2013 when c = 0 and d = 0.01. See Figures 7 and 8. It is clear from comparing these figures that the market has tightened for Sainsbury’s Basics eggs in the same way as for Tesco’s Value eggs, again with a preponderance of people limiting their MAP to a low level. A further interpretation of the degree of market sof- tening may be found by using the demand density char- acteristic of December 2009 (c = 0 and d = 1.49) to pre- dict the price of pack 2 of Sainsbury’s Basics Barn Eggs in August 2013. Given the pack 1 price of £1.00, the pre- dicted price of pack 2 is £2.14. Thus this manifestation of the softening of the market has cost Sainsbury 4p in profit on its 18-egg pack of Basics Barn Eggs. 6.3. Sainsbury’s Woodland Free Ran g e Large Eggs These eggs constitute Sainsbury’s top of the range offer- ing. The Double Power demand density matches the ob- served prices given in Table 5 for Sainsbury’s Large Woodland Free Range Eggs in December 2009 when c = 34.6 and d = 100. Meanwhile, the observed prices listed in Table 6 for Sainsbury’s Woodland Free Range Large Eggs (there seems to have been a minor rewording of the name in the years between 2009 and 2013) in August 2013 are matched when c = 6 and d = 65. See Figures 9 and 10. Demand density remained biased towards the upper end of the price interval in both December 2009 and Au- gust 2013. However there appears some degree of market softening, with a greater proportion of the target market having a MAP in the lower range of the interval more recently. It would appear that the potential purchasers of Sainsbury’s Woodland Free Range Large Eggs were highly price-insensitive in December 2009 but have be- come less so after the years of “austerity” following 2009 (by mid 2013, UK GDP was still down by 3.3% on what it had been 5 years earlier). Even in 2013 , however, customers 0 0.1 0.2 0.3 0.4 0.5 0.6 0.7 0.8 0.9 1 0 0.5 1 1.5 2 2.5 3 MAP Probability density Figure 7. Sainsbury’s basics barn eggs, December 2009, c = 0, d = 1.49. 0 2 4 6 8 10 12 14 16 00.511.522.53 MAP Probability den s ity Figure 8. Sainsbury’s basics barn eggs, August 2013, c = 0, d = 0.01. Table 5. Top of the price-range eggs: Sainsbury and Wait- rose, December 2009. Supermarket Sainsbury Waitrose Product name Sainsbury’s Large Woodland Free Range Eggs Waitrose Organic Large Free Range Columbian Blacktail Hen Eggs Pack identifier, n1 2 1 2 Number in pack6 12 6 12 Largeness, L 1 2 1 2 Price, £ 1.58 2.98 2.28 4.30 Open Access AJIBM 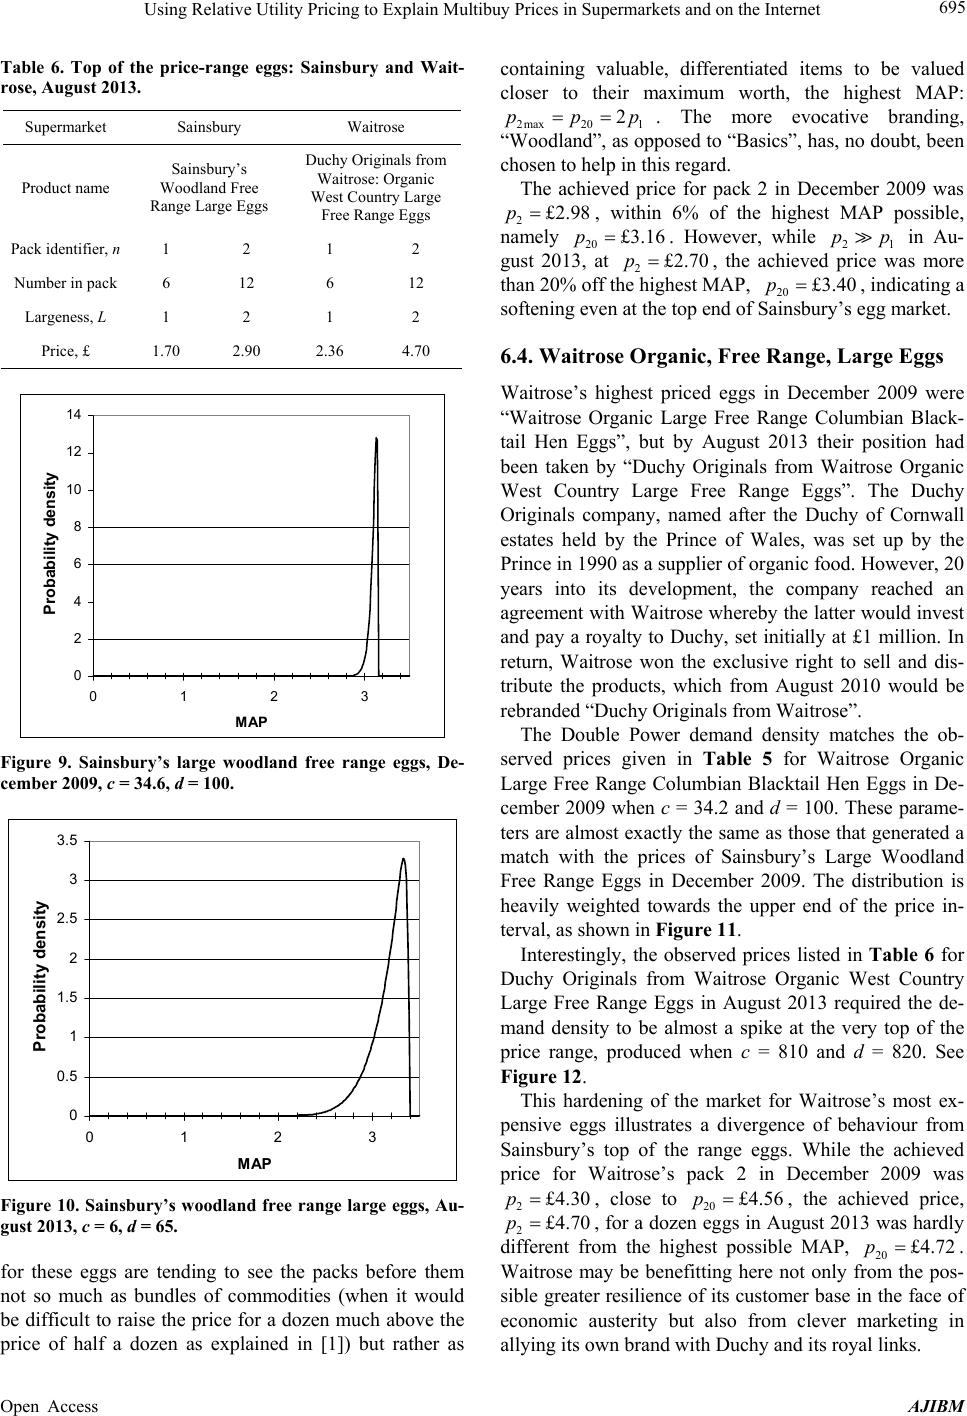 Using Relative Utility Pricing to Explain Multibuy Prices in Supermarkets and on the Internet 695 Table 6. Top of the price-range eggs: Sainsbury and Wait- rose, August 2013. Supermarket Sainsbury Waitrose Product name Sainsbury’s Woodland Free Range Large Eggs Duchy Originals from Waitrose: Organic West Country Large Free Range Eggs Pack identifier, n 1 2 1 2 Number in pack 6 12 6 12 Largeness, L 1 2 1 2 Price, £ 1.70 2.90 2.36 4.70 0 2 4 6 8 10 12 14 0123 MAP Probability densit Figure 9. Sainsbury’s large woodland free range eggs, De- cember 2009, c = 34.6, d = 100. 0 0.5 1 1.5 2 2.5 3 3.5 0123 MAP Probability densit Figure 10. Sainsbury’s woodland free range large eggs, Au- gust 2013, c = 6, d = 65. for these eggs are tending to see the packs before them not so much as bundles of commodities (when it would be difficult to raise the price for a dozen much above the price of half a dozen as explained in [1]) but rather as containing valuable, differentiated items to be valued closer to their maximum worth, the highest MAP: 2max 201 2ppp . The more evocative branding, “Woodland”, as opposed to “Basics”, has, no dou bt, been chosen to help in this regard. The achieved price for pack 2 in December 2009 was 2£2.98p , within 6% of the highest MAP possible, namely 20£3.16p . However, while 21 in Au- gust 2013, at 2 pp £2p.70 , the achieved price was more than 20% off the highest MAP, 20 , indicating a softening even at the top end of Sainsbury’s egg market. £3.40p 6.4. Waitrose Organic, Free Range, La rge Eggs Waitrose’s highest priced eggs in December 2009 were “Waitrose Organic Large Free Range Columbian Black- tail Hen Eggs”, but by August 2013 their position had been taken by “Duchy Originals from Waitrose Organic West Country Large Free Range Eggs”. The Duchy Originals company, named after the Duchy of Cornwall estates held by the Prince of Wales, was set up by the Prince in 1990 as a supplier of organic foo d. However, 20 years into its development, the company reached an agreement with Waitrose whereby the latter would invest and pay a royalty to Duchy, set initially at £1 million. In return, Waitrose won the exclusive right to sell and dis- tribute the products, which from August 2010 would be rebranded “Duchy Originals from Waitrose”. The Double Power demand density matches the ob- served prices given in Table 5 for Waitrose Organic Large Free Range Columbian Blacktail Hen Eggs in De- cember 2009 when c = 34.2 and d = 100. These parame- ters are almost exactly the same as those that generated a match with the prices of Sainsbury’s Large Woodland Free Range Eggs in December 2009. The distribution is heavily weighted towards the upper end of the price in- terval, as shown in Figure 11. Interestingly, the observed prices listed in Table 6 for Duchy Originals from Waitrose Organic West Country Large Free Range Eggs in August 2013 required the de- mand density to be almost a spike at the very top of the price range, produced when c = 810 and d = 820. See Figure 12. This hardening of the market for Waitrose’s most ex- pensive eggs illustrates a divergence of behaviour from Sainsbury’s top of the range eggs. While the achieved price for Waitrose’s pack 2 in December 2009 was 2£4.30p , close to 20 £4.56p , the achieved price, 2£4.70p , for a dozen eggs in August 2013 was hardly different from the highest possible MAP, 20 £4.72p . Waitrose may be benefitting here not only from the pos- sible greater resilience of its customer base in the face of economic austerity but also from clever marketing in allying its own brand with Duchy and its royal links. Open Access AJIBM  Using Relative Utility Pricing to Explain Multibuy Prices in Supermarkets and on the Internet 696 0 1 2 3 4 5 6 7 8 9 10 012345 MAP Probability density Figure 11. Waitrose organic large free range Columbian Blacktail hen eggs, December 2009, c = 34.2, d = 100. 0 5 10 15 20 25 30 35 40 012345 MAP Pro bability density Figure 12. Duchy originals from Waitrose organic west country large free range eggs, August 2013, c = 810, d = 820. 7. Using the RUP Model to Examine the Price of USB Memory Sticks Offered on the Internet USB memory sticks are the most convenient way of storing large amounts of computer data for exchange be- tween PCs and laptop computers, for example. Their ca- pacity has grown enormously over recent years. The en- try-level capacity, tens of Megabytes in the mid 2000s, had reached 1 gigabyte (Gb) of memory in December 2009, a size that was already on the point of being su- perseded by the 2 Gb memory stick, with the top of the easily available commercial range being 16 Gb. By Au- gust 2013, the entry-level memory stick was 4 Gb, a size about to be replaced by 8 Gb, while the top of the easily available commercial range had reached 128 Gb. There is limited scope for product differentiation in the field of USB memory sticks since small size is essential for the device and the need for functionality makes it difficult to customise to any great extent, although at- tempts are now being made by offering the same capacity stick in different colours. Competition is fierce, with many manufacturers competing, and a strong need amongst all manufacturers to keep up with the technol- ogy and increase the size of the largest available storage capacity. Industry practice is for pack size to increase by a factor of 2 at each step. Prices were taken from Amazon’s UK web site in De- cember 2009 [13] and August 2013 [14], with less ex ten- sive data obtained from the same website in August 2010. 7.1. December 2009 Table 7 shows the prices for the Integral USB memory sticks of capacity: 1, 2, 4, 8 and 16 Gb. Given the ab- sence of information on the unit variable cost, it was de- cided to specify the shape of the demand density curve and then vary the variable cost of pack r so as to mini- mise the sum of the weighted errors, , with the rebasing integer, r, set to unity in the first instance. Set- ting c = 0 and d = 2 produces a distribution weighted moderately towards the lower end of the price interval, but with a significant fraction of the target population prepared to pay higher prices. These parameters were chosen to bring the shape of curve (Figure 13) roughly into line with the curves found to give good matches to the commodity egg prices at the same date (see Figures 5 and 7). Wr It was not found possible to reproduce the prices of packs 2, 3 and 4 satisfactorily using a single RUP model. Instead three different versions were required to generate prices for pack 2, packs 3 and 4 and packs 4 and 5. This suggests a segmented market, with purchasers interested in buying pack 4 (8 Gb) having no interest in pack 1 (1 Gb), and purchasers interested in pack 5 (16 Gb) disre- garding the existence of packs 1 and 2 (2 Gb). The reduction in the quoted price for a 2 Gb below that of a 1 Gb memory stick reveals an economic anomaly that the RUP model is unable to reproduce. In its closest Table 7. USB memory sticks of the integral brand offered for sale on Amazon.co.uk, December 2009. Size (Gb) cv1, £1 2 4 8 16 Pack identifier, n 1 2 3 4 5 Largeness, L 1 2 4 8 16 Price, £ 6.956.44 7.88 12.7316.95 <1.176.956.96 - - - 0.81- 6.44 7.00 13.54- RUP Double Power price, £, c = 0, d = 20.71- - 7.88 9.5 18.66 Open Access AJIBM 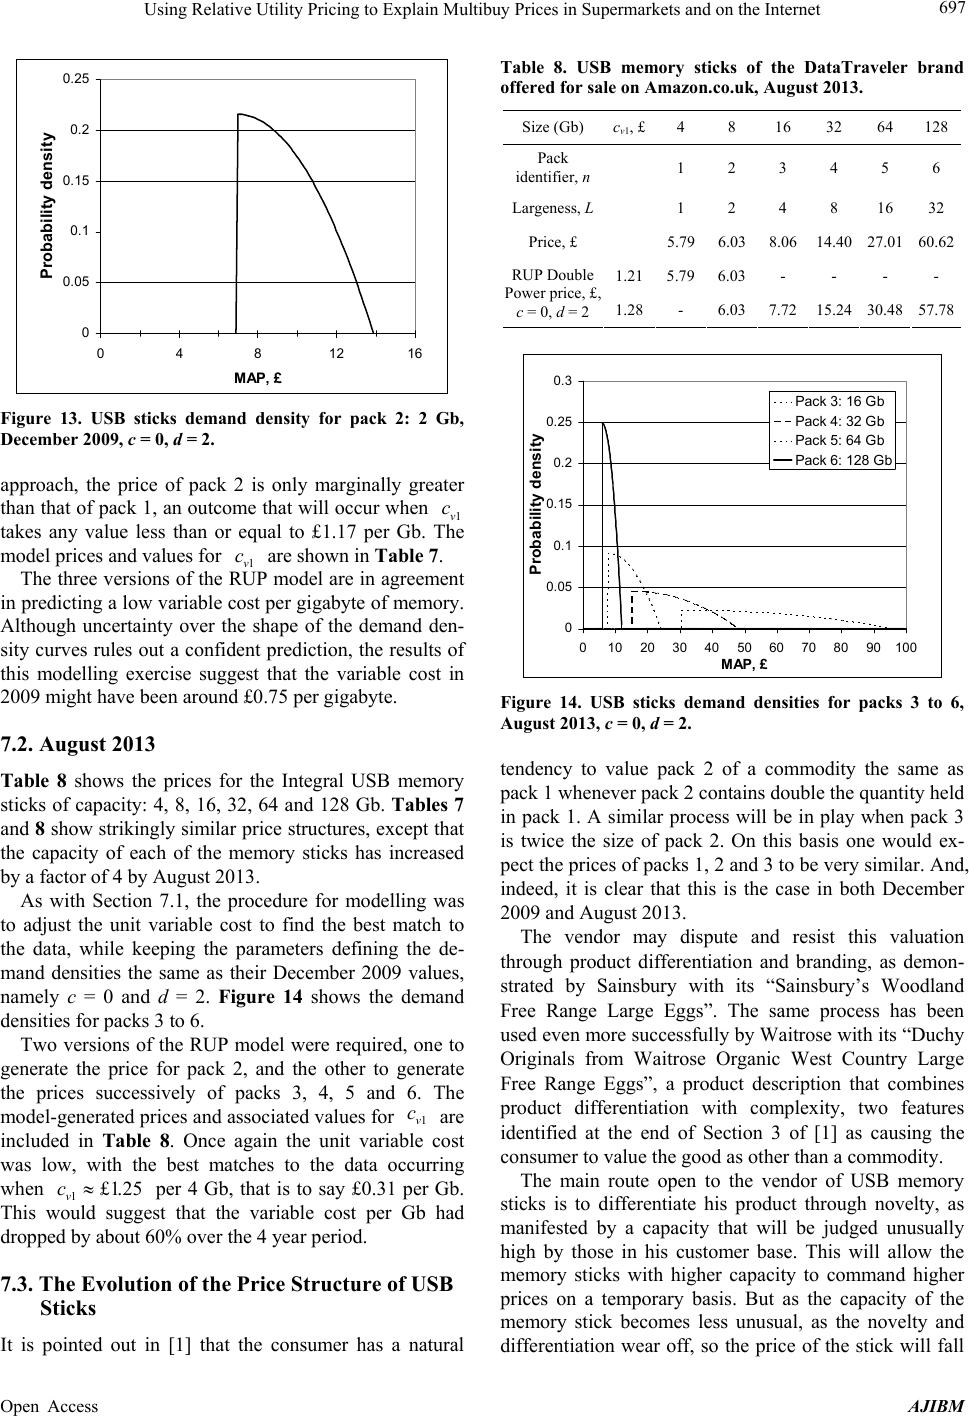 Using Relative Utility Pricing to Explain Multibuy Prices in Supermarkets and on the Internet 697 0 0.05 0.1 0.15 0.2 0.25 0481216 MAP, £ Probability density Figure 13. USB sticks demand density for pack 2: 2 Gb, December 2009, c = 0, d = 2. approach, the price of pack 2 is only marginally greater than that of pack 1, an outcome that will occur when 1v takes any value less than or equal to £1.17 per Gb. The model prices and values for are shown in Table 7. c 1v The three versions of the RUP model are in agreement in predicting a low variable cost per gigabyte of memory. Although uncertainty over the shape of the demand den- sity curves rules out a confident prediction, the results of this modelling exercise suggest that the variable cost in 2009 might have been around £0.75 per gigabyte. c 7.2. August 2013 Table 8 shows the prices for the Integral USB memory sticks of capacity: 4, 8, 16, 32, 64 and 128 Gb. Tables 7 and 8 show striking ly similar price structures, except th at the capacity of each of the memory sticks has increased by a factor of 4 by August 2013. As with Section 7.1, the procedure for modelling was to adjust the unit variable cost to find the best match to the data, while keeping the parameters defining the de- mand densities the same as their December 2009 values, namely c = 0 and d = 2. Figure 14 shows the demand densities for packs 3 to 6. Two versions of the RUP model were required, one to generate the price for pack 2, and the other to generate the prices successively of packs 3, 4, 5 and 6. The model-generated prices and associated values for are included in Table 8. Once again the unit variable cost was low, with the best matches to the data occurring when 1 per 4 Gb, that is to say £0.31 per Gb. This would suggest that the variable cost per Gb had dropped by a bout 6 0% o ver the 4 year perio d. 1v c £1.25 v c 7.3. The Evolution of the Price Structure of USB Sticks It is pointed out in [1] that the consumer has a natural Table 8. USB memory sticks of the DataTraveler brand offered for sale on Amazon.co.uk, August 2013. Size (Gb) cv1, £ 4 8 16 32 64 128 Pack identifier, n 1 2 3 4 5 6 Largeness, L 1 2 4 8 16 32 Price, £ 5.796.03 8.06 14.40 27.0160.62 1.215.796.03 - - - - RUP Double Power price, £, c = 0, d = 21.28- 6.03 7.72 15.24 30.4857.78 0 0.05 0.1 0.15 0.2 0.25 0.3 0 102030405060708090100 MAP, £ Probability density Pack 3: 16 Gb Pack 4: 32 Gb Pack 5: 64 Gb Pack 6: 128 Gb Figure 14. USB sticks demand densities for packs 3 to 6, August 2013, c = 0, d = 2. tendency to value pack 2 of a commodity the same as pack 1 whenever pack 2 contains double the quantity held in pack 1. A similar process will be in play when pack 3 is twice the size of pack 2. On this basis one would ex- pect the prices of packs 1, 2 and 3 to be very similar. And, indeed, it is clear that this is the case in both December 2009 and August 2013. The vendor may dispute and resist this valuation through product differentiation and branding, as demon- strated by Sainsbury with its “Sainsbury’s Woodland Free Range Large Eggs”. The same process has been used even more successfully by Waitrose with its “Duchy Originals from Waitrose Organic West Country Large Free Range Eggs”, a product description that combines product differentiation with complexity, two features identified at the end of Section 3 of [1] as causing the consumer to value the good as other than a commodity. The main route open to the vendor of USB memory sticks is to differentiate his product through novelty, as manifested by a capacity that will be judged unusually high by those in his customer base. This will allow the memory sticks with higher capacity to command higher prices on a temporary basis. But as the capacity of the memory stick becomes less unusual, as the novelty and differentiation wear off, so the price of the stick will fall Open Access AJIBM 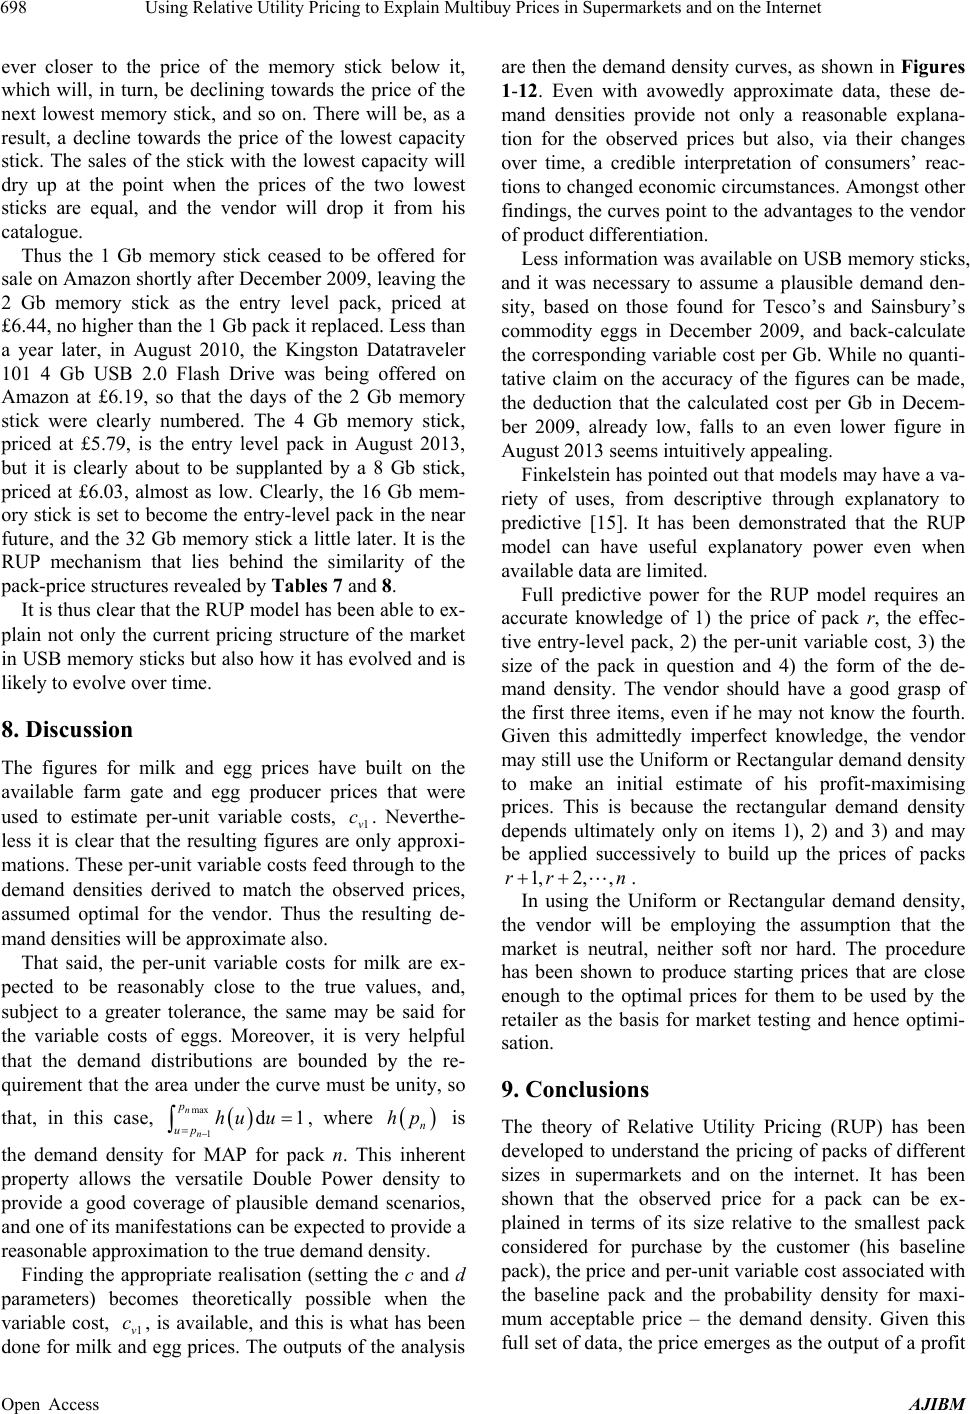 Using Relative Utility Pricing to Explain Multibuy Prices in Supermarkets and on the Internet 698 ever closer to the price of the memory stick below it, which will, in turn, be declining towards the price of the next lowest memory stick, and so on. There will be, as a result, a decline towards the price of the lowest capacity stick. The sales of the stick with the lowest capacity will dry up at the point when the prices of the two lowest sticks are equal, and the vendor will drop it from his catalogue. Thus the 1 Gb memory stick ceased to be offered for sale on Amazon shortly after December 2009, leaving the 2 Gb memory stick as the entry level pack, priced at £6.44, no higher than the 1 Gb pack it replaced. Less than a year later, in August 2010, the Kingston Datatraveler 101 4 Gb USB 2.0 Flash Drive was being offered on Amazon at £6.19, so that the days of the 2 Gb memory stick were clearly numbered. The 4 Gb memory stick, priced at £5.79, is the entry level pack in August 2013, but it is clearly about to be supplanted by a 8 Gb stick, priced at £6.03, almost as low. Clearly, the 16 Gb mem- ory stick is set to become the entry-level pack in the near future, and the 32 Gb memory stick a little later. It is the RUP mechanism that lies behind the similarity of the pack-price structures revealed by Tab l es 7 and 8. It is thus clear that the RUP model has been able to ex- plain not only the current pricing structure of the market in USB memory sticks but also how it has evolved and is likely to evolve over time. 8. Discussion The figures for milk and egg prices have built on the available farm gate and egg producer prices that were used to estimate per-unit variable costs, 1v. Neverthe- less it is clear that the resulting figures are only approxi- mations. These per-unit variable costs feed through to the demand densities derived to match the observed prices, assumed optimal for the vendor. Thus the resulting de- mand densities will be approximate also. c That said, the per-unit variable costs for milk are ex- pected to be reasonably close to the true values, and, subject to a greater tolerance, the same may be said for the variable costs of eggs. Moreover, it is very helpful that the demand distributions are bounded by the re- quirement that the area under the curve must be unity, so that, in this case, , where max 1d n n p up huu 1 n hp is the demand density for MAP for pack n. This inherent property allows the versatile Double Power density to provide a good coverage of plausible demand scenarios, and one of its manifestations can be expected to provide a reasonable approximation to the true demand density. Finding the appropriate realisation (setting the c and d parameters) becomes theoretically possible when the variable cost, 1v, is available, and this is what has been done for milk and egg prices. The ou tputs of the analysis are then the demand density curves, as shown in Figures 1-12. Even with avowedly approximate data, these de- mand densities provide not only a reasonable explana- tion for the observed prices but also, via their changes over time, a credible interpretation of consumers’ reac- tions to changed economic circumstances. Amongst other findings, the curves point to the advantages to th e vendor of product differentiation. c Less information was available on USB memory sticks, and it was necessary to assume a plausible demand den- sity, based on those found for Tesco’s and Sainsbury’s commodity eggs in December 2009, and back-calculate the corresponding variable cost per Gb. While no quanti- tative claim on the accuracy of the figures can be made, the deduction that the calculated cost per Gb in Decem- ber 2009, already low, falls to an even lower figure in August 2013 seems intuitively appealing. Finkelstein has pointed out that models may have a va- riety of uses, from descriptive through explanatory to predictive [15]. It has been demonstrated that the RUP model can have useful explanatory power even when available data are limited. Full predictive power for the RUP model requires an accurate knowledge of 1) the price of pack r, the effec- tive entry-level pack, 2) the per-unit variable cost, 3) the size of the pack in question and 4) the form of the de- mand density. The vendor should have a good grasp of the first three items, even if he may not know the fourth. Given this admittedly imperfect knowledge, the vendor may still use the Uniform or Rectangular demand density to make an initial estimate of his profit-maximising prices. This is because the rectangular demand density depends ultimately only on items 1), 2) and 3) and may be applied successively to build up the prices of packs 1,2, ,rr n . In using the Uniform or Rectangular demand density, the vendor will be employing the assumption that the market is neutral, neither soft nor hard. The procedure has been shown to produce starting prices that are close enough to the optimal prices for them to be used by the retailer as the basis for market testing and hence optimi- sation. 9. Conclusions The theory of Relative Utility Pricing (RUP) has been developed to understand the pricing of packs of different sizes in supermarkets and on the internet. It has been shown that the observed price for a pack can be ex- plained in terms of its size relative to the smallest pack considered for purchase by the customer (his baseline pack), the price and per-unit variable cost associated with the baseline pack and the probability density for maxi- mum acceptable price – the demand density. Given this full set of data, the price emerges as the outpu t of a profit Open Access AJIBM 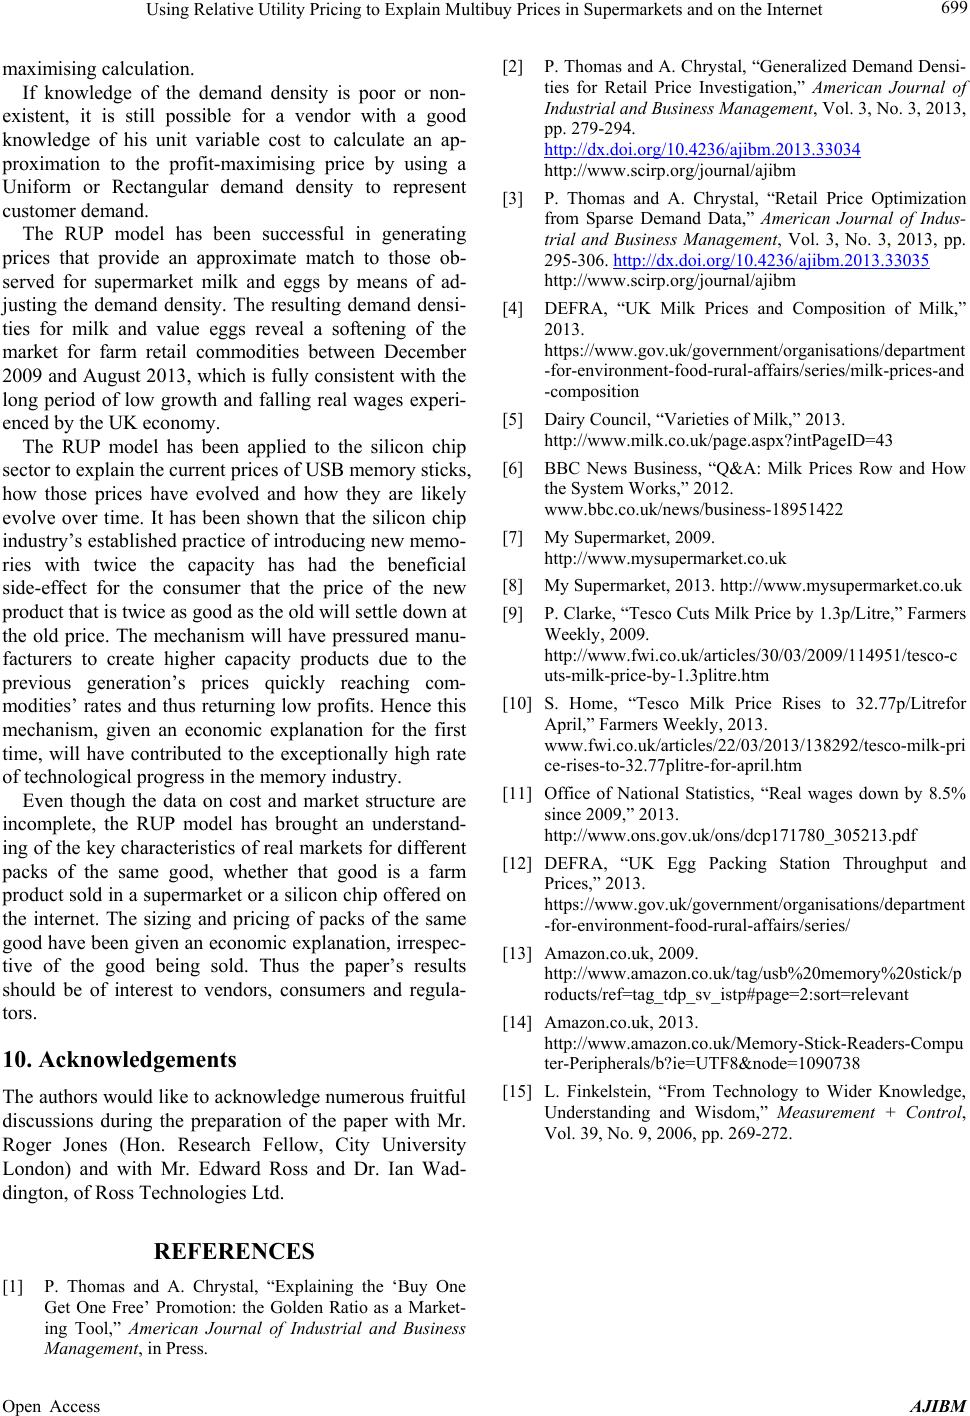 Using Relative Utility Pricing to Explain Multibuy Prices in Supermarkets and on the Internet Open Access AJIBM 699 maximising calculation. If knowledge of the demand density is poor or non- existent, it is still possible for a vendor with a good knowledge of his unit variable cost to calculate an ap- proximation to the profit-maximising price by using a Uniform or Rectangular demand density to represent customer demand. The RUP model has been successful in generating prices that provide an approximate match to those ob- served for supermarket milk and eggs by means of ad- justing the demand density. The resulting demand densi- ties for milk and value eggs reveal a softening of the market for farm retail commodities between December 2009 and August 2013 , which is fully consistent with the long period of low growth and falling real wages experi- enced by the UK economy. The RUP model has been applied to the silicon chip sector to explain the current prices of USB memory sticks, how those prices have evolved and how they are likely evolve over time. It has been shown that the silicon chip industry’s established practice of introducing new memo- ries with twice the capacity has had the beneficial side-effect for the consumer that the price of the new product that is twice as good as the old will settle down at the old price. The mechanism will have pressured manu- facturers to create higher capacity products due to the previous generation’s prices quickly reaching com- modities’ rates and thus returning low profits. Hence this mechanism, given an economic explanation for the first time, will have contributed to the exceptionally high rate of technological progress in the memory industry. Even though the data on cost and market structure are incomplete, the RUP model has brought an understand- ing of the key characteristics of real markets for different packs of the same good, whether that good is a farm product sold in a supermarket or a silicon chip offered on the internet. The sizing and pricing of packs of the same good have been given an economic explanation, irrespec- tive of the good being sold. Thus the paper’s results should be of interest to vendors, consumers and regula- tors. 10. Acknowledgements The authors would like to acknowledge numerous fruitful discussions during the preparation of the paper with Mr. Roger Jones (Hon. Research Fellow, City University London) and with Mr. Edward Ross and Dr. Ian Wad- dington, of Ross Technologies Ltd. REFERENCES [1] P. Thomas and A. Chrystal, “Explaining the ‘Buy One Get One Free’ Promotion: the Golden Ratio as a Market- ing Tool,” American Journal of Industrial and Business Management, in Press. [2] P. Thomas and A. Chrystal, “Generalized Demand Densi- ties for Retail Price Investigation,” American Journal of Industrial and Business Management, Vol. 3, No. 3, 2013, pp. 279-294. http://dx.doi.org/10.4236/ajibm.2013.33034 http://www.scirp.org/journal/ajibm [3] P. Thomas and A. Chrystal, “Retail Price Optimization from Sparse Demand Data,” American Journal of Indus- trial and Business Management, Vol. 3, No. 3, 2013, pp. 295-306. http://dx.doi.org/10.4236/ajibm.2013.33035 http://www.scirp.org/journal/ajibm [4] DEFRA, “UK Milk Prices and Composition of Milk,” 2013. https://www.gov.uk/government/organisations/department -for-environment-food-rural-affairs/series/milk-prices-and -composition [5] Dairy Council, “Varieties of Milk,” 2013. http://www.milk.co.uk/page.aspx?intPageID=43 [6] BBC News Business, “Q&A: Milk Prices Row and How the System Works,” 2012. www.bbc.co.uk/news/business-18951422 [7] My Supermarket, 2009. http://www.mysupermarket.co.uk [8] My Supermarket, 2013. http://www.mysupermarket.co.uk [9] P. Clarke, “Tesco Cuts Milk Price by 1.3p/Litre,” Farmers Weekly, 2009. http://www.fwi.co.uk/articles/30/03/2009/114951/tesco-c uts-milk-price-by-1.3plitre.htm [10] S. Home, “Tesco Milk Price Rises to 32.77p/Litrefor April,” Farmers Weekly, 2013. www.fwi.co.uk/articles/22/03/2013/138292/tesco-milk-pri ce-rises-to-32.77plitre-for-april.htm [11] Office of National Statistics, “Real wages down by 8.5% since 2009,” 2013. http://www.ons.gov.uk/ons/dcp171780_305213.pdf [12] DEFRA, “UK Egg Packing Station Throughput and Prices,” 2013. https://www.gov.uk/government/organisations/department -for-environment-food-rural-affairs/series/ [13] Amazon.co.uk, 2009. http://www.amazon.co.uk/tag/usb%20memory%20stick/p roducts/ref=tag_tdp_sv_istp#page=2:sort=relevant [14] Amazon.co.uk, 2013. http://www.amazon.co.uk/Memory-Stick-Readers-Compu ter-Peripherals/b?ie=UTF8&node=1090738 [15] L. Finkelstein, “From Technology to Wider Knowledge, Understanding and Wisdom,” Measurement + Control, Vol. 39, No. 9, 2006, pp. 269-272.
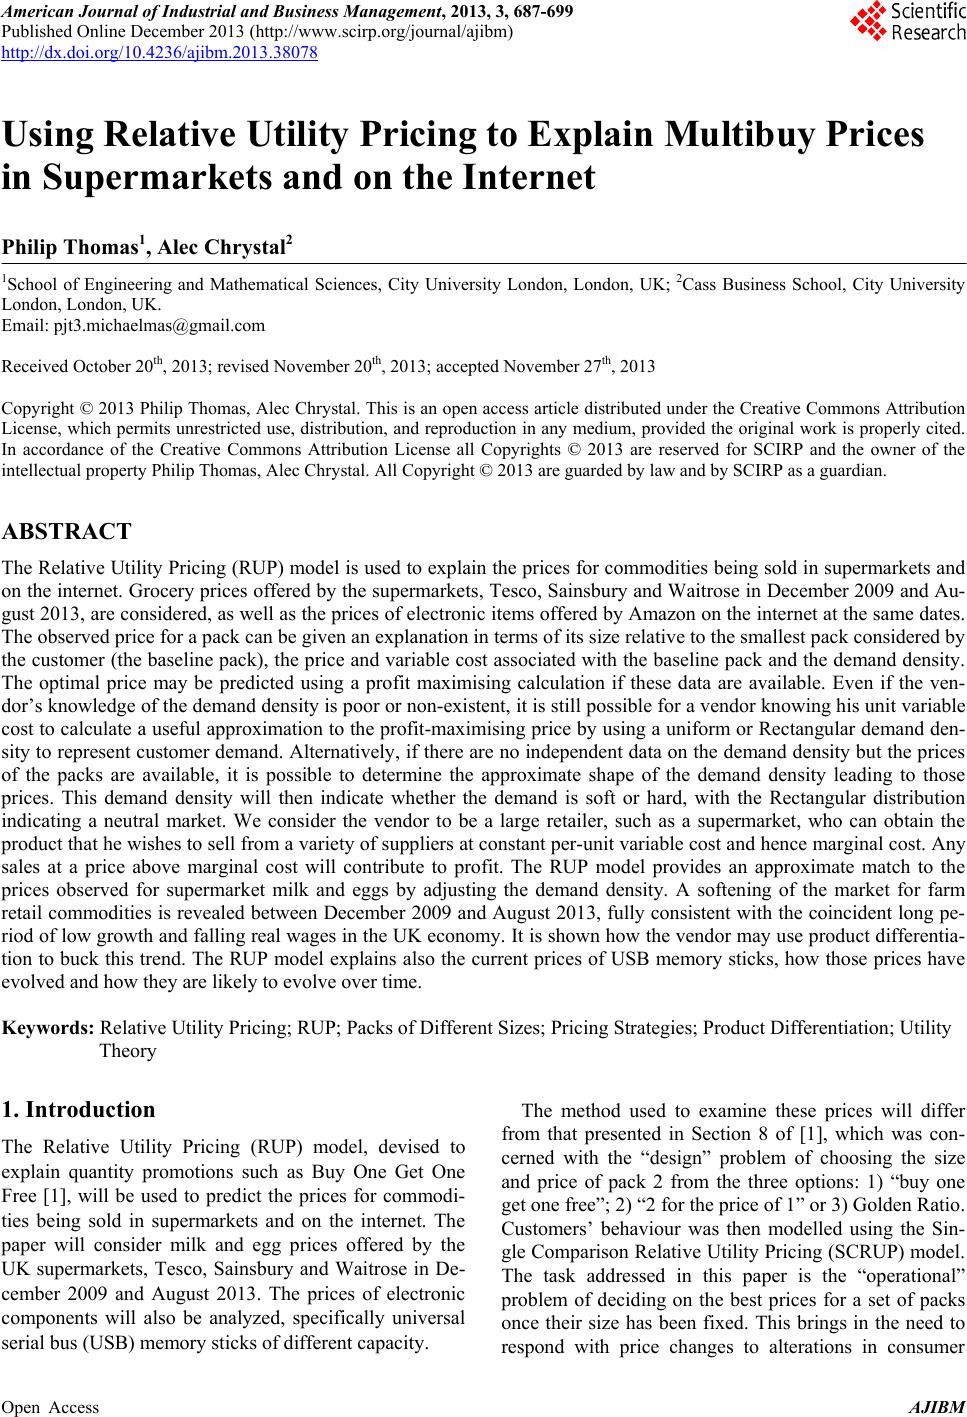
|