 J. Biomedical Science and Engineering, 2013, 6, 1161-1170 JBiSE http://dx.doi.org/10.4236/jbise.2013.612145 Published Online December 2013 (http://www.scirp.org/journal/jbise/) PFP-RFSM: Protein fold prediction by using random forests and sequence motifs Junfei Li, Jigang Wu, Ke Chen* Department of Computer Science, Tianjin Polytechnic University, Tianjin, China Email: *ck.scsse@gmail.com Received 13 November 2013; revised 1 December 2013; accepted 12 December 2013 Copyright © 2013 Junfei Li et al. This is an open access article distributed under the Creative Commons Attribution License, which permits unrestricted use, distribution, and reproduction in any medium, provided the original work is properly cited. In accordance of the Creative Commons Attribution License all Copyrights © 2013 are reserved for SCIRP and the owner of the intellectual property Junfei Li et al. All Copyright © 2013 are guarded by law and by SCIRP as a guardian. ABSTRACT Protein tertiary structure is indispensible in revealing the biological functions of proteins. De novo perdition of protein tertiary structure is dependent on protein fold recognition. This study proposes a novel method for prediction of protein fold types which takes pri- mary sequence as input. The proposed method, PFP- RFSM, emp loys a ra ndom for est clas sifi er and a co m- prehensive feature representation, including both se- quence and predicted structure descriptors. Particu- larly, we propose a method for generation of features based on sequence motifs and those features are firstly employed in protein fold prediction. PFP- RFSM and ten representative protein fold predictors are validated in a benchmark dataset consisting of 27 fold types. Experiments demonstrate that PFP-RFSM outperforms all existing protein fold predictors and improves the success rates by 2% - 14%. The results suggest sequence motifs are effective in classification and analysis of protein sequences. Keywords: Protein Fold; Structure Analysis; Random Forest; Sequence Motifs 1. INTRODUCTION Protein structures are indispensable for revealing the re- gularities associated with protein functions, interactions and cell cycle [1-3]. In addition to biological context, protein structures are frequently used in simulation of protein structures that are unsolved experimentally. The information about protein structure is crucially important for structure-based drug development as elaborated in a comprehensive review [4]. Due to the difficulties in pro- tein extraction, purification, and crystallization, the amount of known protein structures is negligible when com- pared to the amount of solved protein sequences. As of May 2013, the Protein Data Bank [5] includes 83,695 protein structures while RefSeq database [6] includes 31,593,499 non-redundant protein sequences. The struc- tures of 31,509,804 protein sequences are not experi- mentally solved and need to be studied through computa- tional methods. The wide and enlarging gap between known protein sequences and known protein structures with annotated biological functions motivates the devel- opment of in-silico methods for protein sequence analy- sis, protein tertiary structure prediction, and protein func- tion annotation. In-silico study of protein structures can be categorized into two classes: template-based methods and de novo methods. The template-based method, in essence, is an algorithm that identifies templates, i.e., solved protein structures, for a query protein sequence. Both homology modeling [7] and threading [8] belong to template-based methods, and are successful in protein tertiary structure prediction. The difference is that ho- mology modeling identifies templates that are tightly associated with query sequence while threading is capa- ble of recognizing templates that are remotely related to query sequence. The de novo methods are focused on classification of protein structures. Currently, protein structure classification is largely manually implemented. Two hierarchical protein structure classification systems, the SCOP (structural classification of proteins) database [9] and CATH Protein Structure Classification databases [10], were established during the last two decades. How- ever, SCOP and CATH only provide a classification of protein domains with known structures and cannot make a classification for proteins that lack tertiary structures. The first level of the hierarchy of SCOP and CATH is *Corresponding author. OPEN ACCESS  J. F. Li et al. / J. Biomedical Science and Engineering 6 (2013) 1161-1170 1162 defined as a protein structural class, which can be furtherly categorized into a number of folds. Protein folds are the second level of the hierarchy and they are the classifica- tion targets in our study. A number of algorithms were proposed in detection of structural similarity for se- quences that have low sequence similarity [11,12]. In general, prediction of protein fold type for a protein se- quence is typically processed in two steps: firstly, protein sequences are converted into the same feature space, in other words, each sequence is represented by the same number of features; secondly, build a computational model that takes the features as inputs and predicts the protein fold types. Historically, the first model for prediction of protein folds was proposed by Ding and colleagues [13]. They represent the protein sequence by a number of sequence and structural descriptors, i.e., composition vector, sec- ondary structure information and so on. The authors im- plemented two machine learning algorithms, including neural networks and support vector machine, for classi- fication. Several other methods were proposed subse- quently [14-21], and these methods implemented more sophisticated classification architectures while employ- ing similar sequence representation as in Ding’s study [13]. In a study proposed by Chen and Kurgan, the pre- dicted secondary structure was first used in generation of feature space and it provided higher success rates in rec- ognition of protein folds [22]. In this study, we aim at the development of novel fold classification method that improves on known fold rec- ognition method. The proposed method utilizes random forest classifier [23] and employs an extensive set of features, which incorporating sequence-based features, i.e., the composition vectors, predicted structure de- scriptors, i.e., the secondary structure information and features based on BLAST. We also designed a method for calculating features based on sequence motifs, which is for the first time utilized in protein fold classification. According to a recent comprehensive review [24] dem- onstrated by a series of recent publications [25-29], to es- tablish a really useful statistical predictor for a protein system, we need to consider the following procedures: 1) construct or select a valid benchmark dataset to train and test the predictor; 2) formulate the protein samples with an effective mathematical expression that can truly re- flect their intrinsic correlation with the attribute to be predicted; 3) introduce or develop a powerful algorithm (or engine) to operate the prediction; 4) properly perform cross-validation tests to objectively evaluate the antici- pated accuracy of the predictor; 5) establish a user- friendly web-server for the predictor that is accessible to the public. Below, let us describe how to deal with these steps. 2. MATERIALS AND METHODS 2.1. Datasets Similar to existing fold classification methods, the pro- posed method is designed on a training dataset with 313 domains and validated on a test set with 385 domains. Both training and test sets were created by Ding and Dubchak [13]. The sequence identity for any pair of se- quences in the training set is less than 35%. The se- quence in test set also share less than 35% sequence identity with the sequences in the training set. According to the SCOP database [32], these domains can be classi- fied into 27 fold types: (1) globin-like, (2) cytochrome c, (3) DNA-binding3-helical bundle, (4) 4-helical up-and- down bundle, (9) 4-helical-cytokines, (11) EF-hand, (20) immunoglobulin-like, (23) cupredoxins, (26) viral coat and capsid proteins, (30) conA-like lectin/glucanases, (31) SH3-like barrel, (32) OB-fold, (33) beta-trefoil, (35) trypsin-like serine proteases, (39) lipocalins, (46) (TIM)- barrel, (47) FAD (also NAD)-binding motif, (48) fla- vodoxin-like, (51) NAD(P)-binding Rossmann-fold, (54) P-loop, (57) thioredoxin-like, (59) ribonuclease H-like motif, (62) hydrolases, (69) periplasmic binding protein- like, (72) b-grasp, (87) ferredoxin-like and (110) small inhibitors, toxins and lectins. Of the above 27 fold types, folds 1 - 11 belong to all α structural class, folds 20 - 39 to all β class, folds 46 - 69 to α/β class and folds 72 - 87 to α + β class. 2.2. Feature-Based Representation This study utilizes both sequence and predicted structure descriptors as inputs. The sequence representation in- cludes a comprehensive list of features that was previ- ously used for prediction of protein structural class [11, 33,34], protein fold types [17] and protein folding rates [35], and protein sub-cellular locations [36]. As sug- gested by Chou, the feature vector of protein sequences can be seen as a general form of pseudo amino acid composition [37], which can be formulated as 12 u T P (1) where T is a transpose operator, the components 1 , 2 , … depend on how to extract the desired information from the statistical samples, while Ω is an integer stand- ing for the dimension of the feature vector P. In our study, we generate 7 sets of features, including composi- tion vector of amino acids, secondary structure contents, predicted relative solvent accessibility, predicted dihe- dral angles, features based on the PSSM matrix, features based on nearest neighbour sequences and features based on sequence motifs, which are denoted by 1 , 2 , … 7 respectively. The definitions of the 7 sets of features are given as below: – Composition Vector of Amino Acids is calculated di- Copyright © 2013 SciRes. OPEN ACCESS  J. F. Li et al. / J. Biomedical Science and Engineering 6 (2013) 1161-1170 Copyright © 2013 SciRes. 1163 rectly from primary sequence. The composition vec- tor contains 20 values and each value stands for the percentage of a certain amino acid in a given se- quence [38-40]. OPEN ACCESS – Secondary Structure Contents are generated by PSIPRED [30]. The PSIPRED program generates the 3-states secondary structures for each residue of the sequence. Subsequently, we calculate the contents of the 3 secondary structure states, which is similar to the calculation of composition vectors. – Predicted Relative Solvent Accessibility is generated by Real-SPINE3 [31]. We use the real values, which quantify the fraction of the surface area of a given residue that is accessible to the solvent, for the resi- dues in the window. The average of the relative sol- vent accessibility of each residue is utilized to stand for the relative solvent accessibility of a sequence. – Predicted Dihedral Angles are generated by Real- SPINE3 [31]. We utilize two real values, which rep- resent phi (involving the backbone atoms C’-N-Cα-C’) and psi (involving the backbone atoms N-Cα-C’-N) angles. Similarly, the phi and psi angles are averaged for the entire sequence. – Features Based on the PSSM Matrix are generated by PSI-Blast [32]. The PSI-Blast provides two position specific scoring matrices; one contains conservation scores of a given AA at a given position in a sequence and the other provides probability of occurrence of a given AA at given position in the sequence. The ma- trix values are aggregated either horizontally or ver- tically to obtain a fixed length feature vector. The de- tails of calculation of this set of features were given in [46]. – Features Based on Nearest Neighbor Sequences are generated by Blast [32]. For a test sequence, Blast firstly identifies a number of neighbor sequences, meaning that these sequences have the lowest p-val- ues when performing pairwise alignment to the test sequence. In other words, the identified neighboring sequences have higher probability to be homologous to the test sequence. For each test sequence, the top 5 neighboring sequences in the training set are identi- fied and a vector of n values are utilized to represent each neighboring sequence, where n stands for the number of fold types, i.e., n = 27 in this article. If the neighboring sequence belongs to fold type i, then the ith value of the vector is assigned with the p-value and the remaining values are set to 0. Totally, this set of features includes 27 * 5 = 135 features. – Features Based on Sequence Motifs are generated by GLAM2 program [41]. Generation of sequence mo- tifs includes 2 steps and is performed in the training set. Firstly, training set is divided into 27 subsets based on the fold types, meaning that sequences in the same subset belong to the same fold type. For each subset, we perform GLAM2 program and iden- tify three sequence motifs with lowest p-values. Therefore, we totally generate 27 * 3 = 81 motifs. Secondly, we calculate the similarity between a test sequence and the 81 motifs. We use the 81 similarity scores as input features for classification. 2.3. Random Forest Classifier We validate the predictive quality of 6 representative classifiers, including random forest [23], support vector machine (SVM) [42], kstar algorithm [43], nearest neigh- bour (IB1) [44], Naïve Bayes [45] and multiple logistic regression. The random forest classifier is employed by PFP-RFSM as it outperforms the remaining classifiers and the detailed results are given in the following sec- tion. Random forest is an ensemble learning method that generates a multitude of decision trees. The method in- cludes 2 parameters, i.e., the number of selected features, denoted by n, and number of constructed trees, denoted by k. The method generally includes 4 steps. Firstly, we randomly select n features from the full feature set. Sec- ondly, we perform the bagging algorithm on the training set and generate a training set with re-sampled instances. Thirdly, employ a decision tree algorithm on the re- sampled training set and the randomly selected feature space, and build a decision tree, which serves as base classifier in Step 4. Repeat Steps 1, 2 and 3 for k times and generate k decision trees. Lastly, summarize the k decision trees and generate final predictions. The archi- tecture of random forest algorithm is given in Figure 1. 2.4. Evaluation Criteria The assessment of the predicted results was reported using several measures including success rate and Mat- thews’s correlation coefficient (MCC) for each class. The two measures are frequently used in previous studies on protein fold prediction [13-16,20,21]. In this study, we utilize the same measures for evaluation and they are defined in Equations (2) and (3). Number of correctly predicted instances in fold type Success rateNumber of instances in fold type k k (2) MCC TP TNFPFN TPFNTPFP TNFP TNFN (3)  J. F. Li et al. / J. Biomedical Science and Engineering 6 (2013) 1161-1170 1164 Features RandomlySelectaSubsetofFe a t ures Tr aining Sample1 Tr aining Sample2 Training Sample3 Training Sample4 Tr aining Samplek …… Decision Tr ee1 Decision Tr ee2 Decision Tr ee3 Decision Tr ee4 …… Decision Treek Finalprediction Summarizekdecision trees Featur e Subset2 Feature Subset3 Featur e Subset4 Feature Subsetk …… Featur e Subset1 Bagging BaggingBagging Bagging Bagging Bagging Figure 1. Architecture of random forest classifier. Random forest generally includes 4 steps. Firstly, we randomly select n features from the full feature set. Secondly, we perform the bagging algorithm on the training set and generate a training set with re-sampled instances. Thirdly, employ a decision tree algorithm on the re-sampled training set and the randomly selected feature space, and build a decision tree, which serves as base classifier in Step 4. Repeat Steps 1, 2 and 3 for k times and generate k decision trees. Lastly, summarize the k decision trees and generate final predictions. where TP, TN, FP and FN stand for true positives, true negatives, false positives and false negatives respec- tively. 3. RESULTS AND DISCUSSION 3.1. Comparison between Random Forest and Other Machine Learning Classifiers We first validate the performance of the random forest classifier, meaning that random forest classifier is com- pared with a variety of machine learning classifiers, in- cluding support vector machine (SVM), Kstar algorithm, Nearest Neighbour (IB1), Naïve Bayes and Multiple Lo- gistic Regression on the same feature representation. The success rates and MCC of the 6 representative classifiers are shown in Tables 1 and 2 respectively. Random Forest (with 300 trees and 60 features) gives the highest success rate, i.e. 73.7%, among the six classifiers, whereas, the runner up classifier, Naïve Bayes achieves an average success rate of 71.4% over the 27 folds. We note that the success rates of the remaining classifiers are all below 70%. Similar trend is observed for MCC, see Table 2. Random forest achieves the highest MCC, i.e., 0.746, followed by the Naïve Bayes classifier, which outperforms the remaining 4 classifiers. Among the 27 folds, random forest achieves the highest success rate in 16 folds and the highest MCC for 15 folds. Overall, ran- dom forest classifier is more accurate in prediction of protein folds than the remaining classification method. 3.2. Comparison with Competing Methods To demonstrate the performance of PFP-RFSM, evalua- tion was performed on the same benchmark dataset which was employed by existing methods [13-17,22]. PFP-RFSM is compared with 10 representative protein Copyright © 2013 SciRes. OPEN ACCESS 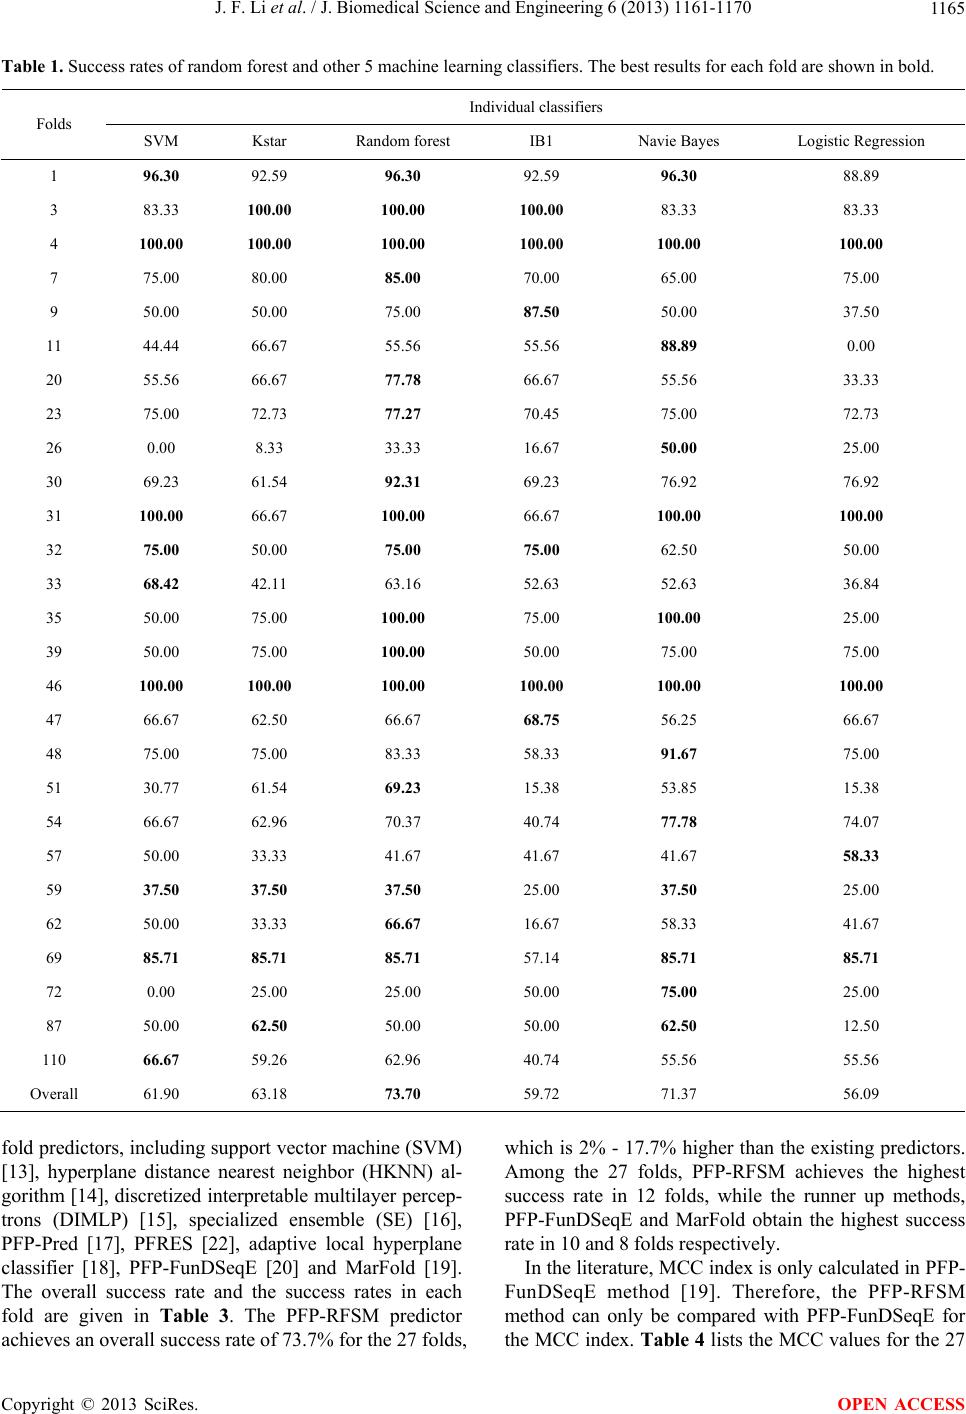 J. F. Li et al. / J. Biomedical Science and Engineering 6 (2013) 1161-1170 1165 Table 1. Success rates of random forest and other 5 machine learning classifiers. The best results for each fold are shown in bold. Individual classifiers Folds SVM Kstar Random forest IB1 Navie Bayes Logistic Regression 1 96.30 92.59 96.30 92.59 96.30 88.89 3 83.33 100.00 100.00 100.00 83.33 83.33 4 100.00 100.00 100.00 100.00 100.00 100.00 7 75.00 80.00 85.00 70.00 65.00 75.00 9 50.00 50.00 75.00 87.50 50.00 37.50 11 44.44 66.67 55.56 55.56 88.89 0.00 20 55.56 66.67 77.78 66.67 55.56 33.33 23 75.00 72.73 77.27 70.45 75.00 72.73 26 0.00 8.33 33.33 16.67 50.00 25.00 30 69.23 61.54 92.31 69.23 76.92 76.92 31 100.00 66.67 100.00 66.67 100.00 100.00 32 75.00 50.00 75.00 75.00 62.50 50.00 33 68.42 42.11 63.16 52.63 52.63 36.84 35 50.00 75.00 100.00 75.00 100.00 25.00 39 50.00 75.00 100.00 50.00 75.00 75.00 46 100.00 100.00 100.00 100.00 100.00 100.00 47 66.67 62.50 66.67 68.75 56.25 66.67 48 75.00 75.00 83.33 58.33 91.67 75.00 51 30.77 61.54 69.23 15.38 53.85 15.38 54 66.67 62.96 70.37 40.74 77.78 74.07 57 50.00 33.33 41.67 41.67 41.67 58.33 59 37.50 37.50 37.50 25.00 37.50 25.00 62 50.00 33.33 66.67 16.67 58.33 41.67 69 85.71 85.71 85.71 57.14 85.71 85.71 72 0.00 25.00 25.00 50.00 75.00 25.00 87 50.00 62.50 50.00 50.00 62.50 12.50 110 66.67 59.26 62.96 40.74 55.56 55.56 Overall 61.90 63.18 73.70 59.72 71.37 56.09 fold predictors, including support vector machine (SVM) [13], hyperplane distance nearest neighbor (HKNN) al- gorithm [14], discretized interpretable multilayer percep- trons (DIMLP) [15], specialized ensemble (SE) [16], PFP-Pred [17], PFRES [22], adaptive local hyperplane classifier [18], PFP-FunDSeqE [20] and MarFold [19]. The overall success rate and the success rates in each fold are given in Table 3. The PFP-RFSM predictor achieves an overall success rate of 73.7% for the 27 folds, which is 2% - 17.7% higher than the existing predictors. Among the 27 folds, PFP-RFSM achieves the highest success rate in 12 folds, while the runner up methods, PFP-FunDSeqE and MarFold obtain the highest success rate in 10 and 8 folds respectively. In the literature, MCC index is only calculated in PFP- FunDSeqE method [19]. Therefore, the PFP-RFSM method can only be compared with PFP-FunDSeqE for the MCC index. Table 4 lists the MCC values for the 27 Copyright © 2013 SciRes. OPEN ACCESS  J. F. Li et al. / J. Biomedical Science and Engineering 6 (2013) 1161-1170 1166 Table 2. Matthews’s correlation coefficients (MCC) calculated for random forest and other 5 machine learning classifiers. Individual classifiers Folds SVM Kstar Random forest IB1 Navie Bayes Logistic Regression 1 89.06 73.97 97.99 95.96 97.99 93.89 3 76.76 100.00 92.46 86.37 63.86 91.17 4 100.00 90.21 94.74 100.00 86.25 100.00 7 55.53 61.88 66.19 57.72 71.36 54.57 9 52.53 56.97 66.31 70.73 36.07 42.26 11 66.23 81.32 74.14 74.14 83.93 0.00 20 58.00 81.32 77.24 70.05 58.00 57.28 23 68.88 66.38 72.33 65.68 69.81 67.29 26 0.00 28.45 57.12 27.64 56.57 49.40 30 71.12 77.92 95.95 65.50 70.54 76.11 31 62.49 44.08 67.30 46.01 67.30 64.77 32 70.05 39.29 66.31 63.08 61.70 45.94 33 53.63 44.98 53.63 50.16 51.74 38.78 35 70.52 86.49 100.00 74.74 75.29 49.80 39 70.52 86.49 100.00 70.52 86.49 86.49 46 100.00 93.42 100.00 83.33 100.00 93.42 47 58.67 57.95 67.48 49.44 60.77 58.67 48 86.25 81.64 91.04 75.87 87.67 77.67 51 48.65 60.19 65.50 17.43 52.22 20.86 54 80.64 69.54 82.96 54.42 83.20 80.87 57 53.45 32.80 49.77 31.41 49.77 34.51 59 60.83 36.17 60.83 30.49 42.26 40.12 62 39.79 31.18 42.81 15.85 45.58 27.00 69 79.79 71.11 92.46 61.07 71.11 62.03 72 0.00 49.80 49.80 70.52 86.49 49.80 87 70.34 66.16 70.34 48.93 54.86 24.27 110 54.04 56.17 58.88 43.97 60.57 51.04 Overall 62.88 63.92 74.58 59.30 67.83 56.96 fold types. The average MCC values of PFP-RFSM and PFP-FunDSeqE over the 27 folds are 0.75 and 0.7 re- spectively. We note that PFP-RFSM achieves higher MCC values than PFP-FunDSeqE for 18 fold types while PFP-FunDSeqE obtains higher MCC values in the re- maining 9 folds. Overall, PFP-RFSM generates better predictions than PFP-FunDSeqE for majority of the fold types. 4. CONCLUSION This study proposes a novel method, PFP-RFSM, that takes primary sequence as input and aims at the predic- tion of protein fold types. The PFP-RFSM method em- ploys random forest classifier and a comprehensive fea- ture representation. In particular, the features based on sequence motifs are firstly proposed in protein sequence classification whereas the random forest classifier is firstly utilized for protein fold prediction. PFP-RFSM is compared with 10 representative methods on a bench- mark dataset consisting of 27 folds. Extensive experi- ments demonstrate that PFP-RFSM outperforms all known methods which are predictions by PFP-RFSM and are Copyright © 2013 SciRes. OPEN ACCESS 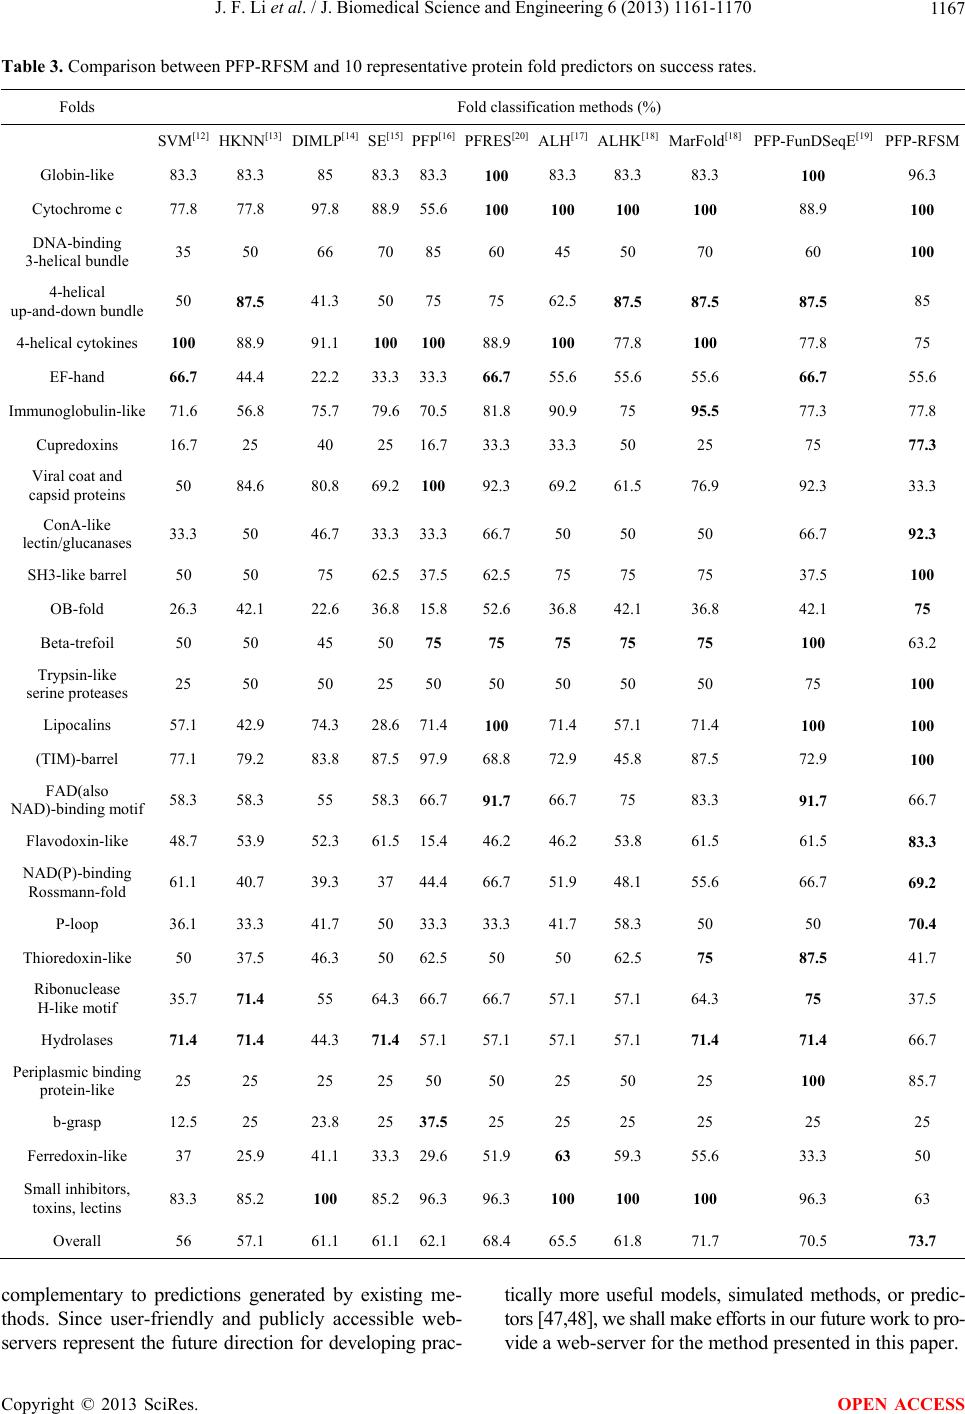 J. F. Li et al. / J. Biomedical Science and Engineering 6 (2013) 1161-1170 1167 Table 3. Comparison between PFP-RFSM and 10 representative protein fold predictors on success rates. Folds Fold classification methods (%) SVM[12] HKNN[13] DIMLP[14] SE[15] PFP[16] PFRES[20]ALH[17]ALHK[18]MarFold[18] PFP-FunDSeqE[19]PFP-RFSM Globin-like 83.3 83.3 85 83.383.3100 83.383.3 83.3 100 96.3 Cytochrome c 77.8 77.8 97.8 88.955.6100 100 100 100 88.9 100 DNA-binding 3-helical bundle 35 50 66 7085 60 45 50 70 60 100 4-helical up-and-down bundle 50 87.5 41.3 5075 75 62.587.5 87.5 87.5 85 4-helical cytokines 100 88.9 91.1 100 10088.9 100 77.8 100 77.8 75 EF-hand 66.7 44.4 22.2 33.333.366.7 55.655.6 55.6 66.7 55.6 Immunoglobulin-like 71.6 56.8 75.7 79.670.581.8 90.975 95.5 77.3 77.8 Cupredoxins 16.7 25 40 2516.733.3 33.350 25 75 77.3 Viral coat and capsid proteins 50 84.6 80.8 69.2100 92.3 69.261.5 76.9 92.3 33.3 ConA-like lectin/glucanases 33.3 50 46.7 33.333.366.7 50 50 50 66.7 92.3 SH3-like barrel 50 50 75 62.537.562.5 75 75 75 37.5 100 OB-fold 26.3 42.1 22.6 36.815.852.6 36.842.1 36.8 42.1 75 Beta-trefoil 50 50 45 5075 75 75 75 75 100 63.2 Trypsin-like serine proteases 25 50 50 2550 50 50 50 50 75 100 Lipocalins 57.1 42.9 74.3 28.671.4100 71.457.1 71.4 100 100 (TIM)-barrel 77.1 79.2 83.8 87.597.968.8 72.945.8 87.5 72.9 100 FAD(also NAD)-binding motif 58.3 58.3 55 58.366.791.7 66.775 83.3 91.7 66.7 Flavodoxin-like 48.7 53.9 52.3 61.515.446.2 46.253.8 61.5 61.5 83.3 NAD(P)-binding Rossmann-fold 61.1 40.7 39.3 3744.466.7 51.948.1 55.6 66.7 69.2 P-loop 36.1 33.3 41.7 5033.333.3 41.758.3 50 50 70.4 Thioredoxin-like 50 37.5 46.3 5062.550 50 62.5 75 87.5 41.7 Ribonuclease H-like motif 35.7 71.4 55 64.366.766.7 57.157.1 64.3 75 37.5 Hydrolases 71.4 71.4 44.3 71.4 57.157.1 57.157.1 71.4 71.4 66.7 Periplasmic binding protein-like 25 25 25 2550 50 25 50 25 100 85.7 b-grasp 12.5 25 23.8 2537.5 25 25 25 25 25 25 Ferredoxin-like 37 25.9 41.1 33.329.651.9 63 59.3 55.6 33.3 50 Small inhibitors, toxins, lectins 83.3 85.2 100 85.296.396.3 100 100 100 96.3 63 Overall 56 57.1 61.1 61.162.168.4 65.561.8 71.7 70.5 73.7 complementary to predictions generated by existing me- thods. Since user-friendly and publicly accessible web- servers represent the future direction for developing prac- tically more useful models, simulated methods, or predic- tors [47,48], we shall make efforts in our future work to pro- vide a web-server for the method presented in this paper. Copyright © 2013 SciRes. OPEN ACCESS 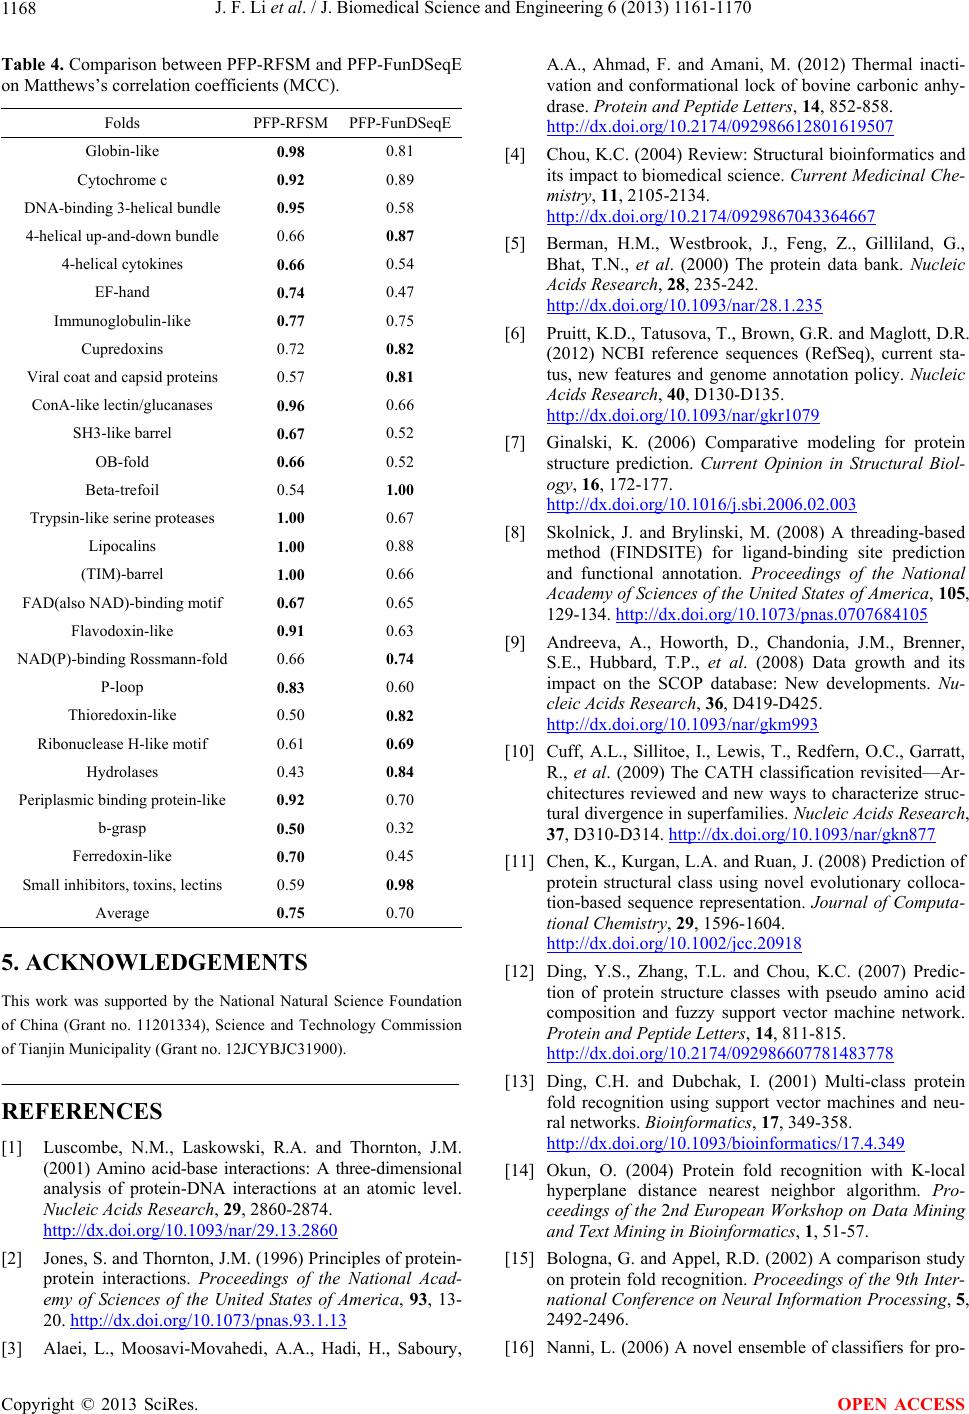 J. F. Li et al. / J. Biomedical Science and Engineering 6 (2013) 1161-1170 1168 Table 4. Comparison between PFP-RFSM and PFP-FunDSeqE on Matthews’s correlation coefficients (MCC). Folds PFP-RFSM PFP-FunDSeqE Globin-like 0.98 0.81 Cytochrome c 0.92 0.89 DNA-binding 3-helical bundle 0.95 0.58 4-helical up-and-down bundle 0.66 0.87 4-helical cytokines 0.66 0.54 EF-hand 0.74 0.47 Immunoglobulin-like 0.77 0.75 Cupredoxins 0.72 0.82 Viral coat and capsid proteins 0.57 0.81 ConA-like lectin/glucanases 0.96 0.66 SH3-like barrel 0.67 0.52 OB-fold 0.66 0.52 Beta-trefoil 0.54 1.00 Trypsin-like serine proteases 1.00 0.67 Lipocalins 1.00 0.88 (TIM)-barrel 1.00 0.66 FAD(also NAD)-binding motif 0.67 0.65 Flavodoxin-like 0.91 0.63 NAD(P)-binding Rossmann-fold 0.66 0.74 P-loop 0.83 0.60 Thioredoxin-like 0.50 0.82 Ribonuclease H-like motif 0.61 0.69 Hydrolases 0.43 0.84 Periplasmic binding protein-like 0.92 0.70 b-grasp 0.50 0.32 Ferredoxin-like 0.70 0.45 Small inhibitors, toxins, lectins 0.59 0.98 Average 0.75 0.70 5. ACKNOWLEDGEMENTS This work was supported by the National Natural Science Foundation of China (Grant no. 11201334), Science and Technology Commission of Tianjin Municipality (Grant no. 12JCYBJC31900). REFERENCES [1] Luscombe, N.M., Laskowski, R.A. and Thornton, J.M. (2001) Amino acid-base interactions: A three-dimensional analysis of protein-DNA interactions at an atomic level. Nucleic Acids Research, 29, 2860-2874. http://dx.doi.org/10.1093/nar/29.13.2860 [2] Jones, S. and Thornton, J.M. (1996) Principles of protein- protein interactions. Proceedings of the National Acad- emy of Sciences of the United States of America, 93, 13- 20. http://dx.doi.org/10.1073/pnas.93.1.13 [3] Alaei, L., Moosavi-Movahedi, A.A., Hadi, H., Saboury, A.A., Ahmad, F. and Amani, M. (2012) Thermal inacti- vation and conformational lock of bovine carbonic anhy- drase. Protein and Peptide Letters, 14, 852-858. http://dx.doi.org/10.2174/092986612801619507 [4] Chou, K.C. (2004) Review: Structural bioinformatics and its impact to biomedical science. Current Medicinal Che- mistry, 11, 2105-2134. http://dx.doi.org/10.2174/0929867043364667 [5] Berman, H.M., Westbrook, J., Feng, Z., Gilliland, G., Bhat, T.N., et al. (2000) The protein data bank. Nucleic Acids Research, 28, 235-242. http://dx.doi.org/10.1093/nar/28.1.235 [6] Pruitt, K.D., Tatusova, T., Brown, G.R. and Maglott, D.R. (2012) NCBI reference sequences (RefSeq), current sta- tus, new features and genome annotation policy. Nucleic Acids Research, 40, D130-D135. http://dx.doi.org/10.1093/nar/gkr1079 [7] Ginalski, K. (2006) Comparative modeling for protein structure prediction. Current Opinion in Structural Biol- ogy, 16, 172-177. http://dx.doi.org/10.1016/j.sbi.2006.02.003 [8] Skolnick, J. and Brylinski, M. (2008) A threading-based method (FINDSITE) for ligand-binding site prediction and functional annotation. Proceedings of the National Academy of Sciences of the United States of America, 105, 129-134. http://dx.doi.org/10.1073/pnas.0707684105 [9] Andreeva, A., Howorth, D., Chandonia, J.M., Brenner, S.E., Hubbard, T.P., et al. (2008) Data growth and its impact on the SCOP database: New developments. Nu- cleic Acids Research, 36, D419-D425. http://dx.doi.org/10.1093/nar/gkm993 [10] Cuff, A.L., Sillitoe, I., Lewis, T., Redfern, O.C., Garratt, R., et al. (2009) The CATH classification revisited—Ar- chitectures reviewed and new ways to characterize struc- tural divergence in superfamilies. Nucleic Acids Research, 37, D310-D314. http://dx.doi.org/10.1093/nar/gkn877 [11] Chen, K., Kurgan, L.A. and Ruan, J. (2008) Prediction of protein structural class using novel evolutionary colloca- tion-based sequence representation. Journal of Computa- tional Chemistry, 29, 1596-1604. http://dx.doi.org/10.1002/jcc.20918 [12] Ding, Y.S., Zhang, T.L. and Chou, K.C. (2007) Predic- tion of protein structure classes with pseudo amino acid composition and fuzzy support vector machine network. Protein and Peptide Letters, 14, 811-815. http://dx.doi.org/10.2174/092986607781483778 [13] Ding, C.H. and Dubchak, I. (2001) Multi-class protein fold recognition using support vector machines and neu- ral networks. Bioinformatics, 17, 349-358. http://dx.doi.org/10.1093/bioinformatics/17.4.349 [14] Okun, O. (2004) Protein fold recognition with K-local hyperplane distance nearest neighbor algorithm. Pro- ceedings of the 2nd European Workshop on Data Mining and Text Mining in Bioinformatics, 1, 51-57. [15] Bologna, G. and Appel, R.D. (2002) A comparison study on protein fold recognition. Proceedings of the 9th Inter- national Conference on Neural Information Processing, 5, 2492-2496. [16] Nanni, L. (2006) A novel ensemble of classifiers for pro- Copyright © 2013 SciRes. OPEN ACCESS  J. F. Li et al. / J. Biomedical Science and Engineering 6 (2013) 1161-1170 1169 tein fold recognition. Neurocomputing, 69, 2434-2437. http://dx.doi.org/10.1016/j.neucom.2006.01.026 [17] Shen, H.B. and Chou, K.C. (2006) Ensemble classifier for protein fold pattern recognition. Bioinformatics, 22, 1717-1722. http://dx.doi.org/10.1093/bioinformatics/btl170 [18] Yang, T. and Kecman, V. (2008) Adaptive local hyper- plane classification. Neurocomputing, 71, 3001-3004. http://dx.doi.org/10.1016/j.neucom.2008.01.014 [19] Yang, T., Kecman, V., Cao, L., Zhang, C. and Huang, J.Z. (2011) Margin-based ensemble classifier for protein fold recognition. Expert Systems, 38, 12348-12355. http://dx.doi.org/10.1016/j.eswa.2011.04.014 [20] Shen, H.B. and Chou, K.C. (2009) Predicting protein fold pattern with functional domain and sequential evolution information. Journal of Theoretical Biology, 256, 441- 446. http://dx.doi.org/10.1016/j.jtbi.2008.10.007 [21] Liu, L., Hu, X.Z., Liu, X.X., Wang, Y. and Li, S.B. (2012) Predicting protein fold types by the general form of chou’s pseudo amino acid composition: Approached from optimal feature extractions. Protein & Peptide Letters, 19, 439-449. http://dx.doi.org/10.2174/092986612799789378 [22] Chen, K. and Kurgan, L. (2007) PFRES: Protein fold classification by using evolutionary information and pre- dicted secondary structure. Bioinformatics, 23, 2843- 2850. http://dx.doi.org/10.1093/bioinformatics/btm475 [23] Leo, B. (2001) Random forests. Machine Learning, 1, 5- 32. [24] Chou, K.C. (2011) Some remarks on protein attribute pre- diction and pseudo amino acid composition (50th anni- versary year review). Journal of Theoretical Biology, 273, 236-247. http://dx.doi.org/10.1016/j.jtbi.2010.12.024 [25] Chen, W., Feng, P.M., Lin, H. and Chou, K.C. (2013) iRSpot-PseDNC: Identify recombination spots with pseu- do dinucleotide composition. Nucleic Acids Research, 41, e69. http://dx.doi.org/10.1093/nar/gks1450 [26] Xu, Y., Shao, X.J., Wu, L.Y., Deng, N.Y. and Chou, K.C. (2013) iSNO-AAPair: Incorporating amino acid pairwise coupling into PseAAC for predicting cysteine S-nitrosy- lation sites in proteins. PeerJ, 1, e171. http://dx.doi.org/10.7717/peerj.171 [27] Xiao, X., Min, J.L., Wang, P. and Chou, K.C. (2013) iCDI-PseFpt: Identify the channel-drug interaction in cel- lular networking with PseAAC and molecular finger- prints. Journal of Theoretical Biology, 337C, 71-79. http://dx.doi.org/10.1016/j.jtbi.2013.08.013 [28] Xiao, X., Min, J.L., Wang, P. and Chou, K.C. (2013) iGPCR-Drug: A web server for predicting interaction be- tween GPCRs and drugs in cellular networking. PLoS One, 8, e72234. http://dx.doi.org/10.1371/journal.pone.0072234 [29] Feng, P.M., Chen, W., Lin, H. and Chou, K.C. (2013) iHSP-PseRAAAC: Identifying the heat shock protein fa- milies using pseudo reduced amino acid alphabet compo- sition. Analytical Biochemistry, 442, 118-125. http://dx.doi.org/10.1016/j.ab.2013.05.024 [30] McGuffin, L.J., Bryson, K. and Jones, D.T. (2000) The PSIPRED protein structure prediction server. Bioinfor- matics, 16, 404-405. http://dx.doi.org/10.1093/bioinformatics/16.4.404 [31] Faraggi, E., Xue, B. and Zhou, Y. (2009) Improving the prediction accuracy of residue solvent accessibility and real-value backbone torsion angles of proteins by guided- learning through a two-layer neural network. Proteins, 74, 847-856. http://dx.doi.org/10.1002/prot.22193 [32] Altschul, S.F., Madden, T.L., Schäffer, A.A., Zhang, J., Zhang, Z., et al. (1997) Gapped BLAST and PSI-BLAST: A new generation of protein database search programs. Nucleic Acids Research, 25, 3389-3402. http://dx.doi.org/10.1093/nar/25.17.3389 [33] Chou, K.C. and Zhang, C.T. (1995) Review: Prediction of protein structural classes. Critical Reviews in Bio- chemistry and Molecular Biology, 30, 275-349. http://dx.doi.org/10.3109/10409239509083488 [34] Ding, Y.S., Zhang, T.L. and Chou, K.C. (2007) Predic- tion of protein structure classes with pseudo amino acid composition and fuzzy support vector machine network. Protein & Peptide Letters, 14, 811-815. http://dx.doi.org/10.2174/092986607781483778 [35] Harihar, B. and Selvaraj, S. (2011) Analysis of rate-lim- iting long-range contacts in the folding rate of three-state and two-state Proteins. Protein and Peptide Letters, 18, 1042-1052. http://dx.doi.org/10.2174/092986611796378684 [36] Chou, K.C. and Shen, H.B. (2010) A new method for pre- dicting the subcellular localization of eukaryotic proteins with both single and multiple sites: Euk-mPLoc 2.0. PLoS One, 5, e11335. http://dx.doi.org/10.1371/journal.pone.0011335 [37] Chou, K.C. (2001) Prediction of protein cellular attributes using pseudo amino acid composition. PROTEINS: Struc- ture, Function, and Genetics, 43, 246-255. [38] Chou, K.C. (2009) REVIEW: Recent advances in devel- oping web-servers for predicting protein attributes. Cur- rent Proteomics, 6, 262-274. http://dx.doi.org/10.2174/157016409789973707 [39] Chou, K.C. (2001) Prediction of protein cellular attributes using pseudo-amino acid composition. Proteins, 43, 246- 255. http://dx.doi.org/10.1002/prot.1035 [40] Chou, K.C. (2011) iLoc-Euk: A multi-label classifier for predicting the subcellular localization of singleplex and multiplex eukaryotic proteins. Journal of Theoretical Bi- ology, 273, 236-247. http://dx.doi.org/10.1016/j.jtbi.2010.12.024 [41] Bailey, T.L., Boden, M., Buske, F.A., Frith, M., Grant, C.E., Clementi, L., Ren, J., Li, W.W. and Noble, W.S. (2009) MEME SUITE: Tools for motif discovery and searching. Nucleic Acids Research, 37, W202-W208. http://dx.doi.org/10.1093/nar/gkp335 [42] Kerthi, S.S., Shevade, S.K., Bhattacharyya, C. and Mur- phy, K.R.K. (2001) Improvements to Platt’s SMO algo- rithm for SVM classifier design. Neural Computation, 13, 637-649. http://dx.doi.org/10.1162/089976601300014493 [43] Cleary, J.G. and Trigg, L.E. (1995) K*: An instance- based learner using an entropic distance measure. Pro- ceedings of the 12th International Conference on Ma- Copyright © 2013 SciRes. OPEN ACCESS  J. F. Li et al. / J. Biomedical Science and Engineering 6 (2013) 1161-1170 Copyright © 2013 SciRes. 1170 OPEN ACCESS chine Learning, 108-114. [44] Aha, D. and Kibler, D. (1991) Instance-based learning algorithms. Machine Learning, 6, 37-66. http://dx.doi.org/10.1007/BF00153759 [45] John, G.H. and Langley, P. (1995) Estimating continuous distributions in bayesian classifiers. Proceedings of the 11th Conference on Uncertainty in Artificial Intelligence, 338-345. [46] Mizianty, M.J. and Kurgan, L.A. (2009) Modular predic- tion of protein structural classes from sequences of twi- light-zone identity with predicting sequences. BMC Bio- informatics, 10, 414. http://dx.doi.org/10.1186/1471-2105-10-414 [47] Lin, S.X. and Lapointe, J. (2013) Theoretical and experi- mental biology in one—A symposium in honour of Pro- fessor Kuo-Chen Chou’s 50th anniversary and Professor Richard Giegé’s 40th anniversary of their scientific ca- reers. Journal of Biomedical Science and Engineering, 6, 435-442. http://dx.doi.org/10.4236/jbise.2013.64054 [48] Chou, K.C. and Shen, H.B. (2009) Review: Recent ad- vances in developing web-servers for predicting protein attributes. Natural Science, 2, 63-92. http://dx.doi.org/10.4236/ns.2009.12011
|