 Vol.2, No.9, 538-553 (2013) Case Reports in Clinical Medicine http://dx.doi.org/10.4236/crcm.2013.29140 A further review of the genetic and phenotypic nature of diabetes mellitus* Graham Wilfred Ewing1#, Igor Gennadyevich Grakov2 1Montague Healthcare, Mulberry House, Nottingham, England; #Corresponding Author: graham.ewing@montague-diagnostics.co.uk, graham.ewing@montaguehealthcare.co.uk 2MIMEX Inc, Sochi, Russia Received 21 June 2013; revised 20 July 2013; accepted 16 August 2013 Copyright © 2013 Graham Wilfred Ewing, Igor Gennadyevich Grakov. This is an open access article distributed under the Creative Commons Attribution License, which permits unrestricted use, distribution, and reproduction in any medium, provided the original work is properly cited. In accordance of the Creative Commons Attribution License all Copyrights © 2013 are reserved for SCIRP and the owner of the intellectual property Graham Wilfred Ewing, Igor Gennadyevich Grakov. All Copyright © 2013 are guarded by law and by SCIRP as a guardian. ABSTRACT Background: The organs in the body function in coherent organ net works. These organ net works are commonly know n as physiological systems. Blood Glucose, Blood Pressure and pH exhibit the characteristics of neurally regulated Phy- siological Systems. Any medical condition, such as diabetes, has origins which are due to sys- temic dysfunction. This influences the genetic expression of proteins and the rate at which such expressed proteins subsequently react. Increased levels of acidity influence the levels of available minerals, protein conformation, and hence the rate at which expressed pr oteins such as insulin and leptin react or function. This is particularly significant in diabetes etiology where a deficiency of insulin and insulin-“re- sistance” are significant features of type 1 and type 2 diabetes. Proteins such as Insulin absorb and emit light. Moreover, the spectrum and in- tensity of the bioluminescence emitted from glycated proteins (which are more significantly bioluminescent) influence colour perception. Accordingly, changes to the diabetic’s colour perception can be used as the basis of a cogni- tive screening technique which is able to quan- tify the influence of genotype and phenotype. This may have significant advantages over cur- rent biomarker techniques which are not able to satisfactorily determine the earliest onset of diabetes or distinguish between the sympto- matic and presymptomatic onset of diabetes. Such methodology, based upon the properties of proteins, i.e. effectively, the rate at which pro- teins are expressed and the rate at which such expressed proteins subsequently react, allows the clinician to quantify genotype and pheno- type and may contribute to a greater under- standing of the processes responsible for what are commonly known as type 1 and type 2 dia- betes. The aim of this article is to highlight the limitations of the current techniques used to diagnose diabetes and to highlight, at least from the theoretical perspective, the significance of the autonomic nervous system and physiologi- cal systems; in particular, how changes to col- our perception are related to the function and/or stability of the autonomic nervous system; and how such phenomena can be used diagnosti- cally. This article discusses this method—a mathematical model of the autonomic nervous system and physiological systems—which has been incorporated into the proto type technology Virtual Scanning; and in conclusion, illustrates how Diabetes appears to be a problem of acidity and consequently of mineral deficiency. It out- lines how genotype and phenotype are both significant factors in the regulation of Blood Glucose, i.e. type 1 diabetes is predominantly genetic and is associated with hypoglycaemia whilst type 2 diabetes is due to env ironmental or phenotypic cause and is associated with hyper- glycaemia. Both can occur simultaneously and hence explain why someone with type 2 diabe- tes may be prescribed insulin, i.e. in order to quantify the extent of a pathology such as dia- *Funding Source: privately funded. Conflict of Interest Disclosure: Graham Ewing is a Director of Monta- gue Healthcare, a company devoted to the co mmercialisation of Virtual Scanning technology. Dr Igor Gennadyevich Grakov is the developer o this technology. Copyright © 2013 SciRes. OPEN ACCESS  G. W. Ewing, I. G. Grakov / Case Reports in Clinical Medicine 2 (2013) 538-553 539 betes mellitus and/or any other common patho- logy, it appears necessary to quantify the influ- ence of genotype (genetic capacity) and pheno- type (physiological demand). Accordingly the categorisation of diabetes as type 1 and type 2 may be misleading. Keywords: Autonomic Nervous System (ANS); Physiological Systems; Mathematical Mo delling; Blood Glucose; Diabetes; Genotype; Phenotype; Sensory Input; Visual Perception; Colour Perception 1. INTRODUCTION There is nothing in the body’s function which cannot be explained by anything other than biochemistry and/or the innate properties of biochemicals or biological sys- tems [1]. 1.1. The Concept of Neuroregulation The human physiology exh ibits the characteristics of a neurally regulated system of an extraordinary level of precise control, i.e. between homeostatic limits which we recognise as hyper- and hypo-function. Systems or func- tions which under normal conditio ns are regulated within clearly defined limits include: the levels of water, body temperature, blood pressure, the intake of food and eli- mination of wastes, respiration, osmotic pressure, acidity, blood glucose, blood volume, blood cell content, muscu- loskeletal system and sleep. This system of regulation involves the autonomic nervous system and the network of organs in each of the physiological systems. Most sen- sory and visceral organs and related muscle groups are influenced by the function of the autonomic nervous sys- tem e.g. stress and depression influence the visual field, visual contrast, colour perception, heart function, etc. 1.2. The Mechanisms Which Determine the Influence of Sensory Input upon Cellular & Molecular Biology Sensory input, in particular visual percep tion, is linked to the stability or instability of the autonomic nervous system (ANS) [2]. It influences the ANS and is con- verted into electrochemical signals which, when exceed- ing the body’s innate regulatory mechanism and which we recognise as “homeostasis”, influences cellular and molecular biology. There is not yet an accepted mecha- nism which explains this link between sensory input and cellular & molecular biology although it is widely reco g- nised that i) sensory input influences the autonomic nervous system and ii) autonomic dysfunction influ- ences visceral and sensory function. Accordingly, any explanation for changes to cellular and molecular boil- ogy must take into account the mechanisms and struc- tures which regulate the function of the cells and associ- ated organs. Moreover, as the visceral organs are organ- ised in discreet organ networks (physiological systems) which perform a physiologically significant function, it becomes evident that the ANS and physiological systems must work in a coherent manner regulating key physio- logical functions e.g. blood pressure [3], blood glucose [4], pH [5], sleep [6], posture, temperature, digestion, urination, etc. The original definition of physiological systems has been quietly refined by medical researchers, i.e. there are 13 neurally regulated physiolog ical systems which are responsible for all aspects of the body’s func- tion [6]. 1.3. The Limitations of Biomarkers As blood glucose is a neurally regulated system [4], which acts in synchrony with the other neurally regulated physiological systems, single biomarkers cannot there- fore be a precise measure of the diabetic state and will be accompanied by a range of inherent limitations e.g. car- diovascular disease(s), chronic kidney disease, etc. The results will be influenced by adjacent systems and sys- temic dysfunction, i.e. emergent pathologies in different organs [7]. For example, PoC blood glucose tests have a 20% deviation limit as per ISO15197. Known adverse influences include varying haematocrit levels, oxygen, pH, RBC level, non-glucose sugars, photometric inter- ferences, etc. In addition, any diagnostic indicator must take into account the influence of both genetic and envi- ronmental factors. This illustrates that biomarker type tests suffer from a range of inherent limitations which prevent them being precise measures of any medical conditio n e.g. i) there is difficulty distinguishing between a healthy patient and someone with earliest onset of the condition; ii) many pathologies have complex mu lti-systemic origins; iii) the processes responsible for the onset of disease, in par- ticular of the life-style related pathologies, often remain poorly defined; iv) there may be several pathologies which are implicated in a particular medical condition; v) the condition may have sensory/stress-related origins; etc. 2. DIAGNOSING DIABETES Diabetes is a condition which has defied the ability of many researchers to develop a precise method of deter- mining the earliest onset of the condition, tracking its subsequent development, and u ltimately its manifestation as obesity and/or other secondary complications. Genetic screening defines the genes which influence the expression of diabetic proteins, in particular of pre- pro-insulin/pro-insulin the precursors of insulin, yet this Copyright © 2013 SciRes. OPEN ACCESS  G. W. Ewing, I. G. Grakov / Case Reports in Clinical Medicine 2 (2013) 538-553 540 overlooks that changes to the genetic structures are the inevitable consequence of environmental factors (phe- notype) e.g. lack of exercise, poor diet, the consumption of acidified and/or alcoholic beverages, lack of sleep, etc [8]. The genetic profile which influences protein expres- sion in the type 1 diabetic, in particular the levels of in- sulin, alters according to racial subtype [9,10], the onset of viruses [11,12], vaccine schedules [13-17], and the influence of stress [18]. Moreover, exercise can reverse genetic changes [19] in the type 2 diabetic. Accordingly, it lacks scientific rigor to focus solely upon geno type and disregard the very significant influence of phenotype. The issue is not which genes are involved in regulating blood glucose (and/or any other condition), because these can differ according to circumstances, but instead what are the mechanisms which influence i) changes to genetic structure and/or conformation; ii) the levels of proteins, in particular insulin, which are expressed by the genes; and iii) how these expressed proteins subse- quently react in the cellular environment e.g. insulin in its uncoiled and unreactive form is no longer able to perform its biochemical/cellular function. The accepted explanation for type 1 diabetes is that the body’s immune system attacks the pancreatic beta cells and hence influen ce the genetic expression of the insulin precursor and ultimately the lev el of insulin ; however the fact that viruses [11,12], vaccines [13-17] and racial dif- ferences [9,10] are associated with the onset of type 1 diabetes indicates that the problem is associated with the genetic profile. Changes to the genetic structure will steadily decrease (or increase) the expression of the insu- lin precursor. The presence of a virus or virus-like parti- cles, and the altered spectrum of metabolites, will inevi- tably stimulate an autoimmune response. The accepted explanation for type 2 diabetes is that it is a metabolic disorder which is characterised by high levels of blood glucose which cannot be satisfactorily metabolised by insulin i.e. that insulin is ‘resistant’ and hence can no longer perform its cellular function of fa- cilitating the passage of g lucose into the cell where it can react with hexokinase. The only logical explanation for this ‘resistance’ is that the insulin can no longer react with its substrate. If so, what are the biological factors which may be responsible for such dysfunction? 2.1. Fasting Glucose and Oral Glucose Tolerance The current tests for diabetes: mainly Fasting Glucose (FG), Oral Glucose Tolerance (OGTT), and HbA1c; al- low the clinician to assess the prevalence of the cond ition however such tests lack precision and specificity. Al- though such tests are used widely and are the recognised ways of determining the onset of diabetes they do not consider the need to characterise a disease in terms of its basic constituents i.e. of insulin expressed (genotype) and the rate at which the insulin reacts and/or performs its cellular function (non-genetic/phenotype). They do not enable the clinician to determine the onset of the disease from its presymptomatic origins or to satisfacto- rily distinguish between the diabetic and non-diabetic states. The number of people with diabetes continues to rise therefore the basic understanding of the condition, the ways to reduce the number of people with diabetes and better diagnose and manag e the cond ition, n eed to be improved. 2.2. Glycated Haemoglobin The earlier diabetic tests which determine glucose metabolism have been largely superceded by the HbA1c test. It illustrates an essential principle i.e. the need to measure protein levels, in this case haemoglobin, in ad- dition to the prevailing lev el of glycation. This illustrates that measurement of both the level of key proteins (genotype) and their rate of reaction (phenotype) is sig- nificant. Such test is based upon the assumption that haemoglobin is an appropriate protein and that glycated haemoglobin can be used as an accurate measure of the degree of onset of the diabetic process yet haemoglobin plays little or no part in diabetes etiology! It is an indirect marker. Although insulin and/or glycated insulin would appe ar to be a mor e appropr iate ma r k e r th ere is no r e cor d of it having been evaluated. The HbA1c test suffers from a number of inherent limitations e.g. i) it is not adequately able to determine the onset of diabetes at an early stage i.e. distinguishing between a healthy patent and a diabetic; ii) it is insufficiently sensitive. The test confirms the symptomatic onset of the condition and is unable to monitor the development of the condition from its earli- est presymptomatic onset. iii) a number of known interferences e.g. associated with iron metabolism, pH, Red Blood Cell Count, etc; iv) the measurement of upper levels of HbA1c may have inaccuracies i.e. the rate of degradation of HbA1c will vary according to circumstances. It cannot continue to rise indefinitely; v) test results may vary between clinicians and or- ganisations; vi) the limits can be expected to differ between racial subtypes, age, and gender; vii) diabetes has genetic and phenotypic characteris- tics [51]. 2.3. The Significance of Changes to Colour Perception The measurement of glycated proteins is intriguing because glycated proteins e.g. albumin, LDL cholesterol, Copyright © 2013 SciRes. OPEN ACCESS  G. W. Ewing, I. G. Grakov / Case Reports in Clinical Medicine 2 (2013) 538-553 541 insulin and haemoglobin; are visually active i.e. they absorb and emit light (see Figure 1). This phenomenon has been commercially adapted. Techniques to measure the bioluminescence of body flu- ids e.g. of the skin, blood or eye; have been patented and/or developed as a means of diagnosing diabetes. The spectrum and intensity of this bioluminescence serves as a biomarker of protein expression and the rate at which proteins subsequently react [20]. It is a phenomena which is consistent with reaction kinetics. Altered perception of colour is a widely recognised phenomena and is associated with the emergence of most pathologies and is also a noted side-effect of medication i.e. all changes to the body’s physiology, all emergent pathologies, and all drugs are linked to changes of colour perception. It is not unique to diabetes. This phenomena is widely studied and used in syntonic optometry, op- tometry (orthoscopics), diabetic retinopathy, and other specialist areas of medical research. There have been patented techniques which have sought, unsuccessfully, to use this basic phenomena in medical devices to diag- nose the onset or regression of diabetes. Until recently this altered colour perception [21] in the diabetic patient was considered to be due to diabetic retinopathy al- though there is not a substantiated scientific justification for this conclusion. More recent articles have illustrated that such changes to colour perception in the diabetic occur prior to the onset of diabetic retinopathy [22-25] however changes to colour perception must have a bio- chemical basis. There can be no other explanation. If such changes occur before the onset of diabetic reti- nopathy it is probable that it occurs from the earliest on- set of the diabetic condition. Many, if not all, proteins are known to be visually ac- tive. Often protein analogues and metabolites e.g. the glycated forms of insulin, haemoglobin, albumin, LDL Cholesterol, etc; will have greater bioluminescence than the base protein. Accordingly any influences upon pro- tein function e.g. by drugs, medication, impaired func- tion or disease; will influence protein function and, ulti- mately, their bioluminescence and the diabetic’s colour perception. Any and every biochemical change or pa- thology which influences the genetic expression of op- sins [26] or their biochemical function must directly or indirectly influence colour perception to some extent i.e. there must be secondary influences upon visual percep- tion which have pathological origins. Such changes to colour perception can serve as a biomarker for the condi- tion. Note 1: Light influences the function of a wide range Figure 1. Light absorbing and emitting properties of proteins. of biochemicals and biological systems [20] e.g. it stimu- lates the release of nitric oxide (NO) [27-31] which is essential for smooth muscle function in the endothelium. Significantly, impaired NO metabolism is implicated in atherosclerosis, hypertension and diabetes. Note 2: Lig ht infl uences t he prod uction of th e horm one calcipotriol which is essential for immune function and hence is vital to prevent the passage of viruses into the body. A technique which is based upon the emission of light has to overcome problems of interference which arise from the light being absorbed and emitted by other pro- teins. The eye uses lutein and zeaxanthin to absorb UV light therefore there is a precedent. Nevertheless such a technique faces problems of standardisation. This illus- trates the problems faced by researchers as they seek to develop a test which measures colour perception. This problem has been overcome by using mathematical modelling and a form of pattern recognition [2] which incorporates an understanding of how the func tion of the ANS includes that of the various organ networks/phy- siological systems. See examples 1 - 3. Note 3: In the example reports, 0 - 9 units is at the pre- symptomatic level whilst 10 units and above is at the symptomatic level. 3. DIABETES IS A MULTI-SYSTEMIC DISORDER The brain seeks to maintain the neural stability of the physiological systems. It adopts a best-fit system which, when faced with emergent pathologies or altered genetic structure, seeks to optimise the body’s stability. Every aspect of the body’s adaptivity, regulation and function leads to physiological changes i.e. increased predisposi- tion to the condition. Accordingly instability in any sin- gle physiological system will inevitably lead to instabil- ity in one or more adjacent physiological systems e.g. lack of sleep (system: sleep); excess salt (system: os- motic pressure); inadequ ate levels of respiration (system: breathing); excessive acidity and excessive/instability in elimination, in particular of urine (system: pH); blood pressure; each contribute to the onset of diabetes [1, 3-5,32]. The Significance of Acidity The regulation of acid/base stability i.e. of pH, and its significance in chemical reactions is the most basic as- pect of chemistry yet this is often completely disreg arded in biochemical research. The neural regulation pH influ- ences the function of most, if not all, proteins and en- zymes. It is a significant factor in diabetes etiology [32] e.g. increased acidity alters the prevailing red ox state and level of minerals. The acid salts of calcium, magnesium Copyright © 2013 SciRes. OPEN ACCESS  G. W. Ewing, I. G. Grakov / Case Reports in Clinical Medicine 2 (2013) 538-553 542 and other minerals have low solubility. Such changes to acidity are the inevitable consequence of lack of exercise (the elimination of CO2 which exists in the body as car- bonic acid), a protein rich diet, low consumption of vegetables, increased levels of lipids and fatty acids, and the consumption of acidic and alcoholic beverages. For example i) the consumption of two 500mls cans of a Cola drink (pH 3.5 - 4.0), which contains phosphoric acid, carries an estimated 1000 - 3000 times more acidity than the body is designed to handle each day, and ii) a few beers (est pH 4.5) each evening carries an estimated 500 - 1000 times more acidity than the body routinely handles each day. Moreover ethyl alcohol is metabolised into acetic acid which effectively doubles the exposure to acidity! Under acid conditions minerals react to form insoluble salts which are eliminated from the body. Consequently, the prevailing levels of Magnesium, Calcium, Zinc and Chromium are no longer sufficient to sustain the fu nction and reactivity of insulin – this is known as insulin resis- tance i.e. insulin is present but is no long er available in a reactive form and/or in an environment which can sus- tain its function. This is supported by the following: Magnesium is required by chaperonin enzymes, in- cluding telomerase, in order to prevent the misfolding or uncoiling of proteins and prevent their aggregation. Magnesium is required to support the function of transcriptome enzymes and hence the genetic expres- sion of the insulin precursor. Chromium is necessary to sustain the function of the GLUT4 transporter protein in muscle walls. Magnesium, chromium, and zinc deficits are associ- ated with diabetes [32], cardiovascular disease, etc. Increased acidity reduces the availability of calcium which is essential for the metabolism of nitric oxide synthase. Moreover impaired nitric oxide synthase activity is associated with insulin resistance [33]. Cola consumption, and hence of phosphoric acid, is linked to the occurence of osteoporosis [34] and the leaching of magnesium from the bones. In the obese and therefore associated with the diabetic [35], leptin resistance is due to biochemical factors which influence the ability of leptin to react or other- wise perform its physiological function i.e. to com- municate feelings of satedness following a meal and hence reduce appetite [36]. The conversion of glucose to triglycerides is en- hanced by acidic conditions, in particular by higher levels of acidity, and is linked to leptin resistance. This can be the result of lack of physical activity, a protein-rich diet, stress or intake of acidic and alco- holic drinks [32] e.g. higher levels of acidity trigger the activity of isoenzymes which metabolise alcohol into acetaldehyde and acetic acid, alters lipid metabo- lism and contributes to obesity [37]. The consumption of Fructose [38] is also associated with higher levels of triglycerides, leptin resistance and contributes to the increased acidity, devitaminisa- tion and demineralisation which is associated with consumption of sugars and acidified drinks i.e. failure to satisfy cellular requirements for glucose. Zinc atoms may initiate glucagon secretion during hypoglycemia [39], i.e. there is an interactive mecha- nism involving the alpha and beta cells in the pan- creas which facilitates the release glucagon and insu- lin resp. The leaching of magnesium from the bones reduces the degree to which the tendons, and ligaments ad- here to the bone and influences the physiology of the joints. The precipitation of the zinc hexamer is pH dependent. Whereas at neutral pH insulin is complexed in a zinc hexamer [40], stored in readiness to metabolise excess blood glucose (typically following a meal), and released as a coiled and reactive protein every 6 minute cycle [41]; by contrast, in the acidic environment, insulin is less coiled and less reactive, th ere is less zinc and magnesium e.g. to support the function of the chaperonin enzymes; there are lower levels of vitamins and/or cofactors. The conditions do not favour the precipitation of the zinc hexamer; pancreatic reserves of the zinc hexamer decline, and the 6 minute cyclic controlled release of insulin is destabilised and is o ften extended to 15 minutes or more i.e. the cellular environment does not support the func- tion of insulin. In such acidic environment insulin (a highly bioactive protein with a half life of 4 - 6 minutes) circulates readily in both its coiled and uncoiled states, facilitates the metabolism of blood glucose to triglyc- erides, and leads to lower levels of blood glucose and persistent hunger. The normal cyclic regulation of levels of blood glucose is destabilised, the frequency and am- plitude of insulin secretion is reduced [42] and the level of insulin, which is genetically expressed, is reduced [43]. Consequently, at higher levels of acidity the body be- comes increasingly less able to cope with high levels of blood glucose. It influences both genotype and pheno- type. This is particularly evident in the elderly [41] who exhibit a natural form of diabetes as a consequence of the aging process i.e. when they are no longer able to gener- ate sufficient insulin and/or do not have the musculature to adequately metabo lise blood glucose. Increased acidity lowers the levels of minerals which are essential if adequate levels of immune fun ction are to be maintained and hence resist the ingress of viruses [44,45]. The consumption of alcoholic and acidic beverages is associated with the formation of free radicals which ul- timately damage the cellular structure of the pancreas, Copyright © 2013 SciRes. OPEN ACCESS  G. W. Ewing, I. G. Grakov / Case Reports in Clinical Medicine 2 (2013) 538-553 543 often observed as Pancreatitis [46], influences intercel- lular communication between alpha and beta cells, and ultimately results in the formation of visually active gly- cated species [47] derived from proteins, glucose, nucleic acids, and lipids. These processes contribute to eye disease [48], circu- latory problems, pulmonary fibrosis, neurodegenerative processes, premature ageing, urinary incontinence, fatty liver disease, osteoporosis, postural problems, etc. In addition, the lack of essential minerals (which are the consequence of increased acidity) and increased blood viscosity suppresses the fun ction of the heart and its abil- ity to deliver oxygenated blood to the neural tissues and ultimately leads to the onset of migraines and cardiovas- cular problems e.g. cardiac arrhythmia, cardiac insuffi- ciency, hypertension, etc. Stress influences the stability of the ANS, in particular the sympathetic nervous system which is associated with the release of adrenaline, norepinephrine and glucocorti- coids. Excessive release of glucocorticoids suppresses the genetic expression of pro-insulin [18]. The influence of stress can destabilise the function of the digestive sys- tem leading to the release of acidity into the oesophagus and duodenum whilst relief from stress reduces gastric reflux [49,50]. Stress inhibits normal respiration and raises the levels of CO2 and acidity in the blood [51]. 4. GENOTYPE AND PHENOTYPE There are two main issues of significance in the etiol- ogy of any disease: i) the expression of proteins (in par- ticular of pro-insulin in the case of diabetes) and ii) the influence of the environment i.e. the rate at which ex- pressed proteins subsequently react or perform their phy- siological function. These are more typically known as genotype and phenotype [52]. Acidity and temperature are known factors which, indirectly, influence the degree of protein coiling. In particular, increased levels of acid- ity decreases the prevailing levels of zinc, calcium, mag- nesium, selenium, chromium, etc. This influences protein and enzyme conformation and hence the rate at which expressed proteins react or otherwise function. This is especially significant when considering the categorisa- tion and nomenclature of diabetes mellitus. Type 1 dia- betes is associated with the lack of insulin whilst type 2 diabetes is associated with the inability of insulin to per- form its function i.e. insulin-resistance. Moreover it highlights the difficulty of diagnosing diabetes e.g. (i) a patient with lowered levels of insulin and also of insulin resistance will have manifestations which are typical of type 1 and type 2 diabetes i.e. the type 2 diabetic may require insulin; (ii) an elderly person with naturally de- clining levels of insulin could be diagnosed as diabetic yet their dietary requirements and metabolic rate are such that they do not require an insulin supplement i.e. context is significant; iii) a person drinking large quantities of acidic colas or alcoholic beverages (which are metabo- lised into acetic acid) often increases weight prior to de- veloping type 2 diabetes; iv) in many the condition can often be managed by having smaller meals and lowering the levels of carbohydrate consumed; v) patients often require significantly different dosage regimes; vi) an athlete would consume far greater amounts of carbohy- drates and would require greater amounts of insulin, perhaps at a level which is beyond the capacity of their pancreas; vii) a drug addict may have wildly fluctuating blood glucose levels. Their lifestyles will determine to what extent they require insulin i.e. they experience the symptoms of diabetes (or any other pathology) if their functional requirement at any particular moment exceeds their genetic and structural supply e.g. i) when physical effort exceeds the functional abilities of the pectoral muscles in angina pectoris and of what we now know to be the myocardium, and ii) when the glucose demand cannot be matched by the availability of insulin (T1) or the supply and/or reactivity of the available insulin (T2). This lack of insulin or its unreactivity in th e form of ‘in- sulin resistance’ leads to vascular damage [53] and hence to the onset of diabetic complications. It explains the alternative terms “insulin-dependent diabetes mellitus (IDDM)” and “non-insulin dependent diabetes mellitus (NIDDM)”. Note 4: If insulin has a half-life of 4 - 6 minutes and 50% of insulin is removed from plasma in its first pas- sage through the liver then 99% of this insulin supple- ment would be unavailable within one hour however a significant proportion of this insulin supplement re-en- ters circulation e.g. from the liver, kidneys and muscula- ture; and may remain available for up to one additional hour [54-57]. Nevertheless if a patient with type 1 diabe- tes requires an injection of insulin typically around each mealtime this indicates that their ability to produce insu- lin in the pancreas is merely deficient and is not due to the complete failure of the pancreatic beta cells. If their condition was such that their pancreatic beta cells were no longer able to produce insulin in any amount they would require insulin supplements irrespective of the prevailing circumstances and far earlier than the 4 - 6 hours gap between meals. 5. RESULTS Example 1 illustrates the full scope of Virtual Scan- ning and, in particular, the ability to screen for the onset of pathologies in each organ. In relation to dia- betes it illustrates the example of a patient with 12 units genotype and 10 units phenotype i.e. the patient has the symptomatic manifestations of both type 1 and type 2 diabetes. The results are above the 9 units limit which differentiates between presymptomatic Copyright © 2013 SciRes. OPEN ACCESS  G. W. Ewing, I. G. Grakov / Case Reports in Clinical Medicine 2 (2013) 538-553 544 and symptomatic. It also illustrates the emergence of circulatory problems i.e. of Phlebitis and Thrombo- phlebitis (11 genotype/22 phenotype) at a significant level. The abbreviated Example 2 illustrates the type 2 dia- betic (22 units) and the presymptomatic onset of type 1 diabetes (6 units). Th e results illustrates that the pa- tient is genetically susceptible to Ischemic Heart Disease, Cardiac Infarction, Myocardial Dystrophy & Myocarditis. The abbreviated Example 3 illustrates the type 2 dia- betic (17 units). 6. CONCLUSIONS The neural regulation of Blood Glucose is influenced by a number of factors which influence i) the amount of protein which is genetically expressed, and ii) the rate at which the expressed protein insulin, reacts and/or per- forms its cellular & biochemical function. These are more typically known as genotype and phenotype. Phe- notype was previously known as “the influence of the environment”. However, it is suggested that such “envi- ronmental influences” or non-genetic “lifestyle factors” are those which influence the function of the autonomic nervous system, physiological systems, and which ulti- mately influence cellular and molecular biology e.g. pH, temperature, etc. This article supports earlier articles of the author which highlight the need to take into consideration the very considerable effect, acidity, in particular, has upon the etiology of diabetes. Diabetes Mellitus, irrespective of its type, is fundamentally a problem of acidity. Higher than normal levels of acidity reduce the levels of miner- als which are essential for the metabolism of enzymes which regulate blood glucose and sustain the normal function of key signalling protein insulin and leptin. It conceivably explains what is “insulin resistance” and “leptin resistance”, and hence why appetite and satiety are disrupted in the diabetic. Diabetes is a problem of genotype AND phenotype, i.e. lower levels of protein expression (insulin), and lack of protein reactivity and/or ability of the protein to carry out its b iochemical fun ctio n to facilitate the passage of glucose through the cell membrane. It explains why a patient with type 2 diabetes may often require insulin supplementation. This is partially recognised through the adoptio n of th e HbA1c test which arguably measures the level of protein and also its rate of glycation. This principle has been further developed by a light-based tech nique as outlined, i.e. which is based upon the light emitting properties of proteins [20] and which is able to provide a broad-spec- trum assessment of the pathologies influencing the con- dition and function of all visceral and sensory organs. Such a light-based technique may represent a better way of i) screening for the earliest onset of the condition i.e. from its presymptomatic origins; ii) determining the ge- netic AND phenotypic ch aracter of the patien t’s diabetes; and iii) identifying the onset of various secondary dia- betic complications. 7. ACKNOWLEDGEMENTS We thank many excellent researchers who, through their work, have indirectly contributed to this article. REFERENCES [1] Ewing, G.W. (2009) Does an improved understanding of the nature and structure of the Physiological Systems lead to a better understanding of the therapeutic scope of Complementary & Conventional Medicine? Journal of Computer Science and Systems Biology, 2, 174-179. [2] Ewing, G.W. and Ewing, E.N. (2008) Cognition, the auto- nomic nervous system and the physiological systems. Biogenic Amines, 22, 140-163. [3] Ewing, G.W. (2010) Mathematical modeling the neuro- regulation of blood pressure using a cognitive top-down approach. North American Journal of Medical Sciences, 2, 341-352. [4] Ewing, G.W. and Parvez, S.H. (2011) Mathematical mod- eling the systemic regulation of blood glucose: A top- down systems biology approach. NeuroEndocrine Letters, 32, 371-379. [5] Ewing, G.W. (2012) The regulation of pH is a physiolo- gical system. Increased acidity alters protein conforma- tion and cell morphology and is a significant factor in the onset of diabetes and other common pathologies. The Open Systems Biology Journal, 5, 1-12. http://dx.doi.org/10.2174/1876392801205010001 [6] Ewing, G.W. (2009) A theoretical framework for photo- sensitivity: Evidence of systemic regulation. Journal of Computer Science and System Biology, 2, 287-297. http://dx.doi.org/10.4172/jcsb.1000044 [7] Ewing, G.W. and Parvez, S.H. (2010) The dynamic rela- tionship between cognition, the physiological systems, and cellular and molecular biochemistry: A systems- based perspective on the processes of pathology. Activitas Nervosa Superior Rediviva, 52, 29-36. [8] Ewing, G.W. and Ewing, E.N. (2008) Neuroregulation of the physiological systems by the autonomic nervous sys- tem: Their relationship to insulin resistance and metabolic syndrome. Biogenic Amines, 22, 208-239. [9] Sim, X., Ong, RT.-H., Suo, C., Tay, W.-T., Liu, J., et al. (2011) Transferability of type 2 diabetes implicated loci in multi-ethnic cohorts from southeast Asia. PLOS Gene- tic, 7, e1001363. http://dx.doi.org/10.1371/journal.pgen.1001363 [10] Bodhini, D., Radha, V., Ghosh, S., Majumder, P. and Mo- han, V. (2011) Lack of association of PTPN1 gene poly- morphisms with type 2 diabetes in south Indians. Journal of Genetics, 90,323-326. http://dx.doi.org/10.1007/s12041-011-0060-3 Copyright © 2013 SciRes. OPEN ACCESS  G. W. Ewing, I. G. Grakov / Case Reports in Clinical Medicine 2 (2013) 538-553 545 [11] Wagenknecht, L.E., Roseman, J.M. and Herman, W.H. (1991) Increased incidence of insulin-dependent diabetes mellitus following an epidemic of Coxsackievirus B5. American Journal of Epidemiology, 133, 1024-1031. [12] Helmke, K., Otten, A., Willems, W.R., et al. (1986) Islet cell antibodies and the development of diabetes mellitus in relation to mumps infection and mumps vaccination. Diabetologia, 29, 30-33. http://dx.doi.org/10.1007/BF02427277 [13] Tuomilehto, J., Rewers, M., Reunanen, A., et al. (1991) Increasing trend in type 1 (insulin-dependent)diabetes mellitus in childhood in Finland. Analysis of age, calen- dar time and birth cohort effects during 1965 to 1984. Diabetologia, 34, 282-287. http://dx.doi.org/10.1007/BF00405089 [14] Kelly, H.A., Russel, M.T., Jones, T.W. and Byrne, G.C. (1994) Dramatic increase in incidence of insulin depend- ent diabetes mellitus in Western Australia. Medical Jour- nal of Australia, 161, 426-429. [15] Rewers, M., LaPorte, R.E., Walczak, M., Dmochowski, K. and Bogaczynska, E. (1987) Apparent epidemic of insu- lin-dependent diabetes mellitus in Midwestern Poland. Diabetes, 36, 106-113. http://dx.doi.org/10.2337/diab.36.1.106 [16] Toth, E.L., Lee, K.C., Couch, R.M. and Martin, L.E. (1997) High incidence of IDDM over 6 years in Edmon- ton, Alberta, Canada. Diabetes Care, 20, 311-313. http://dx.doi.org/10.2337/diacare.20.3.311 [17] Blom, L., Nystrom, L. and Dahlquist, G. (1991) The Swe- dish childhood diabetes study: Vaccinations and infec- tions as risk determinants for diabetes in childhood. Dia- betologia, 34, 176-181. http://dx.doi.org/10.1007/BF00418272 [18] Jang, W.G., Kim, E.J., Park, K.G., Park, Y.B., Choi, H.S., Kim, H.J., Kim, Y.D. , Kim, K.S., Lee, K.U. and Lee, I.K. (2007) Glucocorticoid receptor mediated repression of human insulin gene expression is regulated by PGC-1al- pha. Biochemical and Biophysical Research Communi- cations, 352, 716-721. http://dx.doi.org/10.1016/j.bbrc.2006.11.074 [19] Booth, F.W., Chakravarthy, M. and Spangenburg, E.E. (2002) Exercise and gene expression: Physiological regu- lation of the human genome through physical activity. Journal of Physiology, 543, 399-411. http://dx.doi.org/10.1113/jphysiol.2002.019265 [20] Ewing, G.W., Parvez, S.H. and Grakov, I.G. (2011) Fur- ther observations on visual perception: The influence of pathologies upon the absorption of light and emission of bioluminescence. The Open Systems Biology Journal, 4, 1-7. http://dx.doi.org/10.2174/1876392801104010001 [21] Daley, M.L., Watzke, R.C. and Riddle, M.C. (1987) Early loss of blue-sensitive color vision in patients with type I diabetes. Diabetes Care, 10, 777-781. http://dx.doi.org/10.2337/diacare.10.6.777 [22] Kurtenbacha, A., Schiefera, U., Neub, A. and Zrennera, E. (1999) Preretinopic changes in the colour vision of ju- venile diabetics. British Journal of Ophthalmology, 83, 43-46. http://dx.doi.org/10.1136/bjo.83.1.43 [23] Beisswenger, P.J., Makita, Z., Curphey, T.J., Moore, L.L., Jean, S., Brinck-Johnsen, T., Bucala, R. and Vlassara, H. (1995) Formation of immunochemical advanced glycosy- lation end products precedes and correlates with early manifestations of renal and retinal disease in diabetes. Diabetes, 44, 824-829. http://dx.doi.org/10.2337/diab.44.7.824 [24] Hardy, K.J., Lipton, J., Scase, M.O., Foster, D.H. and Scarpello, J.H. (1992) Detection of colour vision abnor- malities in uncomplicated type 1 diabetic patients with angiographically normal retinas. British Journal of Oph- thalmology, 76, 461. http://dx.doi.org/10.1136/bjo.76.8.461 [25] Ismail, G.M. and Whitaker, D. (1998) Early detection of changes in visual function in diabetes mellitus. Ophthal- mic and Physiological Optics, 18, 3. http://dx.doi.org/10.1016/S0275-5408(97)00043-4 [26] Wald, G. (1967) George Wald Nobel prize lecture. In: Nobel Lectures, Physiology or Medicine 2963-1970, El- sevier Publishing Company, Amsterdam. http://www.nobelprize.org/nobel_prizes/medicine/laureat es/1967/ [27] Sortino, S. (2010) Light-controlled nitric oxide delivering molecular assemblies. Chemical Society Reviews, 39, 2903-2913. http://dx.doi.org/10.1039/b908663n [28] Venturini, C.M., Palmer, R.M. and Moncada, S. (1993) Vascular smooth muscle contains a depletable store of a vasodilator which is light-activated and restored by donors of nitric oxide. Journal of Pharmacology and Experimental Therapeutics, 266, 1497-1500. [29] Nagase, S., Hirayama, A., Ueda, A., Oteki, T., Takada, K., Inoue, M., Shimozawa, Y., Terao, J. and Koyama, A. (2005) Light-shielded hemodialysis prevents hypotension and lipid peroxidation by inhibiting nitric oxide produc- tion. Clinical Chemistry, 51, 2397-2398. http://dx.doi.org/10.1373/clinchem.2005.058669 [30] Furchgott, R.F. and Jothianandan, D. (1991) Endothelium- dependent and -independent vasodilation involving cyclic GMP: Relaxation induced by nitric oxide, carbon mono- xide and light. Blood Vessels, 28, 52-61. [31] Oren, D.A. (1996) Humoral phototransduction: Blood is a messenger. Neuroscientist, 2, 207-210. http://dx.doi.org/10.1177/107385849600200408 [32] Ewing, G.W. (2012) The regulation of pH is a physiolo- gical system. Increased acidity alters protein conforma- tion and cell morphology and is a significant factor in the onset of diabetes and other common pathologies. The Open Systems Biology Journal, 5, 1-12. http://dx.doi.org/10.2174/1876392801205010001 [33] Kashyap, S.R., Roman, L.J., Lamont, J., Masters, B.S.S., Bajaj, M., Suraamornkul, S., Belfort, R., Berria, R., Kel- logg, D.L., Liu, Y. and DeFronzo, R.A. (2005) Insulin re- sistance is associated with impaired nitric oxide synthase activity in skeletal muscle of type 2 diabetic subjects. Journal of Clinical Endocrinology & Metabolism, 90, 1100-1105. http://dx.doi.org/10.1210/jc.2004-0745 [34] Tucker, K.L., Morita, K., Qiao, N., Hannan, M.T., Cup- ples, L.A. and Kiel, D.P. (2006) Colas, but not other car- bonated beverages, are associated with low bone mineral density in older women: The framingham osteoporosis Copyright © 2013 SciRes. OPEN ACCESS  G. W. Ewing, I. G. Grakov / Case Reports in Clinical Medicine 2 (2013) 538-553 Copyright © 2013 SciRes. OPEN ACCESS 546 study. American Journal of Clinical Nutrition, 84, 936- 942. [35] Considine, R.V., Sinha, M.K., Heiman, M.L., Kriauciunas, A., Stephens, T.W., Nyce, M.R., Ohannesian , J.P., Marc o, C.C., McKee, L.J. and Baue r, T.L. (1996) Serum immu no- reactive-leptin concentrations in normal-weight and obese humans. The New England Journal of Medicine, 334, 292-295. http://dx.doi.org/10.1056/NEJM199602013340503 [36] Banks, W.A., Coon, A.B., Robinson, S.M., Moinuddin, A., Shultz, J.M., Nakaoke, R. and Morley, J.E. (2004) Trig- lycerides induce leptin resistance at the blood-brain bar- rier. Diabetes, 53, 1253-1260. http://dx.doi.org/10.2337/diabetes.53.5.1253 [37] Zakhari, S. (2006) Overview: How is alcohol metabolized by the body? Alcohol Research & Health, 29, 245-254. [38] Shapiro, A., Mu, W., Roncal, C., Cheng, K.Y., Johnson, R.J. and Scarpace, P.J. (2008) Fructose-induced leptin-resistance exascerbates weight gain in response to subsequent high-fat feeding. American Journal of Physiology. Regulatory, Inte- grative Comparative Physiology, 295, R1370-R1375. http://dx.doi.org/10.1152/ajpregu.00195.2008 [39] Zhou, H., Zhang, T., Harmon, J.S., Bryan, J. and Robert- son, R.P. (2007) Zinc, not insulin, regulates the rat α-cell response to hypoglycemia in Vivo. Diabete s, 56, 1107-1112. http://dx.doi.org/10.2337/db06-1454 [40] Chang, X., Jorgensen, A.M., Bardrum, P. and Led, J.J. (1977) Solution structures of the R6 human insulin hexamer. Bio- chemistry, 36, 9409-9422. http://dx.doi.org/10.1021/bi9631069 [41] Hellman, B., Gylfe, E., Grapengiesser, E., Dansk, H. and Salehi, A. (2007) Insulin oscillations-clinically important rhythm. Antidiabetics should increase the pulsative com- ponent of the insulin release (in Swedish). Lakartidningen, 104, 2236-2239. [42] Scheen, A.J., Sturis, J., Polonsky, K.S. and Van Cauter, E. (1996) Alterations in the ultradian oscillations of insulin se- cretion and pla sma gl ucose in a ging. Diabetologia, 39, 564- 572. http://dx.doi.org/10.1007/BF00403303 [43] Polonsky, K.S., Given, B.D., Hirsch, L.J., Tillil, H., Sha- piro, E.T., Beebe, C., Frank, B.H., Galloway, J.A. and Van Cauter, E. (1988) Abnormal patterns of insulin secretion in non-insulin-dependent diabetes mellitus. New England Jour- nal of Medicine, 318, 1231-1239. http://dx.doi.org/10.1056/NEJM198805123181903 [44] Lardner, A. (2001) The effects of extracellular pH on im- mune function. Journal of Leukocyte Biology, 69, 522-530. [45] Blasetti, A., Verrotti, A., Chiarelli, F. and Morgese, G. (1992) Immunolog ic change s in diabe tic ketoaci dosis. Minerva Pe- diatrica, 44, 181-184. [46] Schulz, H.U., Niederau, C., Klonowski-Stumpe, H., Hala ng k, W., Luthen, R. and Lippert, H. (1999) Oxidative stress in acute pancreatitis. Hepatogastroenterology, 46, 27 36-2750 . [47] Ewing, G.W., Ewing, E.N. and Nwose, E.U. (2008) Vir- tual Scanning technology—The relationship to oxidative stress and applicability to diabetes management. Biogenic Amines, 22, 195-207. [48] Stitt, A.W. (2005) The Maillard Reaction in eye diseases. Annals of the New York Academy of Sciences, 1043, 582-597. http://dx.doi.org/10.1196/annals.1338.066 [49] Baker, L.H., Lieberman, D. and Oehlke, M. (1995) Psy- chological distress in patients with gastroesophageal re- flux disease. American Journal of Gastroenterology, 90, 1797-1803. [50] McDonald-Haile, J., Bradley, L.A., Bailey, M.A., Schan, C.A. and Richter, J.E. (1994) Relaxation training reduces symptom reports and acid exposure in patients with gas- troesophageal reflux disease. Gastroenterology, 107, 61-69. [51] Esquivel, G., Schruers, K.R., Maddock, R.J., Colasanti, A. and Griez, E.J. (2010) Acids in the brain: A factor in panic? Journal of Psychopharmacology, 24, 639-647. http://dx.doi.org/10.1177/0269881109104847 [52] Ewing, G.W. and Parvez, S.H. (2010) The multi-systemic nature of diabetes mellitus: Genoty pe or phenotype? North American Journal of Medical Sciences, 2, 444-456. http://dx.doi.org/10.4297/najms.2010.2444 [53] Fonseca, V.A. (2007) The effects of insulin on the endothe- lium. Endocrinology and Metabolism Clinics of North Ame- rica, 36, 20-26. http://dx.doi.org/10.1016/S0889-8529(07)80009-0 [54] Hovorka, R., Powrie, J.K., Smith, G.D., Sonksen, P.H., Carson, E.R. and Jones, R.H. (1993) Five-compartment model of insulin kinetics and its use to investigate action of chloroquine in NIDDM. American Journal of Physiology, 265, E162-E175. [55] Sato, H., Terasaki, T., Mizuguchi, H., Okumura, K. and Tsuji, A. (1991) Receptor-recycling model of clearance and dis- tribution of insulin in the perfused mouse liver. Diabe- tologia, 34, 613-621. http://dx.doi.org/10.1007/BF00400989 [56] Duckworth, W.C., Hamel, F.G. and Peavy, D.E. (1988) He- patic metabolism of insulin. The American Journal of Me- dicine, 85, 71-76. http://dx.doi.org/10.1016/0002-9343(88)90399-3 [57] Duckworth, W.C., Bennett, R.G. and Hamel, F.G. (1998) Insulin degradation: Progress and potential. Endocrine Re- views, 19, 608-624. http://dx.doi.org/10.1210/er.19.5.608 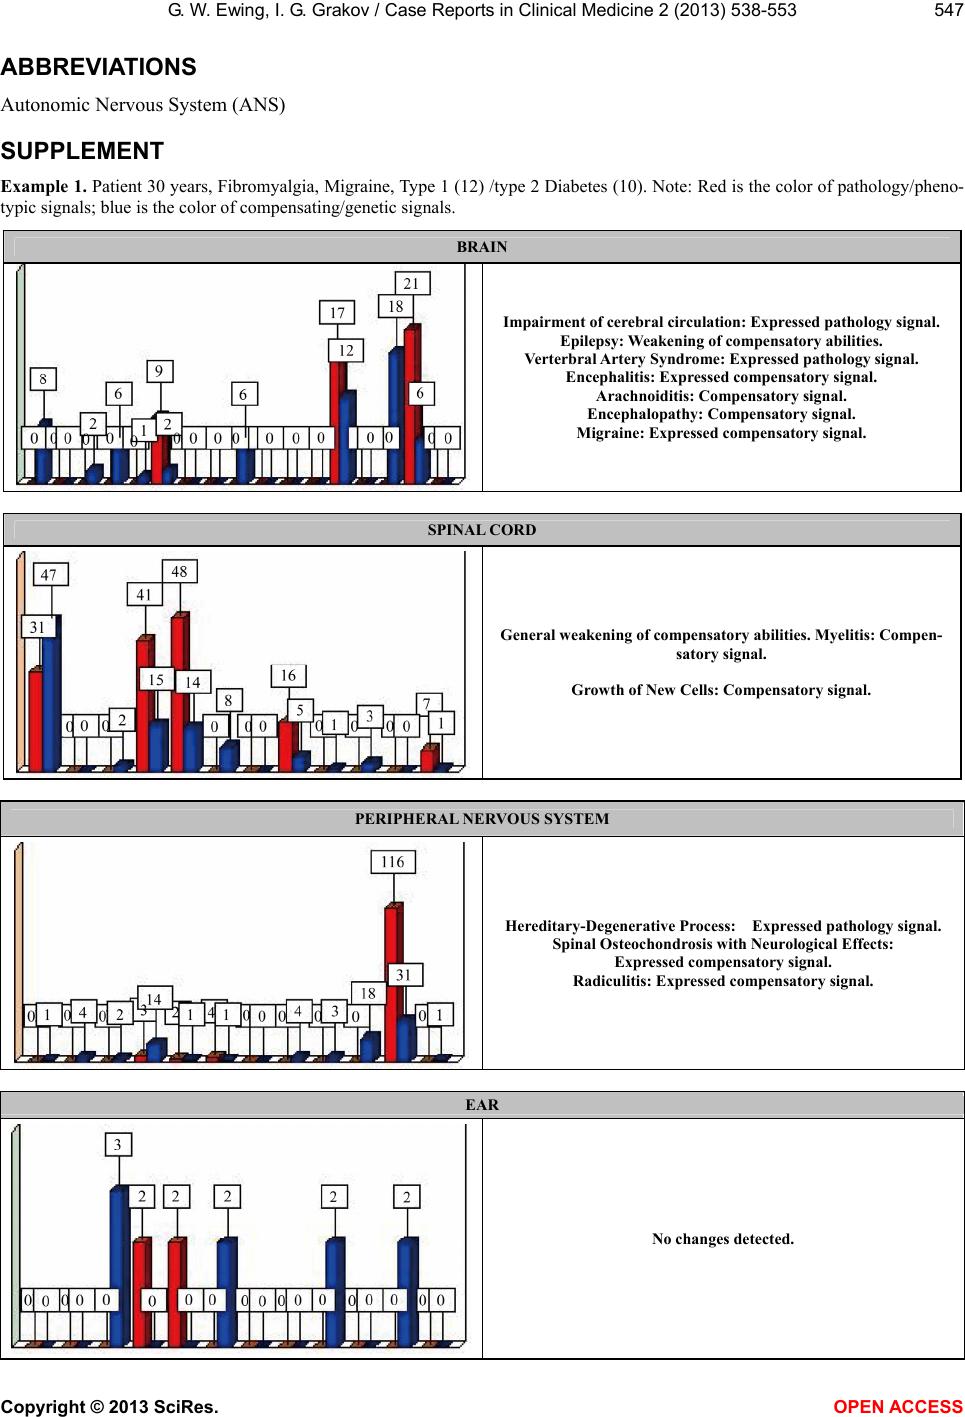 G. W. Ewing, I. G. Grakov / Case Reports in Clinical Medicine 2 (2013) 538-553 547 ABBREVIATIONS Autonomic Nervous System (ANS) SUPPLEMENT Example 1. Patient 30 years, Fibromyalgia, Migraine, Type 1 (12) /type 2 Diabetes (10). Note: Red is the color of pathology/pheno- typic signals; blue is the color of compensating/genetic signals. BRAIN Impairment of cerebral circulation: Expressed pathology signal. Epilepsy: Weakening of compensatory abilities. Verterbral Artery Syndrome: Expressed pathology signal. Encephalitis: Expressed compensatory signal. Arachnoiditis: Compensatory signal. Encephalopathy: Compensatory signal. Migraine: Expressed compensatory signa l. SPINAL CORD General weakening of compensatory abilities. Myelitis: Compen- satory signal. Growth of New Cells: Compensatory signal. PERIPHERAL NERVOUS SYSTEM Hereditary-Degenerative Process: Expressed pathology signal. Spinal Osteochondrosis with Neurological Effects: Expressed compensatory signal. Radiculitis: Expressed compensatory signal. EAR No changes detected. Copyright © 2013 SciRes. OPEN ACCESS 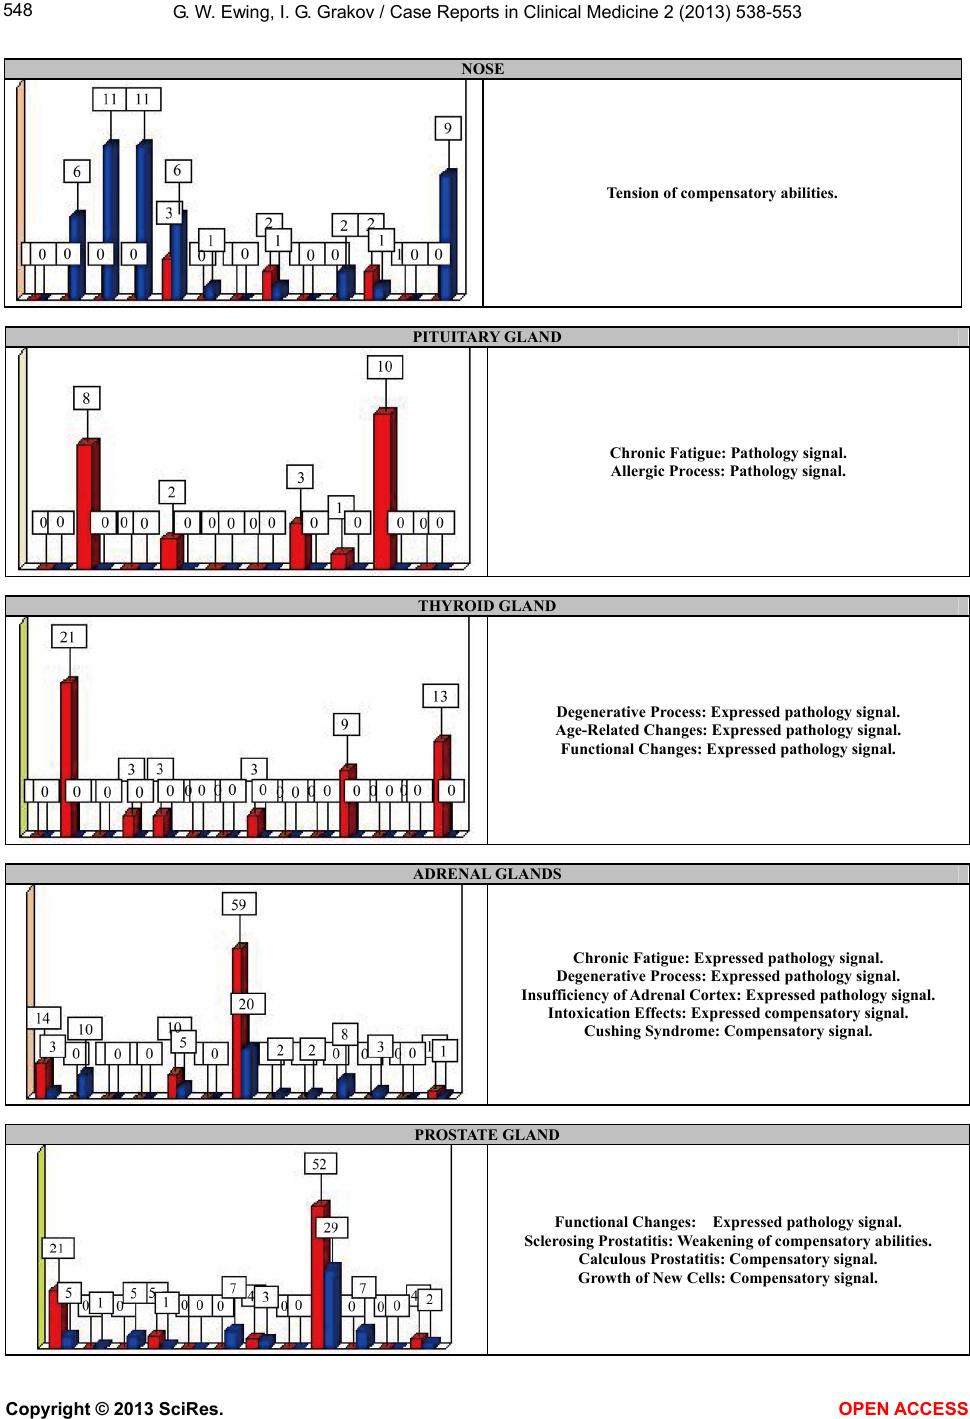 G. W. Ewing, I. G. Grakov / Case Reports in Clinical Medicine 2 (2013) 538-553 548 NOSE Tension of compensatory abilities. PITUITARY GL AND Chronic Fatigue: Pathology signal. Allergic Process: Pat hology signal. THYROID GLAND Degenerative Process: Expressed pathology signal. Age-Related Changes: Expressed pathology signal. Functional Changes: Expressed pathology signa l. ADRENAL GLANDS Chronic Fatigue : Expressed pathology si gn al . Degenerative Process: Expressed pathology signal. Insufficiency of Adrenal Cortex: Expressed pathology s i g na l . Intoxication Effects: Expressed compensatory signal. Cushing Syndrom e: Compensatory signal. PROSTATE GLAND Functional Changes: Expressed pathology signal. Sclerosing Pros tatitis: Weakening of compensatory abilities. Calculous Prostatitis: Compensatory signal. Growth of New Cells: Compensatory signal. Copyright © 2013 SciRes. OPEN ACCESS 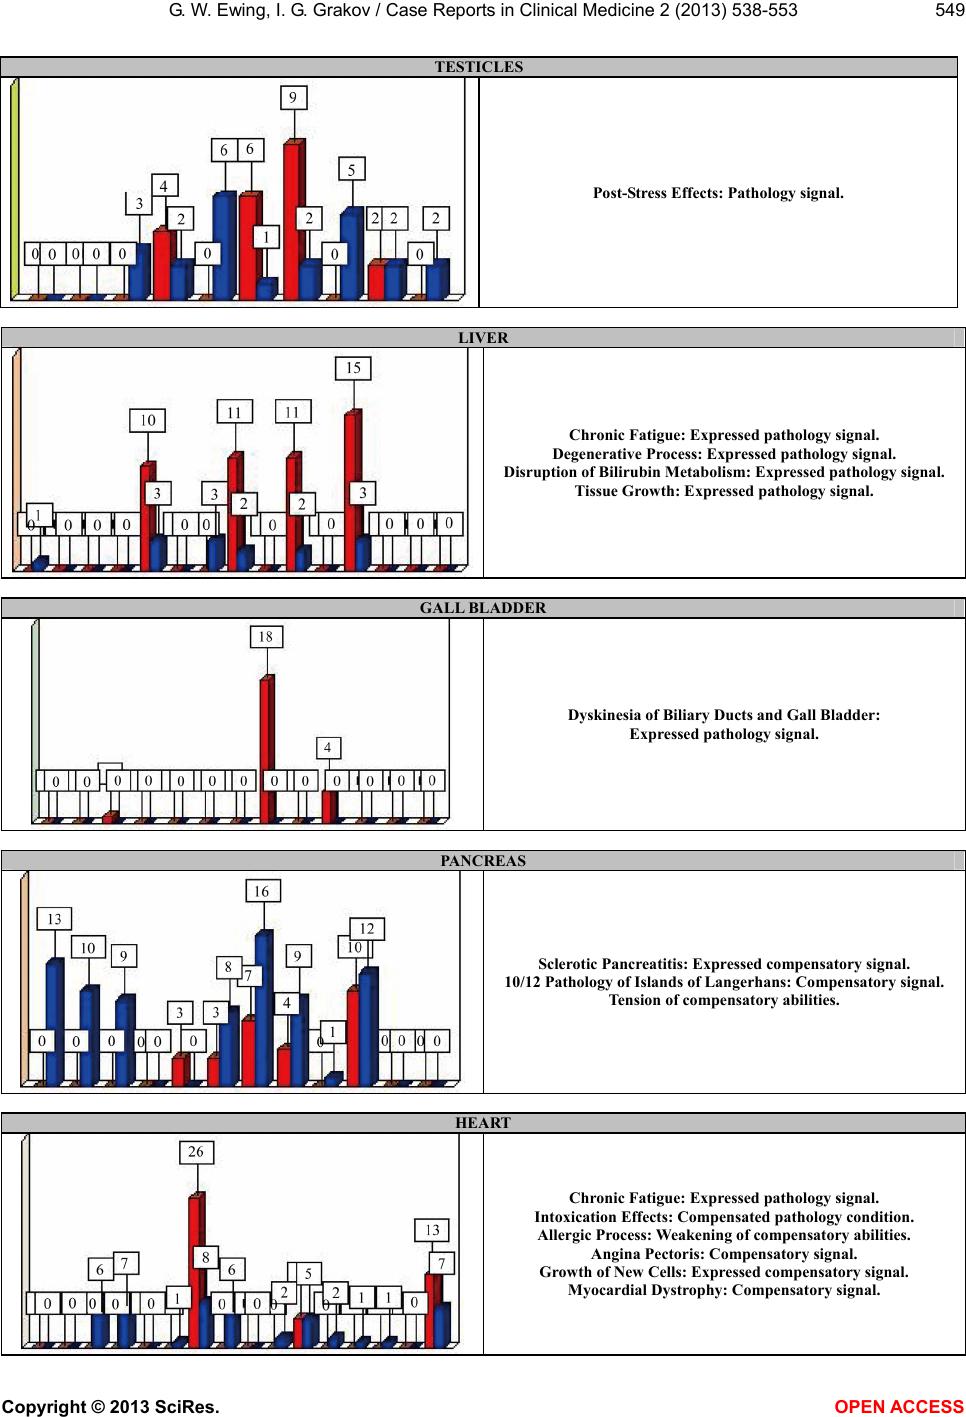 G. W. Ewing, I. G. Grakov / Case Reports in Clinical Medicine 2 (2013) 538-553 549 TESTICLES Post-Stress Effects: Pathology signal. LIVER Chronic Fatigue : Expressed pathology si gn al . Degenerative Process: Expressed pathology signal. Disruption of Bilirubin Metabolism: Expre sse d pa th olo gy s ig nal . Tissue Growth: Expressed pathology signal. GALL BLADDER Dyskinesia of Biliary Ducts and Gall Bladder: Expressed path o l og y si g na l. PANCREAS Sclerotic Pancr e atitis: Expressed compensatory signal. 10/12 Pathology of I slan ds o f Langerhans: Compensatory signal. Tension of compensatory abilities. HEART Chronic Fatigue : Expressed pathology si gn al . Intoxication Effects: Compensated pathology condition. Allergic Process: Weakening of compensatory abilities. Angina Pectoris: Compensatory signal. Growth of New Cells: Expressed compensatory signal. Myocardial Dystrophy: Compensatory signal. Copyright © 2013 SciRes. OPEN ACCESS  G. W. Ewing, I. G. Grakov / Case Reports in Clinical Medicine 2 (2013) 538-553 550 BLOOD AND PERIPHERAL BLOOD VESSELS Phlebitis and Thrombophlebitis: Expressed pathology sig nal. Chronic Fatigue : Expressed pathology si gn al . Post-Stress Effects: Expressed pathology signal. Leukopenia: Expressed compensatory signal. Allergic Process: Compensatory signal. Degenerative Process: Compensatory signal. SPLEEN Functional Changes: Expressed pathology signal. Allergic Process: Pathology signal. LUNGS AND BRONCHI Bronchiectatic disease: Expressed compensator y signal. Age-Related Changes: Compensatory signal. SKIN Eczema: Weakening of compensatory abilities. Growth of New Cells: Compensatory signal. Urticaria: Compensatory signal. Dermatitis: Compensatory signal. Herpes: Expressed compensatory signal. Intoxication Effects: Compensatory signal. OESOPHAGUS Degenerative Process: Weakening of compensatory abilities. Chronic Fatigue: Weakening of compensatory abilities. Allergic Proce s s: Expressed pathology s ig n al . Diverticulum: Compensatory signal. Age-Related Changes: Expressed compensatory signal. Oesophagitis: Expressed compensatory signal. Abnormalities of Development: Expressed compensatory signal. Copyright © 2013 SciRes. OPEN ACCESS  G. W. Ewing, I. G. Grakov / Case Reports in Clinical Medicine 2 (2013) 538-553 551 STOMACH Functional Changes: Expressed pathology signa l. Post-Stress Effects: Expr e sse d pathology signal. Gastritis: Compensatory signal. Intoxication Effects: Compensatory signal. DUODENUM Degenerative Process: Pathology signal. Allergic Process: Compensatory signal. Dyskinesia: Compensatory signal. Growth of New Cells: Expressed compensatory signal. Tissue Growth: Expressed compensatory signal. Age-Related Changes: Expressed compensatory signal. SMALL INTESTINE Intoxication Effects: Pathology signal. LARGE INTESTINE Colitis: Expr e ss ed p athology signal. Post-Stress Effects: Compensatory signal. KIDNEYS Chronic Fatigue : Expressed pathology si gn al . Degenerative Process: Expressed pathology signal. Post-Stress Effects: Express ed p athology signal. Functional Changes: Weakening of compensatory abilities. Abnormalities of Development: Expressed compensatory signal. Tissue Growth: Compensatory signal. Copyright © 2013 SciRes. OPEN ACCESS  G. W. Ewing, I. G. Grakov / Case Reports in Clinical Medicine 2 (2013) 538-553 552 URINAR Y BLADDER Post-Stress Effects: Expr e sse d pathology signal. Urinary Bladder Polyposis: Expressed pathology signal. PENIS Post-Stress Effects: Expr e sse d pathology signal. SKELETAL AND MUSCULAR SYSTEM Myositis: Expressed pathology signal. Example 2. Type 2 diabetes (22) with indications of emergent type 1 diabetes (6). PANCREAS 22/6 Pathology of Islands of Langerhans: Expresse d pathology signal. General weakening of compensatory abilities. Tension of compensatory abilities. 15/14 Sclerotic Pancreatitis HEART Ischemic Heart Disease: Weakening of compensatory abilities. Chronic Fatigue: Pathology signal. Cardiac Infarction: Compensatory signal. Myocardial Dystrophy: Expressed compensatory signal. Abnormalities of Development: Expressed compensatory signal. Myocarditis: Expressed compensatory signal. Intoxication Effects: Compensatory signal. Copyright © 2013 SciRes. OPEN ACCESS  G. W. Ewing, I. G. Grakov / Case Reports in Clinical Medicine 2 (2013) 538-553 Copyright © 2013 SciRes. 553 Example 3. Type 2 diabetes (17). PANCREAS General weakening of compensatory abilities. Growth of New Cells: Expressed compensatory signal. 17/1 Pathology of Islands of Langerhans: Expresse d pathology signal. OPEN ACCESS
|