 Chinese Medicine, 2013, 4, 148-156 Published Online December 2013 (http://www.scirp.org/journal/cm) http://dx.doi.org/10.4236/cm.2013.44018 Open Access CM Antioxidant Activity of 50 Traditional Chinese Medicinal Materials Varies with Total Phenolics Zhengyou He1,2*, Minbo Lan1, Dongying Lu1, Hongli Zhao1, Huihui Yuan1 1Research Center of Analysis & Test and Institute of Advanced Materials, East China University of Science & Technology, Shanghai, China 2Sichuan Industrial Institute of Antibiotics, Chengdu University, Chengdu, China Email: *Hezhengyou@aliyun.com Received September 15, 2013; revised November 14, 2013; accepted November 29, 2013 Copyright © 2013 Zhengyou He et al. This is an open access article distributed under the Creative Commons Attribution License, which permits unrestricted use, distribution, and reproduction in any medium, provided the original work is properly cited. ABSTRACT This study was designed to determine the total phenolic content of 50 herbs and to examine their antioxidant potential. In the sample preparation, 60% ethanol was chosen as the extraction solvent for the subsequent experiments. Fo- lin-Cicolteau phenol reagent and a colorimetric method were used to determine the total phenolic content of the selected herbs. The result showed that total phenolic content of those herbs ranged from 2 to 185 mg/g. In antioxidant assay, the ferric reducing/antioxidant power (FRAP) values ranged from 2 to 134 mg GAE/g; the IC50 values of DPPH•, •OH and scavenging were in the range of 0.06 - 5.50 mg/mL, 0.017 - 0.636 mg/mL and 0.050 - 0.681 mg/mL respectively. Flos caryophylli was the exceptant in the scavenging assay because there was no linear relation between the con- centration and the scavenging percentage. Compared to gallic acid, ascorbic acid and butylated hydroxytoluene (BHT) in antioxidant assay as positive control, the most potential antioxidant herbs were Cacumen platycladi, Radix et Rhi- zoma rhei, Rhizoma rhodiolae crenulatae, and Rhizoma sanguisorbae with considerable content of phenolics. Espe- cially, a positive and significant correlation was found between the total phenolic content and FRAP value or DPPH• scavenging percentage. • 2 O • 2 O Keywords: Traditional Chinese Medicinal Material; Total Phenolics; Antioxidant Activity; Ferric Reducing/Antioxidant Power; Free Radical Scavenging Activity 1. Introduction Roles of the reactive oxygen species (ROS) and reactive nitrogen species (RNS) are increasingly recognized in physiological processes, pathogenesis of many diseases, and molecular mechanisms in many drug-therapies [1]. ROS are generated by all aerobic organisms and their production seems to be essential for signal-transduction pathways that regulate multiple physiological processes. Excessive amount of ROS, however, can initiate toxic and lethal chain reactions, which disable the biological structures that are required for cellular integrity and sur- vival. Recently, there is a growing interest in substances exhibiting antioxidant properties that are supplied to hu- man and animal organisms as food components or as specific redox-therapy drugs [1]. Substantive experi- ments have already testified that many phytochemicals and extracts from plants possess antioxidant effects. Many synthetic antioxidants, such as butylated hy- droxyanisole (BHA), butylated hydroxytoluene (BHT) and tert-butylhydro-quinone (TBHQ), are widely used in food and pharmaceutical industries against oxidative damage. However, animal tests have demonstrated that those synthesized compounds would accumulate in rats and result in liver-damage and carcinogenesis [2]. Inter- estingly, some important antioxidants, including ascorbic acid and the tocopherols, cannot be synthesized by hu- mans and must be taken in diet [3]. It has long been rec- ognized that some naturally occurring substances in plants process antioxidant activity. Therefore, the devel- opment and utilization of more effective and non-toxic antioxidants from natural products are desired, not only for the food and drug storage, but also for the nutritional and clinical applications. It is well known that the traditional Chinese herbs have been used in food and medicine over two thousand years. There are more than 11,000 officinal plants, 1500 offici- *Corresponding author.  Z. Y. HE ET AL. 149 nal animals and 80 officinal minerals used as the tradi- tional Chinese medicine [4]. For the reason of biodiver- sity, the chemical composition and bioactivity of the me- dicinal materials are also varied. Epidemiological studies have shown that many natural antioxidant compounds possess anti-inflammatory, antiatherosclerotic, antitumor, antimutagenic, anticarcinogenic, antibacterial, or antivi- ral activities to a greater or lesser extent [5,6]. Appar- ently, the Chinese medicinal plants may contain a wide variety of chemical composition, including phenolic compounds (e.g. phenolic acids, flavonoids, quinones, coumarins, lignans, stilbenes, tannins), nitrogen com- pounds (alkaloids, amines, betalains), vitamins, terpe- noids (including carotenoids), with potential antioxidant activities [7]. In free radical biology, the balance between antioxidation and oxidation is believed to be a critical concept to maintain a healthy biological system, which is similar to the concept of the balance between “Yin” and “Yang” in the Traditional Chinese Medicine (TCM). The effective compositions in the yin-tonic herbs were mainly flavonoids with strong antioxidant activities six times higher than that of the yang-tonic herbs [8]. Contrarily, Szeto and Benzie indicated that the yin nature of herbs may not be necessarily associated with superior antioxi- dative effect to yang-tonic herbs, at least in terms of DNA protection against oxidant challenge [9]. The syn- ergetic antioxidant effects of the traditional Chinese herbs should be considered in the view of systems biol- ogy [10], but the literature partially revealed the inner correlation between the antioxidant capacity and the tra- ditional usages. Consequently, it is necessary to evaluate the antioxidant activity of traditional Chinese herbs sys- tematically using different types of free radical. 50 Traditional Chinese herbs, grown and processed under the standard operating procedures, were selected and prepared for the initial investigation. According to the classification of their traditional usages [4], 18 of tho- se herbs, including 11 stanchers, are used as the haematic. The next is the heat-clearing drug, and 10 medicinal ma- terials are ranged to this class. The third is the tonic, in- cluding one yin-tonic, eight yang-tonics, and four weak- tonics. Other medicinal materials are sorted into diapho- retic, damp-resolving, cathartic, and antitussive respec- tively. The main objectives of this paper were a) to de- termine the content of total phenolics in above medicinal materials; b) to evaluate their in vitro antioxidant activity of ferric reducing and antioxidant power (FRAP), and free radicals (DPPH•, •OH and ) scavenging capaci- ties. • 2 O 2. Materials and Methods 2.1. Materials from the Traditional Chinese Medicine 50 Chinese medicinal materials were purchased from a local pharmacy (Jiamei medicine chain Co., Ltd., Shang- hai, China). The planting, harvesting, drying, processing, and storage of the medicinal materials were conducted according to strict traditional procedures, namely the standard operating procedures implemented in China. Names of those Chinese medicinal materials are listed in Table 1, all of them have been identified according to the literature [4]. All the voucher specimens have been de- posited at the Specimen-room of the Research Center of Analysis & Test, East China University of Science and Technology, Shanghai, China. 2.2. Preparation of Extracts Dried and pulverized sample (1 g) was extracted using 20 ml of 60% (v/v) ethanol. It was mixed continuously with magnetic stirrer under refluxing at 60˚C for 1 h. Then, the extracts were filtered over Xinhua filter paper. The residue was re-extracted under the same conditions. The obtained extracts were conflated and concentrated in vacuo under 40˚C using a rotary evaporator (ZX98-1 Rotavapor, Shanghai Organic Chemistry Institute, Shanghai, China) to yield dry extracts, which were stored at 4˚C for further analysis. 2.3. Total Phenolic Contents (TPCs) Analysis The TPCs of those extracts were analyzed using Folin- Ciocalteu’s phenol reagent [11]. The extracts were dis- solved in 60% (v/v) ethanol at the concentrations to fit the TPC analysis. The solutions (0.5 mL) of different concentrations were put in a 10 mL volumetric flask, 4.5 mL of distilled water and 1.0 mL of Folin-Ciocalteu re- agent were added, and the flask was shaken thoroughly. After 3 min, 4 mL of 2% Na2CO3 was added, and the mixture was allowed to stand for 2 h with intermittent shaking. The absorbance was measured at 770 nm (UV- 2102, Unico Instruments Co., Ltd., Shanghai, China). Experiments were carried out in triplicate. The results were expressed as gallic acid equivalent per gram raw material (mg GAE/g). The same procedure was repeated Table 1. Extraction efficiencies of various dilutions of etha- nol in water on Folium artemistae argyi, Rhizoma rhodiolae crenulatae, and Cortex eucommiae. TPC a (mg GAE/g dried sample) Species 95% ethanol60% ethanol 30% ethanol 10% ethanol Folium artemistae argyi 18.49 ± 0.4634.72 ± 0.72 28.33 ± 0.70 24.13 ± 0.56 Rhizoma rhodiolae crenulatae 93.61 ± 1.72184.56 ± 3.78 169.02 ± 3.95 151.70 ± 1.87 Cortex eucommiae 22.07 ± 0.6140.04 ± 0.80 34.15 ± 0.66 31.28 ± 0.59 aResults are means ± SD (n = 3). Open Access CM 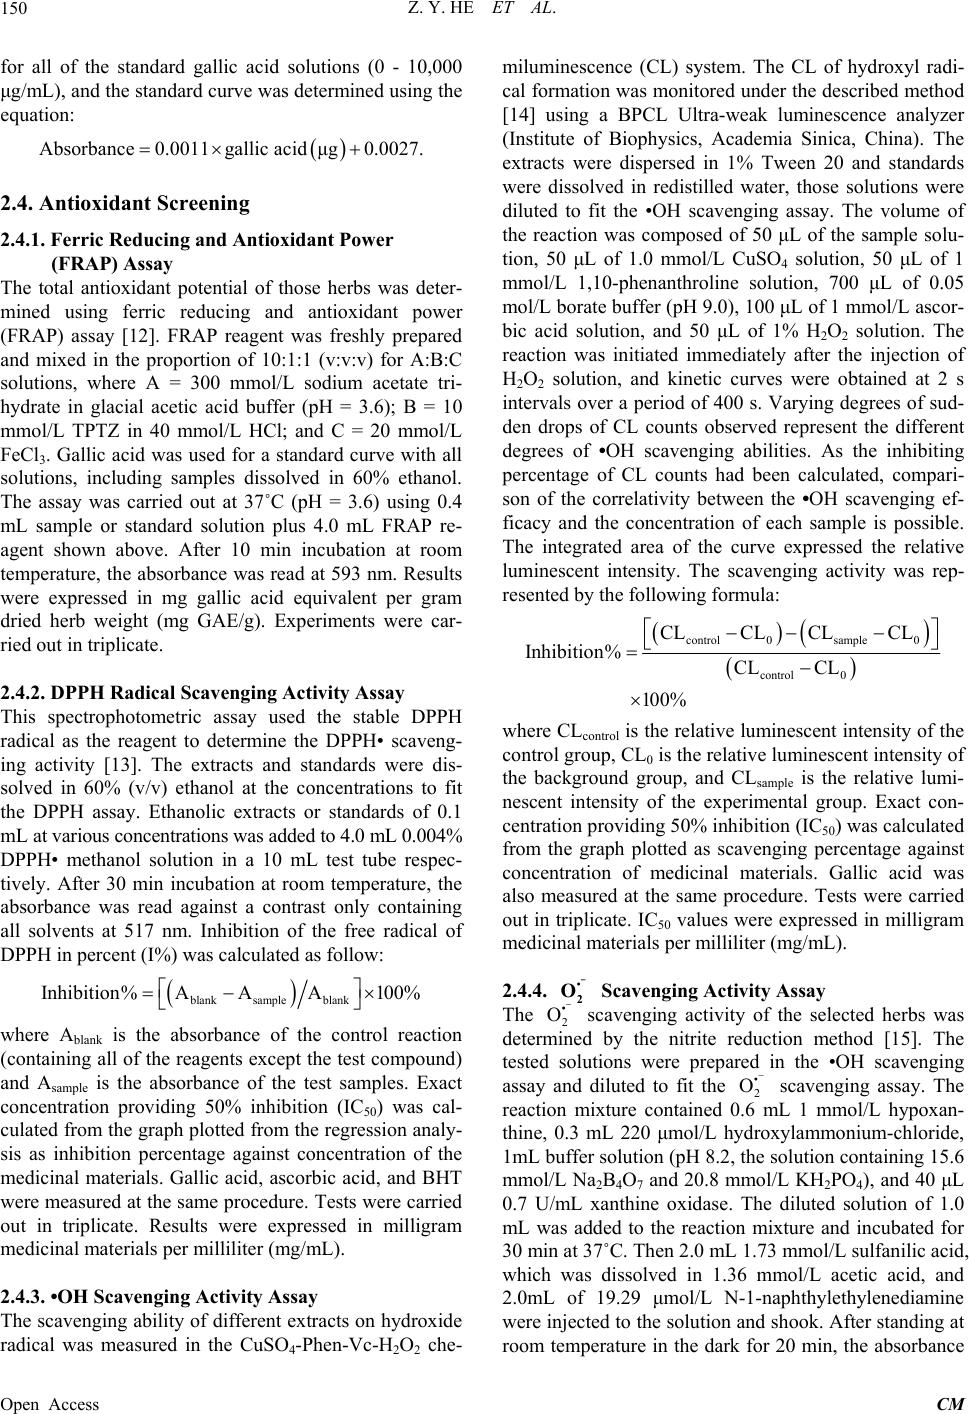 Z. Y. HE ET AL. 150 for all of the standard gallic acid solutions (0 - 10,000 μg/mL), and the standard curve was determined using the equation: Absorbance0.0011gallic acidμg0.0027. 2.4. Antioxidant Screening 2.4.1. Ferric Reducing and Antioxidant Power (FRAP) Assay The total antioxidant potential of those herbs was deter- mined using ferric reducing and antioxidant power (FRAP) assay [12]. FRAP reagent was freshly prepared and mixed in the proportion of 10:1:1 (v:v:v) for A:B:C solutions, where A = 300 mmol/L sodium acetate tri- hydrate in glacial acetic acid buffer (pH = 3.6); B = 10 mmol/L TPTZ in 40 mmol/L HCl; and C = 20 mmol/L FeCl3. Gallic acid was used for a standard curve with all solutions, including samples dissolved in 60% ethanol. The assay was carried out at 37˚C (pH = 3.6) using 0.4 mL sample or standard solution plus 4.0 mL FRAP re- agent shown above. After 10 min incubation at room temperature, the absorbance was read at 593 nm. Results were expressed in mg gallic acid equivalent per gram dried herb weight (mg GAE/g). Experiments were car- ried out in triplicate. 2.4.2. DPPH Radical Scavenging Activity Assay This spectrophotometric assay used the stable DPPH radical as the reagent to determine the DPPH• scaveng- ing activity [13]. The extracts and standards were dis- solved in 60% (v/v) ethanol at the concentrations to fit the DPPH assay. Ethanolic extracts or standards of 0.1 mL at various concentrations was added to 4.0 mL 0.004% DPPH• methanol solution in a 10 mL test tube respec- tively. After 30 min incubation at room temperature, the absorbance was read against a contrast only containing all solvents at 517 nm. Inhibition of the free radical of DPPH in percent (I%) was calculated as follow: blank sample blank Inhibition% AAA100% where Ablank is the absorbance of the control reaction (containing all of the reagents except the test compound) and Asample is the absorbance of the test samples. Exact concentration providing 50% inhibition (IC50) was cal- culated from the graph plotted from the regression analy- sis as inhibition percentage against concentration of the medicinal materials. Gallic acid, ascorbic acid, and BHT were measured at the same procedure. Tests were carried out in triplicate. Results were expressed in milligram medicinal materials per milliliter (mg/mL). 2.4.3. •OH Scavenging Activity Assay The scavenging ability of different extracts on hydroxide radical was measured in the CuSO4-Phen-Vc-H2O2 che- miluminescence (CL) system. The CL of hydroxyl radi- cal formation was monitored under the described method [14] using a BPCL Ultra-weak luminescence analyzer (Institute of Biophysics, Academia Sinica, China). The extracts were dispersed in 1% Tween 20 and standards were dissolved in redistilled water, those solutions were diluted to fit the •OH scavenging assay. The volume of the reaction was composed of 50 μL of the sample solu- tion, 50 μL of 1.0 mmol/L CuSO4 solution, 50 μL of 1 mmol/L 1,10-phenanthroline solution, 700 μL of 0.05 mol/L borate buffer (pH 9.0), 100 μL of 1 mmol/L ascor- bic acid solution, and 50 μL of 1% H2O2 solution. The reaction was initiated immediately after the injection of H2O2 solution, and kinetic curves were obtained at 2 s intervals over a period of 400 s. Varying degrees of sud- den drops of CL counts observed represent the different degrees of •OH scavenging abilities. As the inhibiting percentage of CL counts had been calculated, compari- son of the correlativity between the •OH scavenging ef- ficacy and the concentration of each sample is possible. The integrated area of the curve expressed the relative luminescent intensity. The scavenging activity was rep- resented by the following formula: control 0sample 0 control 0 CLCL CLCL Inhibition% CL CL 100% where CLcontrol is the relative luminescent intensity of the control group, CL0 is the relative luminescent intensity of the background group, and CLsample is the relative lumi- nescent intensity of the experimental group. Exact con- centration providing 50% inhibition (IC50) was calculated from the graph plotted as scavenging percentage against concentration of medicinal materials. Gallic acid was also measured at the same procedure. Tests were carried out in triplicate. IC50 values were expressed in milligram medicinal materials per milliliter (mg/mL). 2.4.4. Scavenging Activity Assay • 2 O - • 2 O The scavenging activity of the selected herbs was determined by the nitrite reduction method [15]. The tested solutions were prepared in the •OH scavenging assay and diluted to fit the scavenging assay. The reaction mixture contained 0.6 mL 1 mmol/L hypoxan- thine, 0.3 mL 220 μmol/L hydroxylammonium-chloride, 1mL buffer solution (pH 8.2, the solution containing 15.6 mmol/L Na2B4O7 and 20.8 mmol/L KH2PO4), and 40 μL 0.7 U/mL xanthine oxidase. The diluted solution of 1.0 mL was added to the reaction mixture and incubated for 30 min at 37˚C. Then 2.0 mL 1.73 mmol/L sulfanilic acid, which was dissolved in 1.36 mmol/L acetic acid, and 2.0mL of 19.29 μmol/L N-1-naphthylethylenediamine were injected to the solution and shook. After standing at room temperature in the dark for 20 min, the absorbance • 2 O Open Access CM 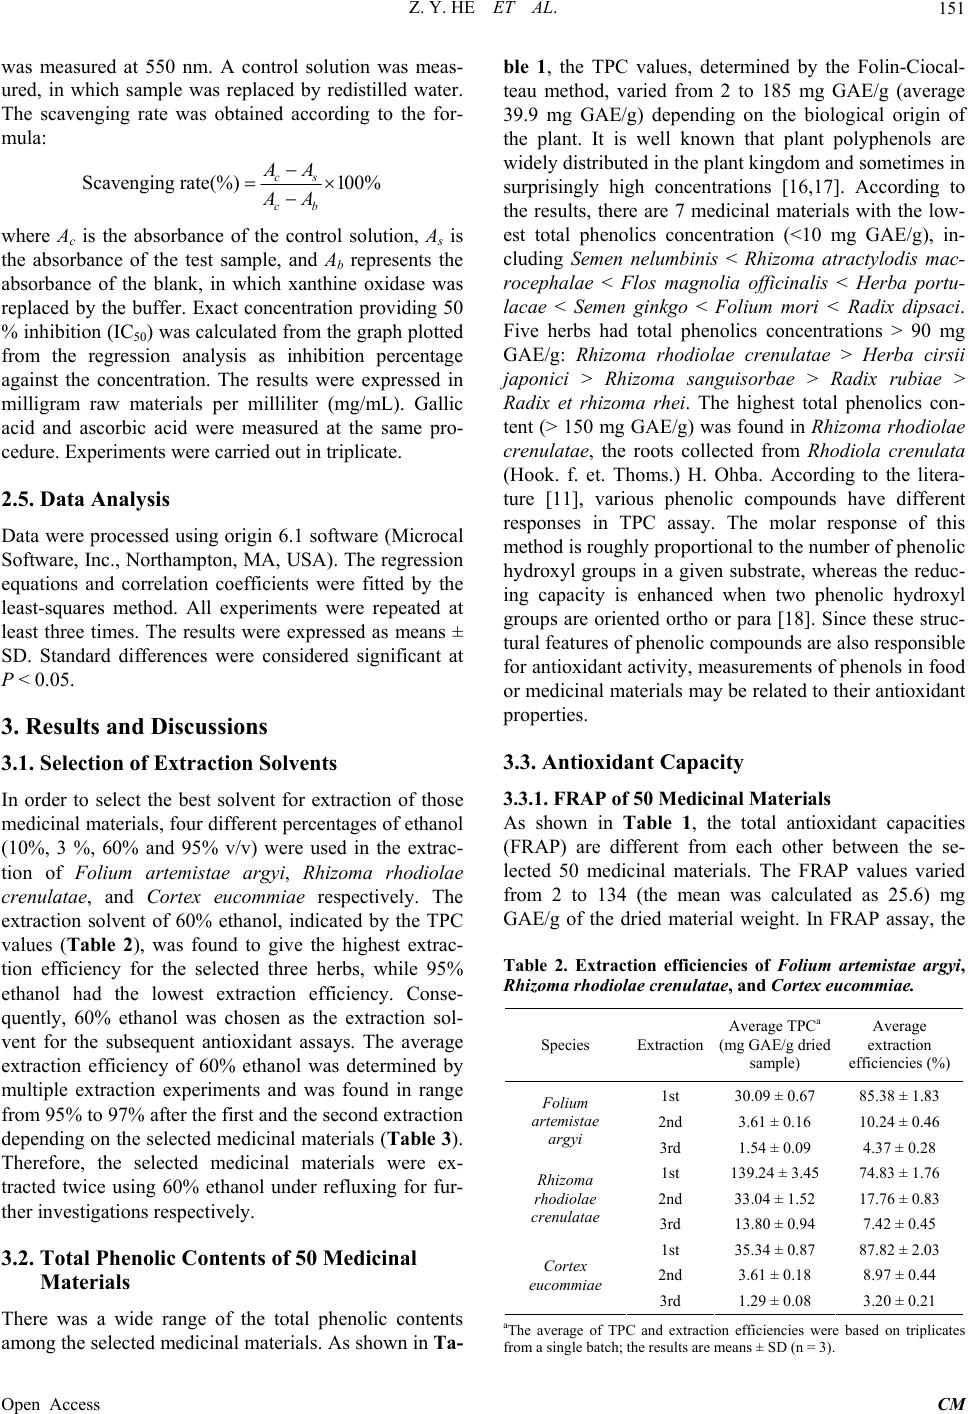 Z. Y. HE ET AL. 151 was measured at 550 nm. A control solution was meas- ured, in which sample was replaced by redistilled water. The scavenging rate was obtained according to the for- mula: Scavenging rate(%)100% cs cb AA AA where Ac is the absorbance of the control solution, As is the absorbance of the test sample, and Ab represents the absorbance of the blank, in which xanthine oxidase was replaced by the buffer. Exact concentration providing 50 % inhibition (IC50) was calculated from the graph plotted from the regression analysis as inhibition percentage against the concentration. The results were expressed in milligram raw materials per milliliter (mg/mL). Gallic acid and ascorbic acid were measured at the same pro- cedure. Experiments were carried out in triplicate. 2.5. Data Analysis Data were processed using origin 6.1 software (Microcal Software, Inc., Northampton, MA, USA). The regression equations and correlation coefficients were fitted by the least-squares method. All experiments were repeated at least three times. The results were expressed as means ± SD. Standard differences were considered significant at P < 0.05. 3. Results and Discussions 3.1. Selection of Extraction Solvents In order to select the best solvent for extraction of those medicinal materials, four different percentages of ethanol (10%, 3 %, 60% and 95% v/v) were used in the extrac- tion of Folium artemistae argyi, Rhizoma rhodiolae crenulatae, and Cortex eucommiae respectively. The extraction solvent of 60% ethanol, indicated by the TPC values (Table 2), was found to give the highest extrac- tion efficiency for the selected three herbs, while 95% ethanol had the lowest extraction efficiency. Conse- quently, 60% ethanol was chosen as the extraction sol- vent for the subsequent antioxidant assays. The average extraction efficiency of 60% ethanol was determined by multiple extraction experiments and was found in range from 95% to 97% after the first and the second extraction depending on the selected medicinal materials (Table 3). Therefore, the selected medicinal materials were ex- tracted twice using 60% ethanol under refluxing for fur- ther investigations respectively. 3.2. Total Phenolic Contents of 50 Medicinal Materials There was a wide range of the total phenolic contents among the selected medicinal materials. As shown in Ta- ble 1, the TPC values, determined by the Folin-Ciocal- teau method, varied from 2 to 185 mg GAE/g (average 39.9 mg GAE/g) depending on the biological origin of the plant. It is well known that plant polyphenols are widely distributed in the plant kingdom and sometimes in surprisingly high concentrations [16,17]. According to the results, there are 7 medicinal materials with the low- est total phenolics concentration (<10 mg GAE/g), in- cluding Semen nelumbinis < Rhizoma atractylodis mac- rocephalae < Flos magnolia officinalis < Herba portu- lacae < Semen ginkgo < Folium mori < Radix dipsaci. Five herbs had total phenolics concentrations > 90 mg GAE/g: Rhizoma rhodiolae crenulatae > Herba cirsii japonici > Rhizoma sanguisorbae > Radix rubiae > Radix et rhizoma rhei. The highest total phenolics con- tent (> 150 mg GAE/g) was found in Rhizoma rhodiolae crenulatae, the roots collected from Rhodiola crenulata (Hook. f. et. Thoms.) H. Ohba. According to the litera- ture [11], various phenolic compounds have different responses in TPC assay. The molar response of this method is roughly proportional to the number of phenolic hydroxyl groups in a given substrate, whereas the reduc- ing capacity is enhanced when two phenolic hydroxyl groups are oriented ortho or para [18]. Since these struc- tural features of phenolic compounds are also responsible for antioxidant activity, measurements of phenols in food or medicinal materials may be related to their antioxidant properties. 3.3. Antioxidant Capacity 3.3.1. FRAP of 50 Medicinal Materials As shown in Table 1, the total antioxidant capacities (FRAP) are different from each other between the se- lected 50 medicinal materials. The FRAP values varied from 2 to 134 (the mean was calculated as 25.6) mg GAE/g of the dried material weight. In FRAP assay, the Table 2. Extraction efficiencies of Folium artemistae argyi, Rhizoma rhodiolae crenulatae, and Cortex eucommiae. Species Extraction Average TPCa (mg GAE/g dried sample) Average extraction efficiencies (%) 1st 30.09 ± 0.67 85.38 ± 1.83 2nd 3.61 ± 0.16 10.24 ± 0.46 Folium artemistae argyi 3rd 1.54 ± 0.09 4.37 ± 0.28 1st 139.24 ± 3.45 74.83 ± 1.76 2nd 33.04 ± 1.52 17.76 ± 0.83 Rhizoma rhodiolae crenulatae 3rd 13.80 ± 0.94 7.42 ± 0.45 1st 35.34 ± 0.87 87.82 ± 2.03 2nd 3.61 ± 0.18 8.97 ± 0.44 Cortex eucommiae 3rd 1.29 ± 0.08 3.20 ± 0.21 aThe average of TPC and extraction efficiencies were based on triplicates from a single batch; the results are means ± SD (n = 3). Open Access CM 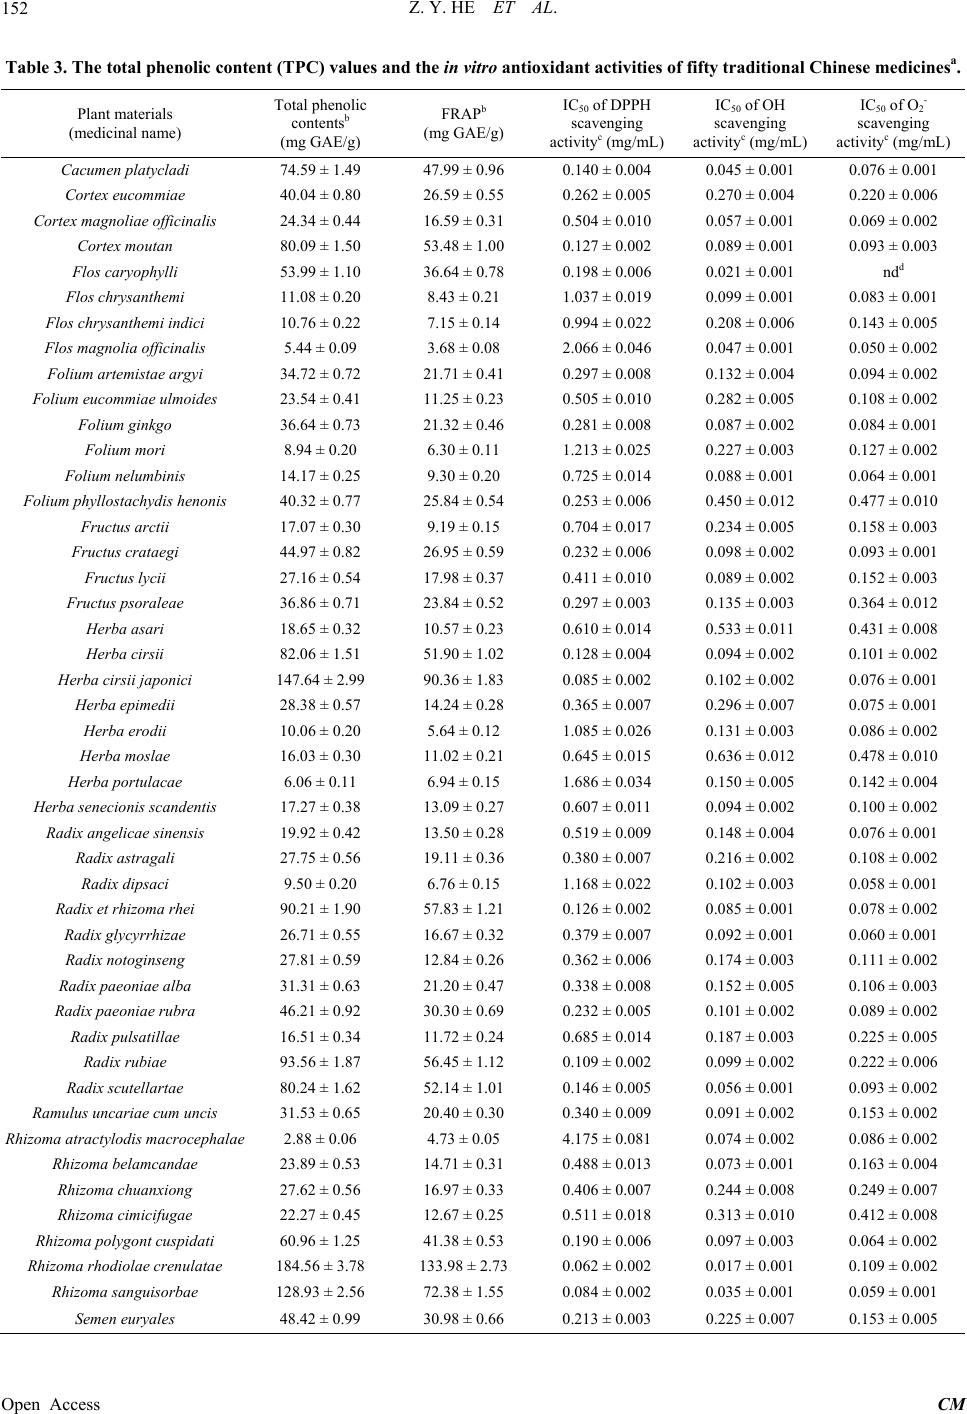 Z. Y. HE ET AL. Open Access CM 152 Table 3. The total phenolic content (TPC) values and the in vitro antioxidant activities of fifty traditional Chinese medicinesa. Plant materials (medicinal name) Total phenolic contentsb (mg GAE/g) FRAPb (mg GAE/g) IC50 of DPPH scavenging activityc (mg/mL) IC50 of OH scavenging activityc (mg/mL) IC50 of O2- scavenging activityc (mg/mL) Cacumen platycladi 74.59 ± 1.49 47.99 ± 0.96 0.140 ± 0.004 0.045 ± 0.001 0.076 ± 0.001 Cortex eucommiae 40.04 ± 0.80 26.59 ± 0.55 0.262 ± 0.005 0.270 ± 0.004 0.220 ± 0.006 Cortex magnoliae officinalis 24.34 ± 0.44 16.59 ± 0.31 0.504 ± 0.010 0.057 ± 0.001 0.069 ± 0.002 Cortex moutan 80.09 ± 1.50 53.48 ± 1.00 0.127 ± 0.002 0.089 ± 0.001 0.093 ± 0.003 Flos caryophylli 53.99 ± 1.10 36.64 ± 0.78 0.198 ± 0.006 0.021 ± 0.001 ndd Flos chrysanthemi 11.08 ± 0.20 8.43 ± 0.21 1.037 ± 0.019 0.099 ± 0.001 0.083 ± 0.001 Flos chrysanthemi indici 10.76 ± 0.22 7.15 ± 0.14 0.994 ± 0.022 0.208 ± 0.006 0.143 ± 0.005 Flos magnolia officinalis 5.44 ± 0.09 3.68 ± 0.08 2.066 ± 0.046 0.047 ± 0.001 0.050 ± 0.002 Folium artemistae argyi 34.72 ± 0.72 21.71 ± 0.41 0.297 ± 0.008 0.132 ± 0.004 0.094 ± 0.002 Folium eucommiae ulmoides 23.54 ± 0.41 11.25 ± 0.23 0.505 ± 0.010 0.282 ± 0.005 0.108 ± 0.002 Folium ginkgo 36.64 ± 0.73 21.32 ± 0.46 0.281 ± 0.008 0.087 ± 0.002 0.084 ± 0.001 Folium mori 8.94 ± 0.20 6.30 ± 0.11 1.213 ± 0.025 0.227 ± 0.003 0.127 ± 0.002 Folium nelumbinis 14.17 ± 0.25 9.30 ± 0.20 0.725 ± 0.014 0.088 ± 0.001 0.064 ± 0.001 Folium phyllostachydis henonis 40.32 ± 0.77 25.84 ± 0.54 0.253 ± 0.006 0.450 ± 0.012 0.477 ± 0.010 Fructus arctii 17.07 ± 0.30 9.19 ± 0.15 0.704 ± 0.017 0.234 ± 0.005 0.158 ± 0.003 Fructus crataegi 44.97 ± 0.82 26.95 ± 0.59 0.232 ± 0.006 0.098 ± 0.002 0.093 ± 0.001 Fructus lycii 27.16 ± 0.54 17.98 ± 0.37 0.411 ± 0.010 0.089 ± 0.002 0.152 ± 0.003 Fructus psoraleae 36.86 ± 0.71 23.84 ± 0.52 0.297 ± 0.003 0.135 ± 0.003 0.364 ± 0.012 Herba asari 18.65 ± 0.32 10.57 ± 0.23 0.610 ± 0.014 0.533 ± 0.011 0.431 ± 0.008 Herba cirsii 82.06 ± 1.51 51.90 ± 1.02 0.128 ± 0.004 0.094 ± 0.002 0.101 ± 0.002 Herba cirsii japonici 147.64 ± 2.99 90.36 ± 1.83 0.085 ± 0.002 0.102 ± 0.002 0.076 ± 0.001 Herba epimedii 28.38 ± 0.57 14.24 ± 0.28 0.365 ± 0.007 0.296 ± 0.007 0.075 ± 0.001 Herba erodii 10.06 ± 0.20 5.64 ± 0.12 1.085 ± 0.026 0.131 ± 0.003 0.086 ± 0.002 Herba moslae 16.03 ± 0.30 11.02 ± 0.21 0.645 ± 0.015 0.636 ± 0.012 0.478 ± 0.010 Herba portulacae 6.06 ± 0.11 6.94 ± 0.15 1.686 ± 0.034 0.150 ± 0.005 0.142 ± 0.004 Herba senecionis scandentis 17.27 ± 0.38 13.09 ± 0.27 0.607 ± 0.011 0.094 ± 0.002 0.100 ± 0.002 Radix angelicae sinensis 19.92 ± 0.42 13.50 ± 0.28 0.519 ± 0.009 0.148 ± 0.004 0.076 ± 0.001 Radix astragali 27.75 ± 0.56 19.11 ± 0.36 0.380 ± 0.007 0.216 ± 0.002 0.108 ± 0.002 Radix dipsaci 9.50 ± 0.20 6.76 ± 0.15 1.168 ± 0.022 0.102 ± 0.003 0.058 ± 0.001 Radix et rhizoma rhei 90.21 ± 1.90 57.83 ± 1.21 0.126 ± 0.002 0.085 ± 0.001 0.078 ± 0.002 Radix glycyrrhizae 26.71 ± 0.55 16.67 ± 0.32 0.379 ± 0.007 0.092 ± 0.001 0.060 ± 0.001 Radix notoginseng 27.81 ± 0.59 12.84 ± 0.26 0.362 ± 0.006 0.174 ± 0.003 0.111 ± 0.002 Radix paeoniae alba 31.31 ± 0.63 21.20 ± 0.47 0.338 ± 0.008 0.152 ± 0.005 0.106 ± 0.003 Radix paeoniae rubra 46.21 ± 0.92 30.30 ± 0.69 0.232 ± 0.005 0.101 ± 0.002 0.089 ± 0.002 Radix pulsatillae 16.51 ± 0.34 11.72 ± 0.24 0.685 ± 0.014 0.187 ± 0.003 0.225 ± 0.005 Radix rubiae 93.56 ± 1.87 56.45 ± 1.12 0.109 ± 0.002 0.099 ± 0.002 0.222 ± 0.006 Radix scutellartae 80.24 ± 1.62 52.14 ± 1.01 0.146 ± 0.005 0.056 ± 0.001 0.093 ± 0.002 Ramulus uncariae cum uncis 31.53 ± 0.65 20.40 ± 0.30 0.340 ± 0.009 0.091 ± 0.002 0.153 ± 0.002 Rhizoma atractylodis macrocephalae2.88 ± 0.06 4.73 ± 0.05 4.175 ± 0.081 0.074 ± 0.002 0.086 ± 0.002 Rhizoma belamcandae 23.89 ± 0.53 14.71 ± 0.31 0.488 ± 0.013 0.073 ± 0.001 0.163 ± 0.004 Rhizoma chuanxiong 27.62 ± 0.56 16.97 ± 0.33 0.406 ± 0.007 0.244 ± 0.008 0.249 ± 0.007 Rhizoma cimicifugae 22.27 ± 0.45 12.67 ± 0.25 0.511 ± 0.018 0.313 ± 0.010 0.412 ± 0.008 Rhizoma polygont cuspidati 60.96 ± 1.25 41.38 ± 0.53 0.190 ± 0.006 0.097 ± 0.003 0.064 ± 0.002 Rhizoma rhodiolae crenulatae 184.56 ± 3.78 133.98 ± 2.73 0.062 ± 0.002 0.017 ± 0.001 0.109 ± 0.002 Rhizoma sanguisorbae 128.93 ± 2.56 72.38 ± 1.55 0.084 ± 0.002 0.035 ± 0.001 0.059 ± 0.001 Semen euryales 48.42 ± 0.99 30.98 ± 0.66 0.213 ± 0.003 0.225 ± 0.007 0.153 ± 0.005 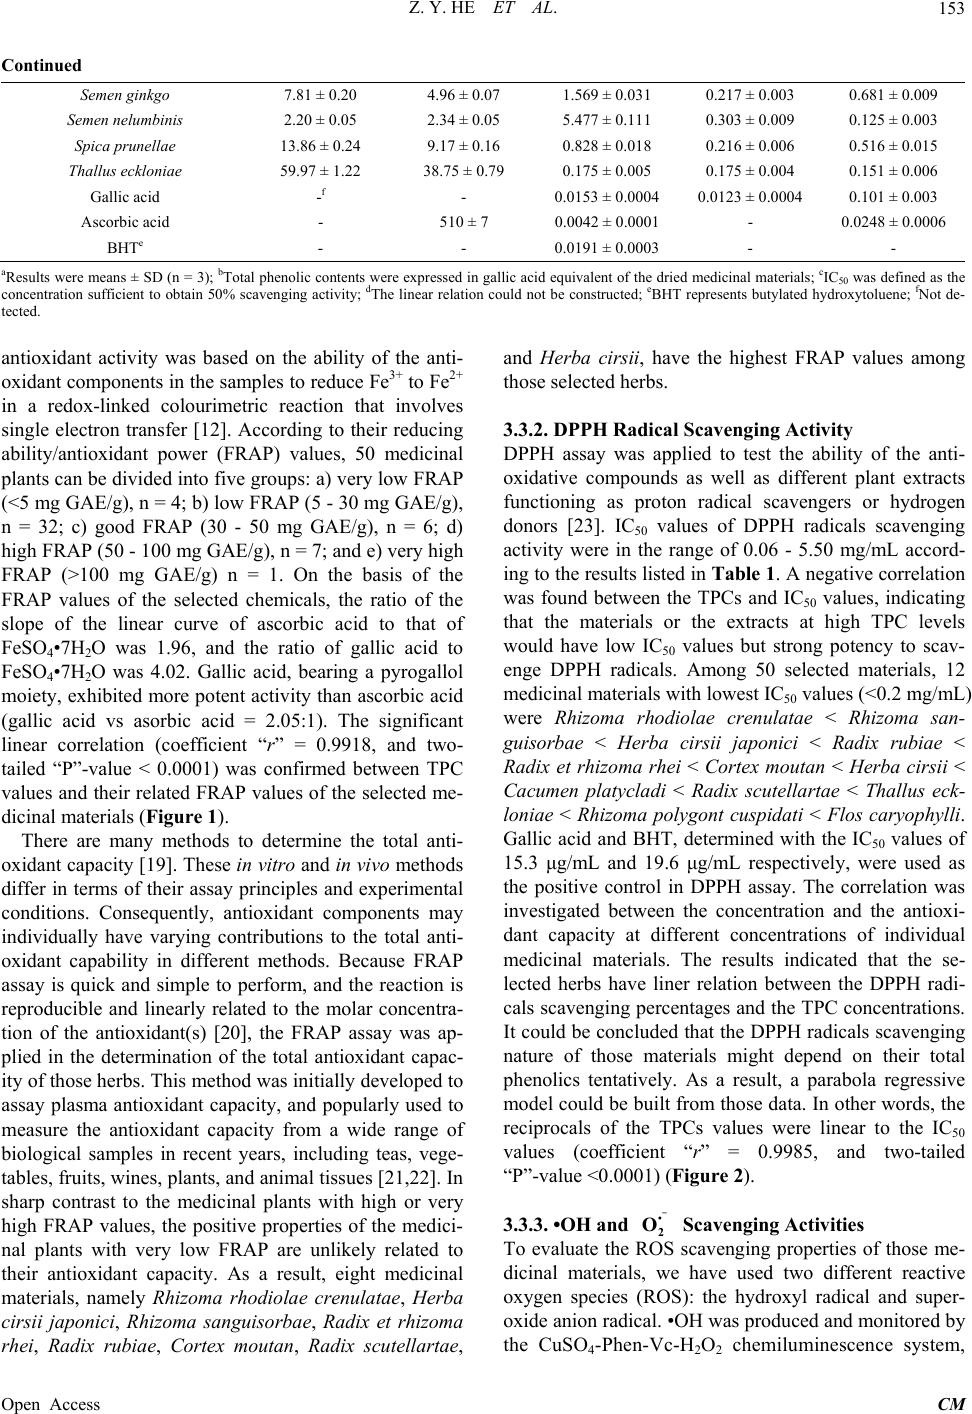 Z. Y. HE ET AL. 153 Continued Semen ginkgo 7.81 ± 0.20 4.96 ± 0.07 1.569 ± 0.031 0.217 ± 0.003 0.681 ± 0.009 Semen nelumbinis 2.20 ± 0.05 2.34 ± 0.05 5.477 ± 0.111 0.303 ± 0.009 0.125 ± 0.003 Spica prunellae 13.86 ± 0.24 9.17 ± 0.16 0.828 ± 0.018 0.216 ± 0.006 0.516 ± 0.015 Thallus eckloniae 59.97 ± 1.22 38.75 ± 0.79 0.175 ± 0.005 0.175 ± 0.004 0.151 ± 0.006 Gallic acid -f - 0.0153 ± 0.0004 0.0123 ± 0.0004 0.101 ± 0.003 Ascorbic acid - 510 ± 7 0.0042 ± 0.0001 - 0.0248 ± 0.0006 BHTe - - 0.0191 ± 0.0003 - - aResults were means ± SD (n = 3); bTotal phenolic contents were expressed in gallic acid equivalent of the dried medicinal materials; cIC50 was defined as the concentration sufficient to obtain 50% scavenging activity; dThe linear relation could not be constructed; eBHT represents butylated hydroxytoluene; fNot de- tected. antioxidant activity was based on the ability of the anti- oxidant components in the samples to reduce Fe3+ to Fe2+ in a redox-linked colourimetric reaction that involves single electron transfer [12]. According to their reducing ability/antioxidant power (FRAP) values, 50 medicinal plants can be divided into five groups: a) very low FRAP (<5 mg GAE/g), n = 4; b) low FRAP (5 - 30 mg GAE/g), n = 32; c) good FRAP (30 - 50 mg GAE/g), n = 6; d) high FRAP (50 - 100 mg GAE/g), n = 7; and e) very high FRAP (>100 mg GAE/g) n = 1. On the basis of the FRAP values of the selected chemicals, the ratio of the slope of the linear curve of ascorbic acid to that of FeSO4•7H2O was 1.96, and the ratio of gallic acid to FeSO4•7H2O was 4.02. Gallic acid, bearing a pyrogallol moiety, exhibited more potent activity than ascorbic acid (gallic acid vs asorbic acid = 2.05:1). The significant linear correlation (coefficient “r” = 0.9918, and two- tailed “P”-value < 0.0001) was confirmed between TPC values and their related FRAP values of the selected me- dicinal materials (Figure 1). There are many methods to determine the total anti- oxidant capacity [19]. These in vitro and in vivo methods differ in terms of their assay principles and experimental conditions. Consequently, antioxidant components may individually have varying contributions to the total anti- oxidant capability in different methods. Because FRAP assay is quick and simple to perform, and the reaction is reproducible and linearly related to the molar concentra- tion of the antioxidant(s) [20], the FRAP assay was ap- plied in the determination of the total antioxidant capac- ity of those herbs. This method was initially developed to assay plasma antioxidant capacity, and popularly used to measure the antioxidant capacity from a wide range of biological samples in recent years, including teas, vege- tables, fruits, wines, plants, and animal tissues [21,22]. In sharp contrast to the medicinal plants with high or very high FRAP values, the positive properties of the medici- nal plants with very low FRAP are unlikely related to their antioxidant capacity. As a result, eight medicinal materials, namely Rhizoma rhodiolae crenulatae, Herba cirsii japonici, Rhizoma sanguisorbae, Radix et rhizoma rhei, Radix rubiae, Cortex moutan, Radix scutellartae, and Herba cirsii, have the highest FRAP values among those selected herbs. 3.3.2. DPPH Radical Scavenging Activity DPPH assay was applied to test the ability of the anti- oxidative compounds as well as different plant extracts functioning as proton radical scavengers or hydrogen donors [23]. IC50 values of DPPH radicals scavenging activity were in the range of 0.06 - 5.50 mg/mL accord- ing to the results listed in Table 1. A negative correlation was found between the TPCs and IC50 values, indicating that the materials or the extracts at high TPC levels would have low IC50 values but strong potency to scav- enge DPPH radicals. Among 50 selected materials, 12 medicinal materials with lowest IC50 values (<0.2 mg/mL) were Rhizoma rhodiolae crenulatae < Rhizoma san- guisorbae < Herba cirsii japonici < Radix rubiae < Radix et rhizoma rhei < Cortex moutan < Herba cirsii < Cacumen platycladi < Radix scutellartae < Thallus eck- loniae < Rhizoma polygont cuspidati < Flos caryophylli. Gallic acid and BHT, determined with the IC50 values of 15.3 μg/mL and 19.6 μg/mL respectively, were used as the positive control in DPPH assay. The correlation was investigated between the concentration and the antioxi- dant capacity at different concentrations of individual medicinal materials. The results indicated that the se- lected herbs have liner relation between the DPPH radi- cals scavenging percentages and the TPC concentrations. It could be concluded that the DPPH radicals scavenging nature of those materials might depend on their total phenolics tentatively. As a result, a parabola regressive model could be built from those data. In other words, the reciprocals of the TPCs values were linear to the IC50 values (coefficient “r” = 0.9985, and two-tailed “P”-value <0.0001) (Figure 2). 3.3.3. •OH and Scavenging Activities • 2 O - To evaluate the ROS scavenging properties of those me- dicinal materials, we have used two different reactive oxygen species (ROS): the hydroxyl radical and super- oxide anion radical. •OH was produced and monitored by the CuSO4-Phen-Vc-H2O2 chemiluminescence system, Open Access CM  Z. Y. HE ET AL. 154 050100 150 200 0 20 40 60 80 100 120 140 FRAP (mg GAE/g) Total Phenolic Contents (mg GAE/g) Figure 1. Linear correlation between the amount of total phenolics and the total antioxidant capacity (FRAP), y = 0.6509x − 0.3783. Correlation coefficient “r” = 0.9918. The two-tailed P value is <0.0001, considered extremely signifi- cant. 0.00.10.20.30.4 0 1 2 3 4 5 6 0.5 IC50 of DPPH rad ical ( m g / mL ) 1/(Total Phenolic Contents) (mg GAE/g)-1 Figure 2. Linear correlation between the reciprocals of the total phenolic content and IC50 values of DPPH scavenging activity, y = 11.9209x − 0.0406. Correlation coefficient “r” = 0.9985. The two-tailed P value is < 0.0001, considered ex- tremely significant. whereas was generated by the hypoxanthinexan- thine oxidase system and detected by UV-Vis spectro- photometry. The results of the ROS scavenging capaci- ties, in the form of IC50 values of those herbs, were pre- sented in Table 1. The IC50 values of •OH and • 2 O • 2 O v ied in the ranges of 0.017 - 0.636 mg/mL and 0.050 - 0.681 mg/mL respectively. In the superoxide anion radi- cal assay, only Flos caryophylli did not exhibit correla- tion between the free radicals scavenging percentage and the concentration. Comparison of the ROS scavenging characteristics of those medicinal materials, Herba moslae has the highest potency to scavenge the hydroxyl radicals, whereas Semen ginkgo is the highest in the su- peroxide anion radical assay. According to the results, there was a weak linear relation between IC50 values of the hydroxyl radical and the superoxide anion radical scavenging activities (coefficient “r” = 0.6442, and two-tailed “P”-value <0.0001). The individual extracts, which could scavenge the hydroxyl radicals, can not necessarily eliminate the superoxide anion radicals. As a result, traditional Chinese herbs have specific ROS scavenging properties respectively, which can be applied in the explanation of the rules of compatibility of medi- cines in the traditional Chinese medicine. In the ROS scavenging experiments, there was no lin- ear response between the total phenolic contents and the free radicals scavenging activities, other factors should be considered in the evaluation of the ROS scavenging capacities. There were several methods to screen the ROS scavengers, different methods could give varied results for the unstable characteristics of the ROS in chemical or biochemical systems. The total phenolics content in the extracts could be correlated linearly with the oxygen depletion, but not with the ROS scavenging effect by different methods using ESR spin trapping and electrochemical measurement [24]. Other scientists also have not found linear response between the total pheno- lics and the ROS scavenging capacities [8]. The differ- ence between the sterical structures of antioxidants or the free radicals played a more important role in the abilities to scavenge different types of free radicals [25], which could be applied in the explanation of the antioxidant variations between the DPPH•, •OH, and • 2 O scaveng- ing activities. In DPPH assay, the 60 % ethanol extracts showed higher scavenging activity than the 95 % ethanol extracts. The similar conclusion could be drawn from the results of the extracts by different polar solvents in •OH and • 2 O assays. It suggests that more-polar components presented in extracts have contributed towards the in- creased ROS scavenging activities. Although there was no direct evidence in this study, the antioxidant activities of 60% ethanol extracts could be related to the presence of phenolic compounds, peptides, saccharides, and other polar compounds because they contain hydroxyl moiety [26,27]. 3.3.4. Comparison of Antioxidant Activities of 50 Medicinal Materials Influenced by several biofactors, such as the ROS and other free radicals occurrence, the redox status in human body, and the bioavailability of the phytochemicals, the traditional Chinese herbs would act as more complicated roles in the life processes than the chemical or bio- chemical systems in vitro. According to the classification of their medicinal usages in the traditional Chinese medicine, 18 of those herbs, including 11 stanchers, were traditionally used as the haematic. Those haematic drugs, especially the stanchers, have highest TPC values and ar- Open Access CM 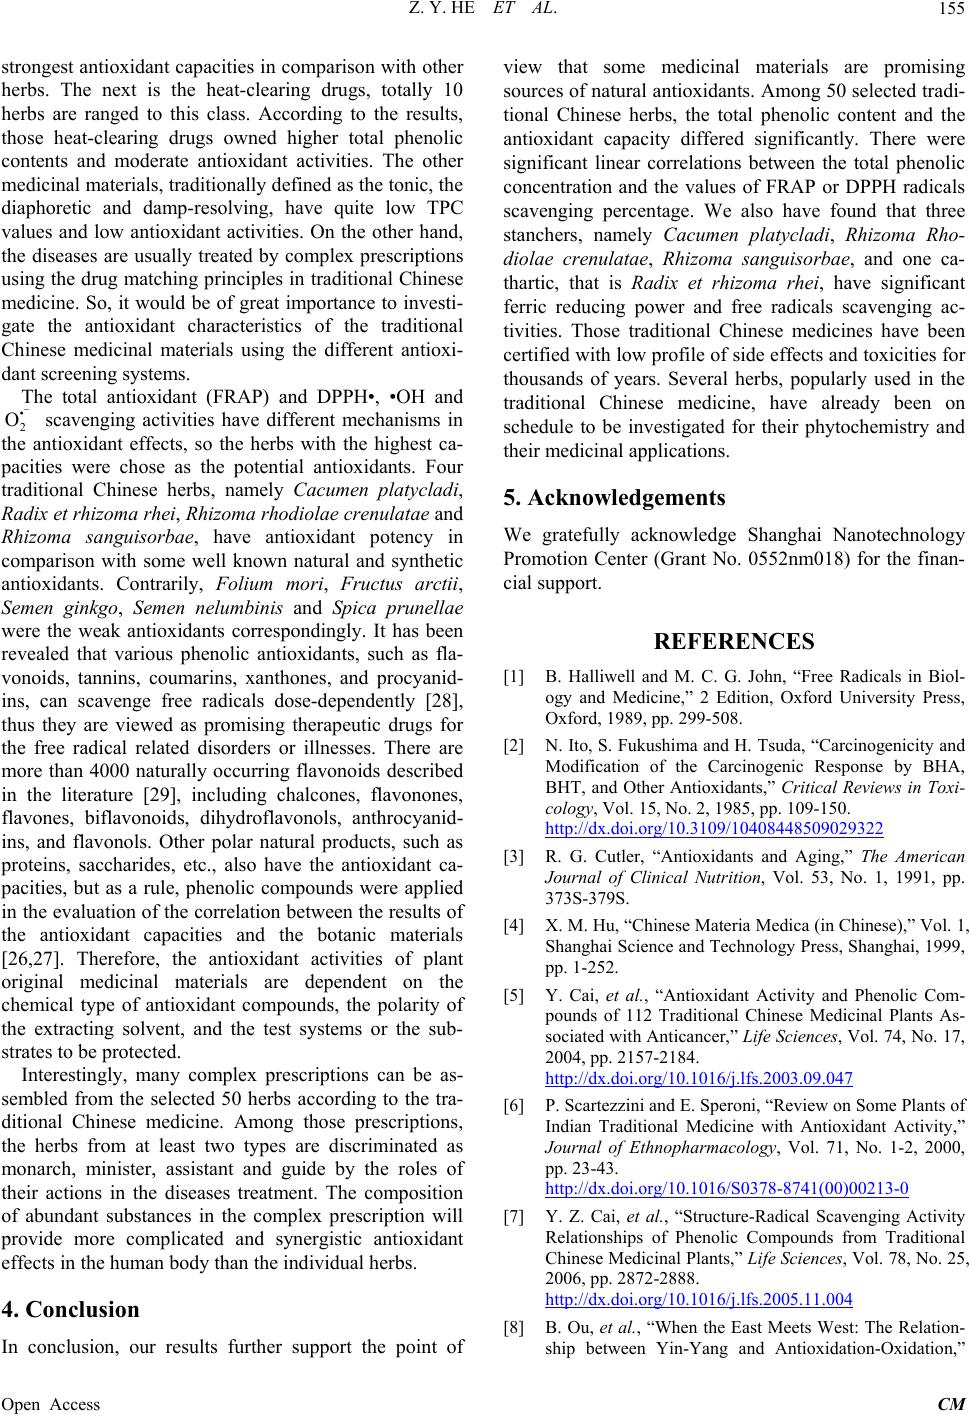 Z. Y. HE ET AL. 155 strongest antioxidant capacities in comparison with other herbs. The next is the heat-clearing drugs, totally 10 herbs are ranged to this class. According to the results, those heat-clearing drugs owned higher total phenolic contents and moderate antioxidant activities. The other medicinal materials, traditionally defined as the tonic, the diaphoretic and damp-resolving, have quite low TPC values and low antioxidant activities. On the other hand, the diseases are usually treated by complex prescriptions using the drug matching principles in traditional Chinese medicine. So, it would be of great importance to investi- gate the antioxidant characteristics of the traditional Chinese medicinal materials using the different antioxi- dant screening systems. The total antioxidant (FRAP) and DPPH•, •OH and scavenging activities have different mechanisms in the antioxidant effects, so the herbs with the highest ca- pacities were chose as the potential antioxidants. Four traditional Chinese herbs, namely Cacumen platycladi, Radix et rhizoma rhei, Rhizoma rhodiolae crenu lata e and Rhizoma sanguisorbae, have antioxidant potency in comparison with some well known natural and synthetic antioxidants. Contrarily, Folium mori, Fructus arctii, Semen ginkgo, Semen nelumbinis and Spica prunellae were the weak antioxidants correspondingly. It has been revealed that various phenolic antioxidants, such as fla- vonoids, tannins, coumarins, xanthones, and procyanid- ins, can scavenge free radicals dose-dependently [28], thus they are viewed as promising therapeutic drugs for the free radical related disorders or illnesses. There are more than 4000 naturally occurring flavonoids described in the literature [29], including chalcones, flavonones, flavones, biflavonoids, dihydroflavonols, anthrocyanid- ins, and flavonols. Other polar natural products, such as proteins, saccharides, etc., also have the antioxidant ca- pacities, but as a rule, phenolic compounds were applied in the evaluation of the correlation between the results of the antioxidant capacities and the botanic materials [26,27]. Therefore, the antioxidant activities of plant original medicinal materials are dependent on the chemical type of antioxidant compounds, the polarity of the extracting solvent, and the test systems or the sub- strates to be protected. • 2 O Interestingly, many complex prescriptions can be as- sembled from the selected 50 herbs according to the tra- ditional Chinese medicine. Among those prescriptions, the herbs from at least two types are discriminated as monarch, minister, assistant and guide by the roles of their actions in the diseases treatment. The composition of abundant substances in the complex prescription will provide more complicated and synergistic antioxidant effects in the human body than the individual herbs. 4. Conclusion In conclusion, our results further support the point of view that some medicinal materials are promising sources of natural antioxidants. Among 50 selected tradi- tional Chinese herbs, the total phenolic content and the antioxidant capacity differed significantly. There were significant linear correlations between the total phenolic concentration and the values of FRAP or DPPH radicals scavenging percentage. We also have found that three stanchers, namely Cacumen platycladi, Rhizoma Rho- diolae crenulatae, Rhizoma sanguisorbae, and one ca- thartic, that is Radix et rhizoma rhei, have significant ferric reducing power and free radicals scavenging ac- tivities. Those traditional Chinese medicines have been certified with low profile of side effects and toxicities for thousands of years. Several herbs, popularly used in the traditional Chinese medicine, have already been on schedule to be investigated for their phytochemistry and their medicinal applications. 5. Acknowledgements We gratefully acknowledge Shanghai Nanotechnology Promotion Center (Grant No. 0552nm018) for the finan- cial support. REFERENCES [1] B. Halliwell and M. C. G. John, “Free Radicals in Biol- ogy and Medicine,” 2 Edition, Oxford University Press, Oxford, 1989, pp. 299-508. [2] N. Ito, S. Fukushima and H. Tsuda, “Carcinogenicity and Modification of the Carcinogenic Response by BHA, BHT, and Other Antioxidants,” Critical Reviews in Toxi- cology, Vol. 15, No. 2, 1985, pp. 109-150. http://dx.doi.org/10.3109/10408448509029322 [3] R. G. Cutler, “Antioxidants and Aging,” The American Journal of Clinical Nutrition, Vol. 53, No. 1, 1991, pp. 373S-379S. [4] X. M. Hu, “Chinese Materia Medica (in Chinese),” Vol. 1, Shanghai Science and Technology Press, Shanghai, 1999, pp. 1-252. [5] Y. Cai, et al., “Antioxidant Activity and Phenolic Com- pounds of 112 Traditional Chinese Medicinal Plants As- sociated with Anticancer,” Life Sciences, Vol. 74, No. 17, 2004, pp. 2157-2184. http://dx.doi.org/10.1016/j.lfs.2003.09.047 [6] P. Scartezzini and E. Speroni, “Review on Some Plants of Indian Traditional Medicine with Antioxidant Activity,” Journal of Ethnopharmacology, Vol. 71, No. 1-2, 2000, pp. 23-43. http://dx.doi.org/10.1016/S0378-8741(00)00213-0 [7] Y. Z. Cai, et al., “Structure-Radical Scavenging Activity Relationships of Phenolic Compounds from Traditional Chinese Medicinal Plants,” Life Sciences, Vol. 78, No. 25, 2006, pp. 2872-2888. http://dx.doi.org/10.1016/j.lfs.2005.11.004 [8] B. Ou, et al., “When the East Meets West: The Relation- ship between Yin-Yang and Antioxidation-Oxidation,” Open Access CM  Z. Y. HE ET AL. Open Access CM 156 The FASEB Journal: Official Publication of the Federa- tion of American Societies for Experimental Biology, Vol. 17, No. 2, 2003, pp. 127-129. [9] Y. T. Szeto and I. F. Benzie, “Is the Yin-Yang Nature of Chinese Herbal Medicine Equivalent to Antioxidation- Oxidation?” Journal of Ethnopharmacology, Vol. 108, No. 3, 2006, pp. 361-366. http://dx.doi.org/10.1016/j.jep.2006.05.033 [10] D. Wormuth, et al., “Redox Regulation and Antioxidative Defence in Arabidopsis Leaves Viewed from a Systems Biology Perspective,” Journal of Biotechnology, Vol. 129, No. 2, 2007, pp. 229-248. http://dx.doi.org/10.1016/j.jbiotec.2006.12.006 [11] V. L. Singleton and J. A. Rossi, “Colorimetry of Total Phenolics with Phosphomolybdic-Phosphotungstic Acid Reagents,” American Journal of Enology and Viticulture, Vol. 16, No. 3, 1965, pp. 144-158. [12] I. F. F. Benzie and J. J. Strain, “The Ferric Reducing Ability of Plasma (FRAP) as a Measure of ‘Antioxidant Power’: The FRAP Assay,” Analytical Biochemistry, Vol. 239, No. 1, 1996, pp. 70-76. http://dx.doi.org/10.1006/abio.1996.0292 [13] T. Katsube, et al., “Screening for Antioxidant Activity in Edible Plant Products: Comparison of Low-Density Lipo- protein Oxidation Assay, DPPH Radical Scavenging As- say, and Folin-Ciocalteu Assay,” Journal of Agricultural and Food Chemistry, Vol. 52, No. 8, 2004, pp. 2391-6. http://dx.doi.org/10.1021/jf035372g [14] C. H. Tsai, et al., “Rapid and Specific Detection of Hy- droxyl Radical Using an Ultraweak Chemiluminescence Analyzer and a Low-Level Chemiluminescence Emitter: Application to Hydroxyl Radical-Scavenging Ability of Aqueous Extracts of Food Constituents,” Journal of Ag- ricultural and Food Chemistry, Vol. 49, No. 5, 2001, pp. 2137-2141. http://dx.doi.org/10.1021/jf001071k [15] Y. Oyangui, “Reealuative of Assay Methods and Estab- lishment of Kit for Superoxide Dismutase Activity,” Ana- lytical Biochemistry, Vol. 142, No. 2, 1984, pp. 290-296. http://dx.doi.org/10.1016/0003-2697, No. 84)90467-6 [16] J. B. Harborne and C. A. Williams, “Anthocyanins and Other Flavonoids,” Natural Product Reports, Vol. 18, No. 3, 2001, pp. 310-333. http://dx.doi.org/10.1039/b006257j [17] J. B. Harborne and C. A. Williams, “Advances in Flavon- oid Research Since 1992,” Phytochemistry, Vol. 55, No. 6, 2000, pp. 481-504. http://dx.doi.org/10.1016/S0031-9422(00)00235-1 [18] E. N. Frankel, A. L. Waterhouse and P. L. Teissedre, “Principal Phytochemicals in Selected California Wines and Their Antioxidant Activity in Inhibiting Oxidation of Human Low-Density Lipoproteins,” Journal of Agricul- tural and Food Chemistry, Vol. 43, No. 4, 1995, pp. 890- 894. http://dx.doi.org/10.1021/jf00052a008 [19] G. Bartosz, “Total Antioxidant Capacity,” In: H. E. Spiegel, Ed., Advances in Clinical Chemistry, Vol. 37, 2003, Academic Press, New York, pp. 219-292. [20] I. F. F. Benzie, W. Y. Chung and J. J. Strain, “Antioxi- dant (Reducing) Efficiency of Ascorbate in Plasma Is Not Affected by Concentration,” The Journal of Nutritional Biochemistry, Vol. 10, No. 3, 1999, pp. 146-150. http://dx.doi.org/10.1016/S0955-2863(98)00084-9 [21] D. Modun, et al., “The Increase in Human Plasma Anti- oxidant Capacity after Red Wine Consumption Is Due to Both Plasma Urate and Wine Polyphenols,” Atheroscle- rosis, 2007. [22] V. Katalinic, et al., “Screening of 70 Medicinal Plant Extracts for Antioxidant Capacity and Total Phenols,” Food Chemistry, Vol. 94, No. 4, 2006, pp. 550-557. http://dx.doi.org/10.1016/j.foodchem.2004.12.004 [23] T. Nomura, et al., “Proton-Donative Antioxidant Activity of Fucoxanthin with 1,1-Diphenyl-2-picrylhydrazyl (DPPH),” Biochemistry and Molecular Biology Interna- tional, Vol. 42, No. 2, 1997, pp. 361-370. [24] H. L. Madsen, et al., “Screening of Antioxidantive Activ- ity of Spices. A Comparison between Assays Based on ESR Spin Trapping and Electrochemical Measurement of Oxygen Consumption,” Food Chemistry, Vol. 57, No. 2, 1996, pp. 331-337. http://dx.doi.org/10.1016/0308-8146(95)00248-0 [25] Q. Guo, et al., “ESR and Cell Culture Studies on Free Radical-Scavenging and Antioxidant Activities of Isofla- vonoids,” Toxicology, Vol. 179, No. 1-2, 2002, pp. 171- 180. http://dx.doi.org/10.1016/S0300-483X(02)00241-X [26] L. E. Netto, et al., “Reactive Cysteine in Proteins: Protein Folding, Antioxidant Defense, Redox Signaling and More. Comparative Biochemistry and Physiology,” Toxicology & Pharmacology: CBP, Vol. 146, No. 1-2, 2007, pp. 180- 193. [27] A. Kardosová and E. Machová, “Antioxidant Activity of medicinal Plant Polysaccharides,” Fitoterapia, Vol. 77, No. 5, 2006, pp. 367-373. http://dx.doi.org/10.1016/j.fitote.2006.05.001 [28] Y. C. Zhou and R. L. Zheng, “Phenolic Compounds and an Analog as Superoxide Anion Scavengers and Antioxi- dants,” Biochemical Pharmacology, Vol. 42, No. 6, 1991, pp. 1177-1179. http://dx.doi.org/10.1016/0006-2952(91)90251-Y [29] E. Grotewold, “The Science of Flavonoids,” Springer Science & Business Media, Inc., New York, 2006, pp. 1-47. Abbreviations FRAP: ferric reducing/antioxidant power GAE: gallic acid equivalent IC50: exact concentration providing 50% inhibition BHT: butylated hydroxytoluene DPPH•: the free radical of di(phenyl)-(2,4,6-trinitro- phenyl)iminoazanium ROS: reactive oxygen species RNS: reactive nitrogen species TPC: total phenolic content CL: chemiluminescence
|